Section I: Crime & Punishment in the U.S.
Crime
- Percent of violent offenses that resulted in an emergency room visit72: 19%
- Percent of state felony convictions that were for violent offenses, 199673: 16.8%
- Percent of state felony convictions that were for murder, 199674: 0.9%
- Percent of state felony convictions that were for rape, 199675: 1.4%
- Percent of state felony convictions that were for property offenses, 199676: 29.9%
- Percent of state felony convictions that were for drug offenses (all), 199677: 34.8%
- Percent of state felony convictions that were for drug possession, 199678: 13.6%
- Percent of state felony convictions that were for weapons offenses, 199679: 3.3%
- Percent of all crimes reported to the police80: 36.3%
- Percent of completed auto thefts reported to the police81: 94%
- Percent of all assaults reported to the police82: 42.6%
Victims of crime: Who is at greatest risk?
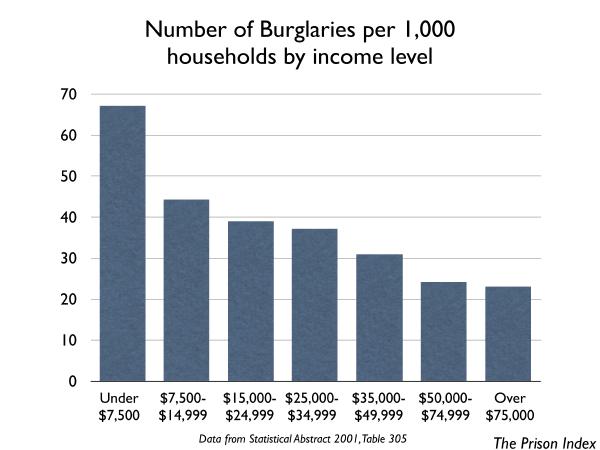
- Number of burglaries per 1,000 households with an income under $7,50083: 67.0
- Number of burglaries per 1,000 households with an income between $7,500-$14,99984: 44.2
- Number of burglaries per 1,000 households with an income between $15,000-$24,99985: 38.9
- Number of burglaries per 1,000 households with an income between $25,000-$34,99986: 37.1
- Number of burglaries per 1,000 households with an income between $35,000-$49,99987: 30.9
- Number of burglaries per 1,000 households with an income between $50,000-$74,99988: 24.1
- Number of burglaries per 1,000 households with an income of $75,000 or more89: 23.1
- Percent of people in 2000 making more than $50,000 reporting they were afraid to walk alone in the dark near their homes90: 28%
- Percent of people in 2000 making less than $20,000 reporting they were afraid to walk alone in the dark near their homes91: 50%
This page is an excerpt from The Prison Index: Taking the Pulse of the Crime Control Industry (April 2003) by Peter Wagner, published by the Western Prison Project and the Prison Policy Initiative.
Footnotes
72 Bureau of Justice Statistics, Injuries from Violent Crime, 1992-98, p. 3.
73 Bureau of Justice Statistics, Sourcebook of Criminal Justice Statistics, 2000, Table 5.40
74 Bureau of Justice Statistics, Sourcebook of Criminal Justice Statistics, 2000, Table 5.40
75 Bureau of Justice Statistics, Sourcebook of Criminal Justice Statistics, 2000, Table 5.40
76 Bureau of Justice Statistics, Sourcebook of Criminal Justice Statistics, 2000, Table 5.40
77 Bureau of Justice Statistics, Sourcebook of Criminal Justice Statistics, 2000, Table 5.40
78 Bureau of Justice Statistics, Sourcebook of Criminal Justice Statistics, 2000, Table 5.40
79 Bureau of Justice Statistics, Sourcebook of Criminal Justice Statistics, 2000, Table 5.40
80 Bureau of Justice Statistics, Sourcebook of Criminal Justice Statistics, 2000, Table 3.38.
81 Bureau of Justice Statistics, Sourcebook of Criminal Justice Statistics, 2000, Table 3.38.
82 Bureau of Justice Statistics, Sourcebook of Criminal Justice Statistics, 2000, Table 3.38.
83 Statistical Abstract of the United States: 2001, The National Data Book, Table 305
84 Statistical Abstract of the United States: 2001, The National Data Book, Table 305
85 Statistical Abstract of the United States: 2001, The National Data Book, Table 305
86 Statistical Abstract of the United States: 2001, The National Data Book, Table 305
87 Statistical Abstract of the United States: 2001, The National Data Book, Table 305
88 StatisticalAbstract 2001, Table 305
89 Statistical Abstract of the United States: 2001, The National Data Book, Table 305
90 Bureau of Justice Statistics, Sourcebook of Criminal Justice Statistics, 2000, Table 2.40.
91 Bureau of Justice Statistics, Sourcebook of Criminal Justice Statistics, 2000, Table 2.40.
Recommended Reading:

The unmet health needs of people in prison
States fall far short of their duty to meet the health needs of incarcerated people.

All profit, no risk
The bail industry exploits cracks and loopholes in the legal system to avoid accountability, while growing its profits.

Compare your state's use of the prison to the world at large
Criminal justice policy in every region of the United States is out of step with the rest of the world.

Prison Gerrymandering Project
We are leading the movement to protect our democracy from the Census Bureau's prison miscount.
Events
- April 15-17, 2025:
Sarah Staudt, our Director of Policy and Advocacy, will be attending the MacArthur Safety and Justice Challenge Network Meeting from April 15-17 in Chicago. Drop her a line if you’d like to meet up!
Not near you?
Invite us to your city, college or organization.