Section III: The Prison Economy
The Prison Industry
- Number of correctional facilities, 1995438: 1500
- Cost to run the prisons and jails in all 50 states and the federal prison system, 1999439: $49 billion
- Average cost to incarcerate a prisoner for a year, 1996440: $20,142
- Average cost to incarcerate a prisoner per day, 1996441: $55.18
- Prison expenditure per prisoner per day in Alabama, 1996442: $21.88
- Prison expenditure per prisoner per day in Minnesota, 1996443: $103.63
Captive consumers
- Value of 1995 Dial Soap contract with the New York City jail system444: $100,000
- Value of VitaPro meat substitute contract with the state of Texas445: $34 million
- Value of annual market selling collect phone calls to prisoners and their families446: $1 billion
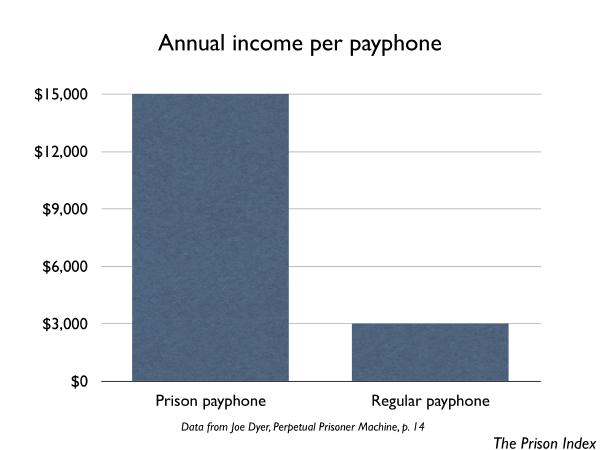
- Income from one prison payphone per year447: $15,000
- Income from average payphone per year outside of a prison448: $3,000
Employment
- Percent of civilian labor force unemployed, United States, 2000449: 4.0%
- Percent of civilian labor force unemployed, if prisoners were not in prison but unemployed: 4505.3%
- Estimated percent of civilian labor force that is in prison, or works in corrections, private security, or in the portions of the police and courts related to crime control451: 3.9%
- Percent of civilian labor force that works in farming, forestry or fishing, 2000452: 2.4%
- Average starting salary for a correctional officer in 2001453: $23,627
- Starting salary for a correctional officer in New Jersey, 2001454: $36,850
- Starting salary for a correctional officer in Oklahoma, 2001455: $16,672
- Starting salary for a correctional officer in New Mexico, 2001456: $15,943
- Poverty line for a family of four, 1999457: $17,029
- Approximate percentage of positions open in the Oklahoma Department of Corrections458: 20%
Construction
- Number of new prisons opened in the United States, 2000459: 24
- Number of beds in new prisons opened in the United States, 2000460: 18,526
- Number of beds added to prisons renovated in the United States, 2000461: 10,243
- Number of new prisons under construction on January 1, 2001462: 39
- Number of existing prisons undergoing renovations or additions on January 1, 2001463: 62
- Number of beds to be added by prison construction or additions underway on January 1, 2001464: 58,422
Where are prisons built?
- Percentage of prisons built in rural counties465: 60%
- Percentage of population that lives in rural counties466: 20%
- Average number of new prisons built in rural areas, per year, in the 1960s and 1970s467: 4
- Average number of new prisons built in rural areas, per year, in the 1980s468: 16
- Average number of new prisons built in rural areas, per year, in the 1990s469: 25
- Average number of days between new prisons opening in a rural area in the 1990s470: 15
- On average, percent of jobs in a new prison that go to residents outside the town where the prison is built471: 80%
- Number of jobs created by a new prison in Malone, NY472: 750
- Due to Department of Correctional Services seniority rules, less than this number of jobs went to Malone residents473: 100
California's Prison Economy
- Number of prisoners in California, 2001474: 159,444
- Number of prisons built, 1984-1994475: 21
- Average Correctional officer salary, 1996476: $44,000
- Average public school teacher salary, 1996477: $34,000
- Rank of the California Correctional Peace Officers Association (CCPOA), the union representing prison guards, among contributors to California political campaigns478: 1
- Amount spent by CCPOA to pass the 3 strikes law, requiring life sentences for 3rd time felony offenders479: $101,000
- Amount spent by the CCPOA to elect Governor Davis in 1998480: $2 million
- Number of disease outbreaks affecting prison workers in the first four months of 2002 known to the CCPOA and Department of Corrections481: 0
- Percent increase in guards calling in sick in the four months after Governor Davis approved a new labor agreement with the guard union restricting wardens from disciplining officers who abuse the process of calling in sick482: 20%
- Percent increase in sick time during the same period at the California Highway Patrol483: 1%
- Increase in cost of overtime to cover for sick officers during those 4 months, in dollars484: $58.4 million
- Percent rise in prison guards' pay over 5 years in the new contract485: 34%
- Cost to the state of the new raises, in dollars486: $680 million
- Projected California budget shortfall, in dollars487: $24 billion
- Months between Gov. Davis' signature on legislation implementing the new contract and his re-election campaign's receipt of $251,000 in contributions from the California Correctional Peace Officer's Association488: 2
This page is an excerpt from The Prison Index: Taking the Pulse of the Crime Control Industry (April 2003) by Peter Wagner, published by the Western Prison Project and the Prison Policy Initiative.
Footnotes
438 Statistical Abstract of the United States: 2001, The National Data Book. Table 331
439 Bureau of Justice Statistics, Justice Expenditures and Employment in the United States, 1999, Table 3.
440 Statistical Abstract of the United States: 2001, The National Data Book. Table 333
441 Statistical Abstract of the United States: 2001, The National Data Book. Table 333
442 Statistical Abstract of the United States: 2001, The National Data Book. Table 333
443 Statistical Abstract of the United States: 2001, The National Data Book. Table 333
444 Joel Dyer, Perpetual Prisoner Machine, p. 14
445 Joel Dyer, Perpetual Prisoner Machine, p. 14
446 Joel Dyer, Perpetual Prisoner Machine, p. 14
447 Joel Dyer, Perpetual Prisoner Machine, p. 14
448 Joel Dyer, Perpetual Prisoner Machine, p. 14
449 Statistical Abstract of the United States: 2001, The National Data Book, Table 567.
450 Calculation adding the number of prisoners and jail inmates in 2000 (1.97million) to the total labor force population and the unemployed; Statistical Abstract, 2001, Table 567.
451 Nils Christie, Crime Control as Industry, 2000 ed, Table 8.6-2.
452 Calculation, Statistical Abstract of the United States: 2001, The National Data Book, Table 567, 593.
453 Corrections Yearbook 2001, p. 169.
454 Corrections Yearbook 2001, p. 168.
455 Corrections Yearbook 2001, p. 168
456 Corrections Yearbook 2001, p. 168.
457 Statistical Abstract of the United States: 2001, The National Data Book, Table 681.
458 Pam Belluck, “Desperate for Prison Guards, Some States Rob Cradles”New York Times. April 21, 2001.
459 Corrections Yearbook 2001, p. 87.
460 Corrections Yearbook 2001, p. 87.
461 Corrections Yearbook 2001, p. 88.
462 Corrections Yearbook2001, p. 90.
463 Corrections Yearbook 2001, p. 90.
464 Corrections Yearbook 2001, p. 90.
465 Calvin L. Beale, Rural Prisons: An Update. Rural Development Perspectives, Vol 11. No. 2. p 25.
466 Calvin L. Beale, Rural Prisons: An Update. Rural Development Perspectives, Vol 11. No. 2. p 25.
467 Tracy Huling, Building a Prison Economy in Rural America, in Invisible Punishment: The Collateral Consequences of Mass Imprisonment, edited by Marc Mauer and Meda Chesney-Lind, 2002, p. 198.
468 Tracy Huling, Building a Prison Economy in Rural America, in Invisible Punishment: The Collateral Consequences of Mass Imprisonment, edited by Marc Mauer and Meda Chesney-Lind, 2002, p. 198.
469 Tracy Huling, Building a Prison Economy in Rural America, in Invisible Punishment: The Collateral Consequences of Mass Imprisonment, edited by Marc Mauer and Meda Chesney-Lind, 2002, p. 198.
470 Tracy Huling, Building a Prison Economy in Rural America, in Invisible Punishment: The Collateral Consequences of Mass Imprisonment, edited by Marc Mauer and Meda Chesney-Lind, 2002, p. 198.
471 Tracy Huling, Building a Prison Economy in Rural America, in Invisible Punishment: The Collateral Consequences of Mass Imprisonment, edited by Marc Mauer and Meda Chesney-Lind, 2002, p. 201.
472 Tracy Huling, Building a Prison Economy in Rural America, in Invisible Punishment: The Collateral Consequences of Mass Imprisonment, edited by Marc Mauer and Meda Chesney-Lind, 2002, p. 201.
473 Tracy Huling, Building a Prison Economy in Rural America, in Invisible Punishment: The Collateral Consequences of Mass Imprisonment, edited by Marc Mauer and Meda Chesney-Lind, 2002, p. 201.
474 Bureau of Justice Statistics, Prisoners in 2001, Table 3.
475 Justice Policy Institute, From Classrooms to Cell Blocks
476 Daniel Burton Rose, ed. The Celling of America, p. 134.
477 Daniel Burton Rose, ed. The Celling of America, p. 134.
478 “Strong Arm of the Law”Pamela Maclean, San Francisco Bay Guardian Dec 4, 2002.
479 “Strong Arm of the Law”Pamela Maclean, San Francisco Bay Guardian Dec 4, 2002.
480 “Prison Guards’ Sick Leave Usage Soars as Rules Shift” Los Angeles Times June 27 2002
481 “Prison Guards’ Sick Leave Usage Soars as Rules Shift” Los Angeles Times June 27 2002
482 “Prison Guards’ Sick Leave Usage Soars as Rules Shift” Los Angeles Times June 27 2002
483 “Prison Guards’ Sick Leave Usage Soars as Rules Shift” Los Angeles Times June 27 2002
484 “Prison Guards’ Sick Leave Usage Soars as Rules Shift” Los Angeles Times June 27 2002
485 “Prison Guards’ Sick Leave Usage Soars as Rules Shift” Los Angeles Times June 27 2002
486 “Prison Guards’ Sick Leave Usage Soars as Rules Shift” Los Angeles Times June 27 2002
487 “Prison Guards’ Sick Leave Usage Soars as Rules Shift” Los Angeles Times June 27 2002
488 “Prison Guards’ Sick Leave Usage Soars as Rules Shift” Los Angeles Times June 27 2002
Recommended Reading:

Advocacy Toolkit
Resources, tips, and best practices to help advocates working to end mass incarceration.

50 state incarceration profiles
All of our recent reports about prison/jail growth, racial disparities, and more, re-organized by state.

Mass Incarceration: The Whole Pie
The U.S. incarcerates nearly 2 million people. Where are they locked up and why? Read our report.

Events
- April 30, 2025:
On Wednesday, April 30th, at noon Eastern, Communications Strategist Wanda Bertram will take part in a panel discussion with The Center for Just Journalism on the 100th day of the second Trump administration. They’ll discuss the impacts the administration has had on criminal legal policy and issues that have flown under the radar. Register here.
Not near you?
Invite us to your city, college or organization.