Chronic Punishment: The unmet health needs of people in state prisons
By Leah Wang
June 2022
Press release
Over 1 million people sit in U.S. state prisons on any given day. These individuals are overwhelmingly poor, disproportionately Black, Native, Hispanic, and/or LGBTQ, and often targeted by law enforcement from a young age, as we detailed recently in our report Beyond the Count. And all too often, they are also suffering from physical and mental illnesses, or navigating prison life with disabilities or even pregnancy. In this, the second installment of our analysis of a unique, large-scale survey of people in state prisons, we add to the existing research showing that state prisons fall far short of their constitutional duty to meet the essential health needs of people in their custody. As a result, people in state prison are kept in a constant state of illness and despair.
Instead of “rehabilitating” people in prison (physically, mentally or otherwise), or at the very least, serving as a de facto health system for people failed by other parts of the U.S. social safety net, data from the most recent national Survey of Prison Inmates show that state prisons are full of ill and neglected people. Paired with the fact that almost all of these individuals are eventually released, bad prison policy is an issue for all of us — not just those who are behind bars.
This report covers a lot of ground, so we’ve divided it into sections that can be accessed directly here:
- Physical health problems: Chronic conditions and infectious disease ⤵
- Access to healthcare: People in state prison disproportionately lacked health insurance ⤵
- Mental health problems: Exceptionally high rates among incarcerated people ⤵
- Disabilities: Disproportionate rates of physical, cognitive, and learning disabilities ⤵
- Pregnancy and reproductive health: Expectant mothers are underserved in prison ⤵
- Conclusions and recommendations: How do we begin to address unmet needs in prisons? ⤵
- Methodology: Details about the data and our analysis ⤵
- Appendix tables: Explore the data yourself ⤵
About the unique data used in this report
This report offers a detailed view of the people in state prisons nationwide, using the most recent self-reported, nationally representative data available, the Bureau of Justice Statistics’ 2016 Survey of Prison Inmates. Though correctional populations are in constant flux, the Survey data released just over a year ago are essential to understanding incarceration today.
While the Bureau of Justice Statistics, the federal agency that collected the data, has published its own series of reports based on its findings, we designed this report to include many details overlooked in the government’s reports. We surface important details about identity, life experiences, health, and more. Where we can, we compare the data to those collected in decades prior or to measures of the general U.S. population, to get a sense of how prison populations compare and how state policies have changed, or remained stagnant. For more details about our analysis, see the Methodology.
Readers may already be asking how the data look by state, or when we’ll have more current data. Unfortunately, these survey data are not available state-by-state, and we estimate it may be another several years before the survey is fielded again (this survey has not been on a regular publication schedule since 2004, with 12 years between the two most recent data collections). But the information presented here is a powerful supplement to other state-specific incarceration data, creating a strong foundation for advocacy and sound policymaking.
Physical health problems: Rates of many illnesses in prison are disproportionately high ⤴
The 2016 Survey data show that huge proportions of people in state prisons are impacted by disease, disability, and/or mental illness.1 As we detail below, incarcerated people have higher rates of certain chronic conditions and infectious diseases compared to the general U.S. population in many, but not all, cases. In cases where rates of illness are not higher, we must consider that rates of undiagnosed conditions and disease among incarcerated people are likely to be higher due to inadequate screening before and during prison. In addition, people in prison rely on — and are burdened by — having to request medical appointments through correctional staff, and having to pay unaffordable fees (“co-pays”) for care.

It’s important to remember that these comparisons are not intended to show that prisons are “good” or “bad” at managing particular conditions, but rather to show the overall frequency of illness in prisons, and question the uniquely American policy of locking up so many infirm and high-need people. Instead of asking, “should cancer prevalence be higher or lower in prisons?” a better question is, “why should a 70-year-old with cancer and heart disease be locked up at all?”
While an incarcerated individual’s health issues may begin before arrest, incarceration often exacerbates problems or creates new ones. Being locked up in and of itself causes lasting damage to one’s health and to loved ones’ health, including children born to justice-involved parents. People in prison have a constitutional right to basic healthcare, but that care tends to be reactionary, designed to treat acute health care problems rather than to prevent or effectively treat chronic disease. When it comes to some of the major public health breakthroughs of recent history — like gold-standard substance use treatment — incarcerated people have largely been left behind.2


Slideshow 1.
Many basic health-related findings from the Survey have been reported by the Bureau of Justice Statistics, but here we offer further demographic breakdowns by gender, race and ethnicity, and age, wherever we find notable differences. In some cases, we find that people in state prisons have much higher rates of illness compared to the general public:
- More than 1 in 6 (17%), and the same percentage of older people (here, defined as people 55 and older3), reports being diagnosed with asthma, compared to just 8% of U.S. adults who currently have it. Asthma, like mass incarceration, is a burden that falls disproportionately upon particular communities; the highest rates in the Survey belong to Black (18%), Native4 (18%), and multiracial people (20%). And considering that asthma can be triggered by mold, dust mites, air pollution, and pests — all things found in poorly maintained, harmfully sited prisons — asthma is a serious problem for incarcerated people.5
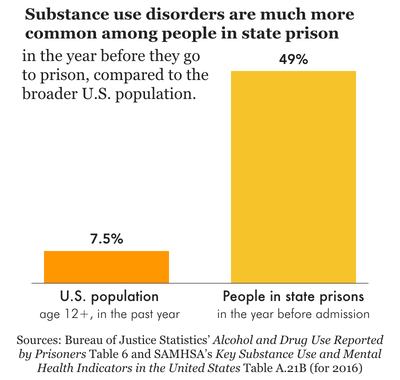
- Half (49%) of people in state prisons (but 59% of women) met the criteria for a substance use disorder in the 12 months before entering prison.6 This represents a decrease from 59% in the previous (2004) survey, but 49% is still an enormous proportion, compared to the 7.5% of U.S. adults that struggled with substance use disorder in 2016. Native people have the highest rates (62%) of substance use disorder, but white and multiracial people also have rates over 50% each. Prisons have an opportunity to provide high-quality, effective drug treatment to those who opt in, yet few actually do this. Instead, drugs and substance use disorder are incredibly common in prisons, and the likelihood of overdose death skyrockets upon release.7
- One in 10 (9.5%) people in state prison — including 16% of women and 21% of people over 55 — has been diagnosed with hepatitis C at some point, which is more than five times the estimated rate of U.S. adults with the viral infection.8 This is no coincidence: Hepatitis C risk is elevated among people who use drugs, and drug use is a common thread for people leading up to, and sometimes during, their prison sentence. Modern treatment for hepatitis C has a high cure rate, yet 80% of people in state prison who had ever been diagnosed with it still have it — reflecting the unwillingness of state prison systems to provide appropriate treatment, even at the expense of public health.

- Including those with hepatitis C, 17% of people in state prisons have contracted an infectious disease at some point, and like hepatitis C, rates tend to be higher as compared to the general U.S. population. About 1.2% of people report ever having hepatitis B, compared to less than 0.5% of the U.S. population who have a chronic case of the infection.9 And 1.1% have a history of HIV/AIDS, compared to less than 0.5% of people in the U.S. over age 13. Infectious diseases spread more easily throughout congregate settings like prisons and can then spread to other facilities and communities through staff and transfers; in this way, mass incarceration was a key contributor to the high COVID-19 caseloads in certain communities in 2020.
- While the prevalence of infectious disease has come down significantly since the last version of the Survey in 2004 (again, the most recent Survey was conducted pre-COVID), rates of many current medical problems reported by people in prison have increased.10

For some other medical conditions, rates are comparable between incarcerated and non-incarcerated people, as we discuss in the findings below. But this is not to say that these conditions are “not problems” in prisons. Because people in state prisons face challenges to their physical and mental health on a daily basis, they need at least the same level of care as they might on the outside, which we know is not their reality. Finally, rates of medical problems are always much higher for older people (again, here defined as those ages 55 and older), painting a bleak picture of what it’s like to age in prison:

Our analysis shows that, among people in state prisons:
- About 7% (and 23% of older people, ages 55+) have been diagnosed with heart disease at some point in their life. While heart disease is a leading cause of death both inside and outside of prison, the carceral environment makes it difficult for people inside to pursue a lifestyle and diet that staves off these problems.11 12

- About 29% (and 62% of older people) have been diagnosed with hypertension (high blood pressure), rates similar to those seen in the general population in 2016. However, literature on undiagnosed hypertension in the “noninstitutionalized” U.S. population (a regrettable example of carceral exclusion from public health research) shows that over 1 in 6 people with hypertension are unaware of their condition. This suggests that actual rates are far higher than diagnosed rates of hypertension, even among non-incarcerated populations.
- About 8% (and 23% of older people) have been diagnosed with diabetes, another common condition nationwide13 that prisons and other correctional facilities frequently fail to treat. Diabetes requires careful management of blood sugar levels, and several lawsuits show outright neglect of life-or-death situations when diabetic incarcerated people needed timely food, insulin, or medical equipment. Both diabetes and hypertension are known risk factors for heart disease and stroke.
- About 18% (and 45% of older people) have been diagnosed with arthritis or other rheumatic diseases like rheumatoid arthritis, gout, fibromyalgia, or lupus, which cause pain and inflammation, among other symptoms. Some of these are autoimmune diseases which can be brought on by exposure to stress; we know stressful situations like violence occur in prison regularly, but people in prison often experience trauma well before incarceration, such as parental incarceration and early contact with law enforcement.
- About one-fourth (26%) have a body mass index considered normal or underweight,14 as in the U.S. more broadly. Almost half (46%) are categorized as “overweight” and the remaining 28% are considered obese. This actually represents a slightly lower obesity rate than among all U.S. adults, but prison diets hardly promote public health: Incarcerated people are forced to eat what the public has been specifically “advised to avoid for decades,” but in insufficient quantities, forcing often unhealthy commissary purchases for those who can afford it. As a result, both weight gain and weight loss can happen in prison.
Access to healthcare: People who go to state prison disproportionately lack health insurance before incarceration ⤴
The number of health problems reported by incarcerated people may be partially explained by their difficulty accessing healthcare before incarceration: half (50%) of people in state prisons lacked health insurance at the time of their arrest. That’s a devastating rate of uninsured people compared to the overall population: Between 2008 and 2016, the highest rate of uninsured people in the U.S. was just 15.5%.15 Those in state prison with insurance before arrest generally received it from either an employer (39% of the insured) or through Medicaid (32%).16 This high level of participation in Medicaid, a program serving those who cannot afford healthcare premiums, tracks with our previous finding that people in prison are far poorer, on average, than their non-incarcerated peers.

For some people, then, prison actually improves access to healthcare: Over one-fourth (27%) of people in state and federal prisons who came to prison with a chronic condition were first diagnosed with it while incarcerated.17 This sounds like a victory in terms of prison healthcare, but it speaks more to the utter failure of the U.S. healthcare system to serve everyone, especially the most marginalized. Moreover, prison healthcare falls short of the constitutional duty to care for those in custody. While most (81%) people in state prison report having seen a healthcare provider at least once since admission, that leaves nearly 1 in 5 (19%) who have gone without a single health-related visit since entering prison.
And as a result of such inadequate healthcare, many people in prison end up worse off upon release, or dying prematurely, realities that aren’t covered in the Survey data. Cancer, for example, is more deadly in prison than on the outside,18 and people recently released from prison have a higher risk of hospitalization and death from heart disease than the average person. In the first two weeks after release from prison, individuals face a risk of death that is more than 12 times higher than for non-incarcerated individuals.
Rates of mental illness are exceptionally high among incarcerated people, but prisons fail to meet the demand for help⤴
The Survey data confirm that the long-standing mental health crisis in prisons is as serious as ever: Over half of people in state prisons reported some indication of a mental health problem. Women and Native people in prison are suffering from mental illness at even higher rates. The data reveal policy failures that begin in our communities: governments have chipped away at the social safety net and accessible community-based treatment for years, while spending on the carceral system has increased.19 As law enforcement and courts respond to mental illness like it’s a crime, prisons and jails fill up with people who have serious mental health needs — which these systems are not designed to accommodate. And the longer they are in prison, certain people are likely to develop worsening mental health symptoms,20 especially those who are sent to solitary confinement.


Slideshow 2.
The mental health crisis in prisons is only partially captured by the Survey, but the data reveal that:
- More than half (56%) of people in state prison had some indication of a mental health problem, whether recent (14% report serious psychological distress in the past month)21 or previously diagnosed (43% report any history of one or more mental health conditions). Yet only about one-fourth of the total population (26%) have received professional help for their mental health since entering prison. Less than 1 in 3 (30%) people experiencing serious psychological distress in the past 30 days reported currently receiving professional help.
- The prevalence of every single mental health condition is higher for women: Rates of post-traumatic stress disorder are almost three times as high in women as in men (34% of women versus 13% of men). Rates of manic depression, bipolar disorder, and/or mania (reported by 44% of women), as well as depressive disorders (49% of women) are double the rate compared to men.
- State prisons allow too many in their custody to remain in a constant state of distress: In the 30 days before the survey was administered, one-sixth (16%) of respondents felt “nervousness” all or most of the time; 12% felt hopeless all or most of the time; 11% said they felt depressed all or most of the time. Almost one-fourth (23%) felt like “everything was an effort.” Native incarcerated people report these concerning symptoms at the highest rates across the board.
- Mental health diagnoses in state prisons are most prevalent among multiracial people (56% report one or more), white people (53%), and Native people (52%), compared to Hispanic (36%), Black (33%), or Asian (32%) people. These figures track closely with how people of different racial and ethnic groups utilize mental health services outside of prison.
- A staggering half (50%) of people in state prisons who have a history of substance use disorder treatment also have a history of one or more mental health conditions. This is disproportionate overlap: According to the National Institute on Drug Abuse, 38% of U.S. adults with substance use disorder also had one or more mental health disorders.22
Some mental health diagnoses reported by people in prison may have been brought on by incarceration, which is itself a traumatizing experience. Other data tell us that well before that, when someone is arrested, the odds of them having serious mental illness or psychological distress are even greater, reflecting the practice of sweeping people experiencing mental health crises into the criminal legal system instead of redirecting them to community-based services. Despite how ill-suited these facilities are for providing these services, prisons and jails have become some of our nation’s largest de facto mental health care providers since the deinstitutionalization of public psychiatric hospitals beginning in the 1950s.23 State policy decisions, then, led directly to the profound overlap of mental illness and mass incarceration that we see today.24
Disabilities: Incarcerated people report disabilities at much higher rates than the broader U.S. population⤴

Similar to those who need treatment, people with disabilities are failed by the criminal legal system time and time again. After disproportionate contact with law enforcement, unaccommodating courts, and unequipped jails, almost half a million people with disabilities end up locked up in state prisons on a given day — accounting for 40% of state prison populations nationwide, and 50% of women’s state prison populations.
From vision-related (12%) to hearing (10%) and ambulatory (12%) disabilities, incarcerated people have much higher rates of disability compared to the general U.S. adult population, where an estimated 15% have any disability.25 Furthermore, a higher percentage of people in state prison in every age group report having a disability compared to the general population. Along racial and ethnic lines, multiracial and Native people in state prisons had higher rates of nearly every type of disability, followed by white people. Black, Hispanic, and Asian incarcerated people reported lower-than-average rates of disabilities.

Unsurprisingly, older people are the most likely to report a disability, with almost 6 in 10 (57%) of those age 55 to 64, and 7 in 10 (70%) of those 65 or older, reporting at least one disability. Between disability, other chronic conditions and excessive security costs, it’s twice as expensive to incarcerate someone age 50 or older compared to a younger, healthier person. Considering the nationwide aging of the state prison population — a record 13% are age 55 or older at this point — turning prisons into “makeshift nursing homes” is one of the nation’s most wasteful, morally bankrupt experiments to date.
Cognitive disabilities, those that lead to serious difficulty concentrating, remembering, or making decisions, impact about one-fourth (24%) of people in state prisons. Similarly, one-fourth (26%) have been told that they have attention deficit or hyperactivity disorder, compared to just 9.4% of children under 18, and about 4.4% of U.S. adults. And while 25% of people across state prisons have a history of taking special education classes, only half (54%) of all adult correctional facilities in the U.S. offered special education classes as of 2019 — another example of the wide gap between what incarcerated people need and what state prisons provide.26
People in prison who have disabilities are susceptible to bullying and worse: Deaf people, for example, may miss instructions or announcements for medication deliveries, and are sometimes placed in solitary confinement as a depraved substitute for providing hearing aids. In general, people with cognitive or other disabilities in prison are highly vulnerable to excessive use of force and abuse by both correctional staff and other incarcerated people.
Pregnancy and reproductive health: Expectant mothers are underserved in prison ⤴
While not a health “problem,” pregnancy presents specific medical needs for many people entering the criminal legal system, and prisons and jails are among the worst places to be during such a high-need time. Excluding transgender women, about 4% of people (or 3,500) in women’s prisons — disproportionately women of color27 — report that they were pregnant at admission, and therefore had to navigate the challenges and impacts of carceral pregnancy.
In the 1991 equivalent of the Survey, a slightly higher percentage (6%) of women in state prisons reported being pregnant upon their admission, but the number of women in state prisons more than doubled by 2016,28 expanding the total scale of prison pregnancy. Most women who were pregnant at admission (68%) did not have health insurance at the time of their arrest, setting them up for possible undiscovered complications. Further, most of these women also spent time in jail before admission; one-fourth (26%) spent 6 months or more facing horrendous conditions in local jails before being transferred to prison.

Troublingly, 1 in 10 women (9%) who were pregnant at admission had not had an obstetric exam, an important check of both maternal and fetal well-being, and only half (50%) had received prenatal care in the form of special testing, dietary changes, or childcare instruction. As we found previously, pregnancy nutrition standards, in particular, are largely missing from most state department of corrections policies.
In a previous study, we found that state prisons lack many other formal policies that would ensure the health and safety of both the parent-to-be and their child. Besides meager progress in addressing the inhumane practice of shackling pregnant people, many states fail to screen for high-risk pregnancies, or to make hospital arrangements for delivery, forcing some to give birth in the horrid confines of their cell. Thanks to researchers focused on reproductive justice in correctional settings, we now have an idea of how this systematic neglect of pregnant people plays out: In some state prison systems, miscarriages, premature births, and C-section births are much higher than national rates.29 Meanwhile, some of the same states make breastfeeding (or lactation) difficult or impossible, and keep opioid use disorder treatment out of reach for expecting or new parents, showing a clear disregard for their lives.
How do we begin to address the unmet needs of people in state prisons?⤴
To be clear, findings from the 2016 Survey of Prison Inmates only confirm what research has shown for years: that incarcerated people face enormous obstacles to achieving and maintaining good health. The ongoing lack of care and compassion (as well as years of deeply problematic, non-consensual medical experimentation) behind bars has led to a deep sense of distrust in correctional healthcare to keep people in good health, or even to “do no harm.”
And while it’s easy to blame “the prison system” or private healthcare companies for these dangerous conditions, each of these trying aspects of prison life is the result of state policy: harsh policy that was implemented and remains unchanged, or — in the case of more humane standards — policy that exists on paper, but is often not enforced at the facility level.30 As we’ve asserted time and time again, state policy drives mass incarceration and defines day-to-day life for most people directly impacted by incarceration, including over 1 million people in state prisons, over half a million more in local jails, their children, and countless other loved ones.
State lawmakers must be aware of forces before incarceration that may lead to poor or declining health: Namely, the concentration of poverty, trauma, and disadvantage among people before they enter state prison, including the clear gap in health insurance coverage for those who can’t afford market-rate premiums or obtain a job offering health benefits. State policy must also reflect the reality that releasing someone from prison with no plan for continuing their healthcare regimen is a public health failure, considering the disproportionate nature of illness and disability behind bars. As organizations like Community Oriented Correctional Health Services have been saying for years, there must be coordination between correctional facilities and community providers to minimize disruptions in treatment and insurance coverage.
For those currently behind bars, there are myriad ways to begin addressing the egregious conditions of state prison confinement. Below, we offer further exploration of the topics discussed in this report and a non-exhaustive list of policy solutions:
Improve access to health services inside prisons and upon release:
- Eliminate fees for medical care (often misleadingly called “co-pays” in policy),31 which would reduce financial barriers to needed health visits and limit the spread of disease;
- Hold private healthcare contractors accountable for cost-avoiding, negligent practices that leave incarcerated people without necessary care;
- Ensure that medical and mental health providers — whether they are state-managed or privately run — take a trauma-informed approach to care, which can be achieved through policy review, training, or hiring trained staff;
- Counteract the federal “exclusion” policy of terminating Medicaid upon incarceration by expanding Medicaid coverage, which results in suspension instead; assist individuals in custody in pre-enrolling months before release to ensure coverage immediately upon returning to their community; and
- Require prisons to coordinate follow-up appointments and ensure that people leave custody with several weeks’ worth of prescription medication.
Acknowledge specific areas of health need and types of chronic disease:
- Improve reproductive care in prisons: Offer pregnancy testing, comprehensive prenatal care, and offer voluntary, cost-free reversible contraception and abortion services;
- Require testing and modern treatment for conditions like hepatitis B, hepatitis C, heart disease risk factors, and traumatic brain injury;32
- Ensure that people who were on treatment regimens pre-incarceration do not experience disruption in (or denial of) treatment, which greatly increases the chance of relapse and/or overdose death;
- Accommodate all people with disabilities with appropriate equipment and modifications in built environment, communications, daily routines, and programming; and
- When people with mental health issues, substance use disorders, and co-occurring disorders cannot be released right away, increase the availability of counselors and clinicians.
Ensure that prisons are habitable spaces:
- Improve failing (or nonexistent) infrastructure in prisons that makes people sicker, like undrinkable water and lack of air conditioning;
- Overhaul prison food such that it provides nourishing and filling meals, which will decrease physical and mental health problems and reduce reliance on expensive commissary items;
- Require emergency response plans for state prisons to respond to various situations, including outbreaks of infectious diseases;
- Immediately reduce, and eventually eliminate, the use of solitary confinement, euphemistically known in some states as “restrictive housing” or “segregation,” which can cause permanent psychological damage and increase risk of premature death after release; and
- Create robust, external oversight mechanisms for conditions of confinement, such as an ombudsperson’s office.
Move older and ailing people out of prisons permanently:
- Expand and accelerate medical parole (also known as compassionate release), allowing very ill people to receive care at home among loved ones; and
- Expand and accelerate parole eligibility for those who are above a certain age, otherwise known as geriatric parole, and ensure that no parole processes are subject to “carveouts” (such as excluding those incarcerated for violent or sexual offenses).
Of course, many people in state prisons should not be behind bars at all, much less for the excessively long sentences they are often serving. The above reforms should go hand-in-hand with meaningful decarceration efforts guided by state policy: greasing the wheels of discretionary and presumptive parole, expanding earned good time, retroactive sentencing reform, and others.
And finally, while this should be obvious, addressing bad policy and creating better prison policies must not come at the expense of non-carceral, community-based solutions. States must curtail their reliance on police, jails, courts, and prisons as solutions to social and public health problems.
Methodology ⤴
The Bureau of Justice Statistics’ 2016 Survey of Prison Inmates was conducted through in-person interviews of people in state and federal prisons, and provides self-reported data on a wide range of characteristics and subjects. The target survey population included people ages 18 and older who were currently in the custody of a state or federal prison, whether or not they were sentenced to a period of incarceration. A total of 28,848 people participated in the survey (20,064 from 306 state prisons and 4,784 from 58 federal prisons). For more information, see the Bureau of Justice Statistics’ Methodology: Survey of Prison Inmates, 2016.
The state and federal survey data were made available, in separate files, to researchers in late December 2020. We elected to focus on the state prison data only, since it’s primarily state policy that drives mass incarceration. Additionally, the state and federal prison populations differ in substantial ways that make it worthwhile to look at them separately. For more information about how state, federal, and local systems of confinement differ, see our report Mass Incarceration: The Whole Pie.
Using the programming language R and the survey’s weighted data, we generated crosstabs of all variables of interest, recoding where necessary to derive meaning (for example, we created age categories rather than comparing people of specific ages). As a survey rather than an administrative dataset, the Survey of Prison Inmates provides data self-reported from incarcerated people in addition to some administrative data. We opted to use self-reported data whenever possible. Specifically:
- We almost always analyzed data using self-reported gender identity, rather than the binary sex variable derived from administrative records, to more accurately account for people who identify as transgender or something else. The administrative sex variable categorizes everyone in a “women’s” prison as female and everyone in a “men’s” prison as male, regardless of their self-reported gender identity; this is the variable the Bureau of Justice Statistics (BJS) uses in its own reports on Survey data. Where we performed our own data analysis, we used self-reported gender identity. One exception to this relates to pregnancy: the Survey only asked cisgender women in women’s prisons about pregnancy status. Because of the small number of survey respondents identifying as transgender, the difference between administrative sex and self-reported gender is usually negligible. The appendix tables of this report contain our original analysis and therefore refer to self-identified gender unless otherwise noted. Throughout the report itself, we sometimes reference findings first published by BJS (this is noted in the source information in the graphics that use these findings), which reflect the administrative sex variable.
- We analyzed race data using one combined race/ethnicity variable from the survey that categorizes anyone identifying as Hispanic separately from other racial identities, although we recognize that many people identify as both Hispanic and another race, such as white, Black, or American Indian or Alaska Native. This methodology is consistent with how the Bureau of Justice Statistics reports racial and ethnic data.
Finally, we encourage other researchers to explore this rich and unique dataset. There is much more potential for analysis of these data, beyond what we and the Bureau of Justice Statistics have published.
Acknowledgements
The author wishes to thank Alexi Jones for her significant contributions to the early data analysis for this report, and to Prison Policy Initiative colleagues Wendy Sawyer, Tiana Herring, and Emily Widra for their research and editorial assistance. The Prison Policy Initiative also thanks Public Welfare Foundation for supporting our analysis of the Survey of Prison Inmates, as well as our broader work strengthening the justice movement by filling key data and messaging gaps. Lastly, we thank our individual donors, who give us the resources and the flexibility to quickly turn our insights into new movement resources.
About the author
Leah Wang is a Research Analyst at the Prison Policy Initiative. She is co-author of the Prison Policy Initiative’s recent report Beyond the Count: A deep dive into state prison populations, which also uses the Bureau of Justice Statistics’ Survey of Prison Inmates to show the social disadvantage of people locked up in state prisons. Her other recent work includes reports on diversion programs, how incarceration affects people’s experiences in the job market, and the importance of family contact for incarcerated people.
About the Prison Policy Initiative
The non-profit, non-partisan Prison Policy Initiative was founded in 2001 to expose the broader harm of mass criminalization and spark advocacy campaigns to create a more just society. The organization is known for its visual breakdown of mass incarceration in the U.S., as well as for its campaigns against prison gerrymandering and the predatory prison and jail telephone industry. The organization sounded the alarm in 2020 on the danger of COVID-19 outbreaks in prisons and jails, and throughout the pandemic has provided frequent updates on releases, vaccines, and other prison policies critical to saving lives behind bars.
Footnotes
These different aspects of health are also interrelated, as health researchers have shown. Rezzano et al. (2015) found that “Compared to the general U.S. population, people with serious mental health conditions experience higher prevalence of many chronic medical conditions,” including hypertension, asthma, arthritis, and diabetes. And the Centers for Disease Control and Prevention reports that adults with disabilities are more likely to smoke and to have depression, obesity, diabetes, high blood pressure, and heart disease. ↩
For example, medication-assisted treatment, or MAT, is widely accepted as the best approach to treatment of opioid use disorder. Yet correctional facilities are either slow to adopt MAT, or they prohibit the appropriate medications altogether, fueling the opioid crisis by increasing the odds of withdrawal (for those who were in treatment before incarceration), relapse, and recidivism. Another example is prisons’ failure to make a dent in the prevalence of hepatitis C, as we detail in the sidebar “Hepatitis C in state prisons is a failure of state policy” in this report. ↩
While people who are 55 are not widely considered “elders” outside of prisons, this is not an exaggeration in the prison context: incarceration is known to accelerate biological aging and shorten life expectancy. Advocates, lawmakers, and the Bureau of Justice Statistics itself have used 55 and older as a standard “elder” group. ↩
Throughout this report, we use the term “Native” to refer to people who self-identified in the Survey as American Indian or Alaska Natives. ↩
Researchers have also found that incarceration contributes to persistent racial disparities in the prevalence of asthma, in an overwhelming cycle of racialized disadvantage and punishment. ↩
The Bureau of Justice Statistics defined substance use disorder based on the Diagnostic and Statistical Manual of Mental Disorders, Fourth Edition (DSM-IV) for either dependence or abuse of drugs or alcohol. Only people who were not incarcerated during the 12 months prior to their current state prison incarceration were asked about their drug and alcohol use; this was approximately 811,000 people, or about two-thirds of the state prison population. ↩
For example, prisons underutilize gold standard treatment for substance use disorder like medication-assisted treatment, and fail to coordinate care post-release, increasing the odds of relapse and overdose. ↩
An estimated 4.1 million people in the U.S., or about 1.7% of the population, are currently infected with, or have antibodies for, hepatitis C, based on data from 2013 to 2016. It should be noted that the measure for hepatitis C in the Survey was whether the respondent had ever been told by a healthcare professional that they had the virus, while the national estimate is based on blood tests of a representative sample of the population. ↩
Unfortunately, these two figures are not directly comparable, as we could not find the number of people in the U.S. who have ever been diagnosed with hepatitis B. For some people, hepatitis B is a short-term infection, while for others, it’s a chronic condition. We could only find the number of people in the U.S. with a chronic case of hepatitis B. ↩
In Bureau of Justice Statistics’ 2008 report Medical Problems of Prisoners, which reported results from the 2004 Survey of Inmates in State and Federal Correctional Facilities (later renamed Survey of Prison Inmates), Table 2 shows rates of current problems (at the time of the survey) with arthritis, asthma, cancer, diabetes, and hypertension that are lower than the reported rates in 2016’s Survey. ↩
We would have liked to compare rates of heart disease to the general U.S. population, but “heart disease” refers to several different conditions that affect the heart, and therefore it’s difficult to create an apples-to-apples comparison. The Survey of Prison Inmates questionnaire asked if respondents had ever been told by a doctor, nurse, or other health care provider that they had “heart disease, including a heart attack, coronary heart disease, angina, congestive heart failure or other heart problems,” for which, to our knowledge, there is no parallel measure for the total U.S. population. Setting aside these definitional differences, heart disease is the cause of 1 of every 4 deaths in the U.S., and is just as deadly (27%) in state prisons. ↩
As correctional health researcher and professor Meghan Novisky discusses in Avoiding the Runaround: The Link Between Cultural Health Capital and Health Management Among Older Prisoners (2018), people in prison are denied agency in choosing their healthcare providers (and, for that matter, their diets, treatment plans, and means of monitoring their own health), so they must resort to researching their own medical conditions and treatments, making very deliberate choices and modifications of the prison food offered, and dogged self-advocacy as health promotion strategies. Novisky’s study focuses on older men in prison, who typically have greater health needs, but the same challenges apply to everyone in prison with medical concerns. ↩
About 1 in 10 Americans has diabetes, according to the Centers for Disease Control and Prevention. ↩
This figure was provided and calculated by the Bureau of Justice Statistics (see Table 5), and was not available as separate “normal” and “underweight” populations. ↩
We offer this multi-year comparison given that people are admitted to prison over many different years. Moreover, most people surveyed would have been admitted between 2008 and 2016: According to the Bureau of Justice Statistics’ analysis of the Survey data in its report Profile of Prison Inmates, 2016, the average time served since admission was 6.3 years for people in state prisons, and 62.1% had served 5 years or less. ↩
The 32% of insured people in state prison formerly on Medicaid equates to about 19% of the total state prison population. ↩
According to a previous Bureau of Justice Statistics study of chronic conditions among people in prisons and jails, 27% of people in both state and federal prisons (and 8% of people in local jails) did not report a chronic condition upon their admission, but were told they had a chronic condition since admission. ↩
In this study, researchers found that Medicare recipients who were recently released from correctional facilities had higher cancer-related hospitalization rates, along with an increased risk of cancer-related mortality, compared with the general population. ↩
For some helpful data showing government spending in these sectors, see the column by Christopher Ingraham, U.S. spends twice as much on law and order as it does on cash welfare, data show. As Ingraham makes clear, this unequal spending is not normal: for years, federal, state and local government spending clocked in around 1% of total national income each for welfare and law and order (police, prisons and courts). Since then, welfare spending has been riding a “long, uneven” decline to about 0.8%, while law and order spending has “ballooned” to about 2% of national income, in 2020. ↩
This 2021 study found that Black men and women who had served more time in prison exhibited more mental health symptoms than those who had served less time, while the opposite was true for white men. Incidentally, this study used data from the previous version of the Survey in 2004. ↩
The Bureau of Justice Statistics (BJS) determined serious psychological distress based on the Kessler 6 nonspecific psychological distress scale, a scoring tool that considered answers to questions about how often someone felt nervous, hopeless, restless or other emotions. For more information, see page 3 of the BJS report. ↩
While the data do not tell us if substance use disorder treatment and mental illness occurred at the same time, we know that when they do converge (known as co-occurring disorders), an individual needs a high level of care for both, preferably at the same time. Still, prisons and jails largely fail to screen and treat for co-occurring disorders, leaving many people at higher risk of experiencing other medical problems, noncompliance with treatment, difficulty in social relationships, and recidivism, among other negative outcomes. ↩
According to the Treatment Advocacy Center, in 44 states, a jail or prison holds more mentally ill individuals than the largest remaining state psychiatric hospital. ↩
This is not to say that deinstitutionalization is the sole reason for the high prevalence of people with mental illness in prisons; rather, no public institution exists at the same scale as prisons and jails that are required to care for people with diagnosed mental illnesses. Policies more closely linked to the advent of mass incarceration, like the war on drugs, “quality-of-life” or “broken windows policing,” allowing corrections departments to manage civil commitments, long sentences, and the use of solitary confinement have also contributed to the use of prisons and jails as warehouses for people with mental illness. ↩
This figure is offered by BJS in its briefing on disability among people in state prison, based on the 2016 Survey of Prison Inmates data. It comes from the Census Bureau’s American Community Survey, 2016. ↩
This figure is offered by the Bureau of Justice Statistics in its Census of State and Federal Adult Correctional Facilities, 2019 report, and is not disaggregated by federal and state prisons. ↩
According to the Survey data, white women are underrepresented among women who are pregnant when admitted to prison: 47% of women in state prisons are white, 19% are Black, 16% are Hispanic, and 14% are multiracial; meanwhile, only 42% of pregnant women in state prison are white, 20% are Black, 17% are Hispanic, and 19% are multiracial. ↩
According to the Bureau of Justice Statistics, there were about 39,425 sentenced people in women’s state prisons in 1991; in 2016, there were 94,447 sentenced people in women’s state prisons. ↩
The government, shamefully, collects no comprehensive data on how pregnant people fare throughout incarceration in state prisons or local jails (some data are now collected at the federal level). Researchers have attempted to fill that gap: the Pregnancy in Prison Statistics Project (PIPS), led by Dr. Carolyn Sufrin, conducted the first-ever nationwide survey collecting pregnancy outcome, prenatal care, and reproductive autonomy data from prisons and jails. ↩
When it comes to meaningful criminal justice reforms, enforcement and oversight may fall through the cracks when corrections departments, for example, are charged with overseeing themselves. In Massachusetts, the landmark Criminal Justice Reform Act, passed in 2018, made (hypothetical) strides in reducing the use of solitary confinement, in data collection, and in policing standards; yet state lawmakers have observed minimal or no action in these areas, despite the Act’s mandates. ↩
Unlike non-incarcerated people, people in prison do not have a choice about their medical coverage, nor how “cost sharing” applies to them. There is no “insurance” system that covers them, so the term “co-pay” is a misnomer for the fee they are charged to request a medical appointment or to obtain a prescription. As the organization Voice of the Experienced argues, the use of this term legitimizes these unaffordable fees, which deter people from seeking needed medical care. They suggest more descriptive terms such as “medical request fees” or “sick call fees.” ↩
In a 2011 survey of prison healthcare, the CDC found major testing gaps for these important conditions. ↩
Appendices ⤴
Ever diagnosed with a chronic condition — by gender and race/ethnicity
| Gender identity | Race/ethnicity (self-reported) | |||||||||||
|---|---|---|---|---|---|---|---|---|---|---|---|---|
| Total state prison population | Male | Female | White (Not Hispanic) | Black (Not Hispanic) | Hispanic | American Indian/Native Alaskan (Not Hispanic) | Asian/Native Hawaiian/other Pacific Islander (Not Hispanic) | Two or more races (Not Hispanic) | Other (Not Hispanic) | |||
| Cancer | 3.6%* | 3.1% | 9.7% | 5.8% | 1.9% | 2.5% | 4.1% | 0.2% | 4.6% | 14.4% | ||
| Hypertension | 29.2%* | 29.5% | 25.9% | 28.0% | 33.3% | 23.2% | 32.3% | 21.4% | 32.5% | 40.3% | ||
| Stroke | 2.8%* | 2.8% | 3.1% | 3.4% | 2.2% | 2.4% | 4.0% | 0.6% | 4.1% | 0% | ||
| Diabetes | 7.9%* | 7.8% | 8.8% | 7.5% | 7.8% | 8.1% | 11.1% | 3.5% | 9.0% | 18.8% | ||
| Heart disease | 7.2%* | 7.3% | 6.9% | 9.3% | 5.7% | 5.5% | 10.5% | 3.1% | 9.3% | 0% | ||
| Kidney problems | 5.2%* | 5.0% | 8.0% | 6.1% | 4.0% | 4.8% | 5.8% | 2.2% | 7.4% | 0% | ||
| Arthritis, gout, lupus, or fibromyalgia | 17.6%* | 17.0% | 25.8% | 22.8% | 13.6% | 12.6% | 21.5% | 6.7% | 25.0% | 14.4% | ||
| Asthma | 16.7%* | 16.1% | 23.5% | 14.4% | 17.8% | 15.5% | 17.9% | 10.3% | 21.4% | 52.4% | ||
| Cirrhosis (liver disease) | 1.8%* | 1.8% | 2.2% | 2.4% | 1.1% | 2.1% | 2.1% | 0.5% | 1.7% | 0% | ||
Ever diagnosed with a chronic condition — by age group
| Age at time of survey | ||||||
|---|---|---|---|---|---|---|
| 18-24 | 25-34 | 35-44 | 45-54 | 55-64 | 65 or older | |
| Cancer | 0.8% | 1.7% | 2.5% | 3.9% | 10.2% | 19.1% |
| Hypertension | 9.7% | 16.5% | 27.8% | 41.5% | 59.3% | 71.9% |
| Stroke | 0.3% | 0.9% | 2.3% | 3.9% | 8.8% | 11.5% |
| Diabetes | 0.9% | 2.5% | 6.6% | 12.8% | 20.3% | 30.8% |
| Heart disease | 3.1% | 3.3% | 4.9% | 9.3% | 19.2% | 33.0% |
| Kidney problems | 3.0% | 3.3% | 4.7% | 5.8% | 11.2% | 15.2% |
| Arthritis, gout, lupus, or fibromyalgia | 4.1% | 6.8% | 15.8% | 27.4% | 42.8% | 53.2% |
| Asthma | 20.5% | 17.5% | 15.5% | 14.4% | 17.2% | 17.4% |
| Cirrhosis (liver disease) | 0.5% | 0.6% | 1.2% | 3.1% | 5.6% | 4.1% |
Ever diagnosed with an infectious disease — by gender and race/ethnicity
| Gender identity | Race/ethnicity (self-reported) | |||||||||||
|---|---|---|---|---|---|---|---|---|---|---|---|---|
| Total state prison population | Male | Female | White (Not Hispanic) | Black (Not Hispanic) | Hispanic | American Indian/Native Alaskan (Not Hispanic) | Asian/Native Hawaiian/other Pacific Islander (Not Hispanic) | Two or more races (Not Hispanic) | Other (Not Hispanic) | |||
| Tuberculosis | 3.8%* | 3.9% | 1.4% | 2.6% | 4.3% | 4.4% | 4.9% | 13.3% | 3.3% | 0% | ||
| Hepatitis B | 1.2%* | 1.2% | 1.2% | 1.6% | 1.1% | 0.9% | 0.8% | 4.0% | 1.2% | 0% | ||
| Hepatitis C | 9.5%* | 9.0% | 15.5% | 15.0% | 4.0% | 9.6% | 10.4% | 2.4% | 11.4% | 0% | ||
| HIV | 1.1%* | 1.1% | 1.4% | 1.1% | 1.2% | 0.7% | 0.4% | 1.0% | 1.7% | 0% | ||
| Sexually transmitted disease | 4.4%* | 4.2% | 5.9% | 3.6% | 5.1% | 3.5% | 4.3% | 3.4% | 6.1% | 0% | ||
Ever diagnosed with an infectious disease — by age group
| Age at time of survey | ||||||
|---|---|---|---|---|---|---|
| 18-24 | 25-34 | 35-44 | 45-54 | 55-64 | 65 or older | |
| Tuberculosis | 1.5% | 2.0% | 3.6% | 6.2% | 7.1% | 6.5% |
| Hepatitis B | 0.1% | 0.3% | 1.1% | 2.1% | 3.4% | 3.4% |
| Hepatitis C | 3.1% | 6.6% | 7.8% | 13.1% | 22.2% | 15.3% |
| HIV | 0.3% | 0.7% | 1.1% | 1.8% | 2.0% | 1.4% |
| Sexually transmitted disease | 5.4% | 4.1% | 4.1% | 4.7% | 4.9% | 2.6% |
Ever diagnosed with a mental health problem — by gender and race/ethnicity
| Gender identity | Race/ethnicity (self-reported) | |||||||||||
|---|---|---|---|---|---|---|---|---|---|---|---|---|
| Total state prison population | Male | Female | White (Not Hispanic) | Black (Not Hispanic) | Hispanic | American Indian/Native Alaskan (Not Hispanic) | Asian/Native Hawaiian/other Pacific Islander (Not Hispanic) | Two or more races (Not Hispanic) | Other (Not Hispanic) | |||
| Manic depression, bipolar disorder or mania | 23.3%* | 21.7% | 43.9% | 28.4% | 18.4% | 18.6% | 23.2% | 17.5% | 30.7% | 49.8% | ||
| Depressive disorder | 27.1%* | 25.3% | 49.3% | 33.7% | 19.9% | 22.8% | 30.2% | 19.6% | 35.7% | 49.8% | ||
| Schizophrenia or other psychotic disorder | 8.8%* | 8.5% | 34.2% | 7.5% | 9.3% | 7.3% | 10.7% | 6.0% | 12.1% | 25.0% | ||
| Post-traumatic stress disorder | 14.1%* | 12.5% | 34.2% | 17.5% | 9.3% | 11.8% | 21.6% | 8.9% | 21.6% | 23.0% | ||
| Anxiety | 22.2%* | 20.2% | 47.3% | 30.3% | 13.0% | 19.8% | 31.6% | 16.0% | 29.2% | 33.3% | ||
| Personality disorder | 11.4%* | 10.8% | 18.1% | 12.8% | 9.9% | 8.6% | 14.4% | 4.2% | 16.5% | 25.0% | ||
| Other mental or emotional condition | 2.3%* | 2.3% | 2.6% | 2.5% | 1.7% | 1.9% | 3.4% | 0.5% | 4.0% | 0% | ||
Ever diagnosed with a mental health problem — female, by race/ethnicity
| Race/ethnicity (self-reported) | |||||||
|---|---|---|---|---|---|---|---|
| White (Not Hispanic) | Black (Not Hispanic) | Hispanic | American Indian/Native Alaskan (Not Hispanic) | Asian/Native Hawaiian/other Pacific Islander (Not Hispanic) | Two or more races (Not Hispanic) | Other (Not Hispanic) | |
| Any | 71.1% | 55.7% | 62.6% | 67.1% | 55.2% | 74.6% | n/a |
| Manic depression, bipolar disorder or mania | 44.9% | 38.8% | 41.1% | 45.1% | 28.0% | 50.8% | n/a |
| Depressive disorder | 52.0% | 40.0% | 45.4% | 48.9% | 36.6% | 56.7% | n/a |
| Schizophrenia or other psychotic disorder | 8.6% | 15.6% | 10.4% | 14.6% | 5.0% | 11.0% | n/a |
| Post-traumatic stress disorder | 37.1% | 21.7% | 31.6% | 49.9% | 15.7% | 44.1% | n/a |
| Anxiety | 52.8% | 30.1% | 47.1% | 55.5% | 24.8% | 52.3% | n/a |
| Personality disorder | 18.4% | 16.9% | 15.3% | 19.9% | 1.0% | 21.7% | n/a |
| Other mental or emotional condition | 2.3% | 1.7% | 2.2% | 3.0% | 0% | 4.9% | n/a |
Ever diagnosed with a mental health problem — male, by race/ethnicity
| Race/ethnicity (self-reported) | |||||||
|---|---|---|---|---|---|---|---|
| White (Not Hispanic) | Black (Not Hispanic) | Hispanic | American Indian/Native Alaskan (Not Hispanic) | Asian/Native Hawaiian/other Pacific Islander (Not Hispanic) | Two or more races (Not Hispanic) | Other (Not Hispanic) | |
| Any | 47.6% | 30.8% | 32.6% | 48.5% | 29.8% | 51.4% | 56.8% |
| Manic depression, bipolar disorder or mania | 26.5% | 17.6% | 17.2% | 21.1% | 16.6% | 28.8% | 56.8% |
| Depressive disorder | 31.7% | 19.2% | 21.5% | 28.3% | 18.8% | 33.9% | 56.8% |
| Schizophrenia or other psychotic disorder | 7.4% | 9.1% | 7.1% | 10.3% | 6.1% | 12.1% | 28.5% |
| Post-traumatic stress disorder | 15.3% | 8.8% | 10.7% | 19.0% | 8.6% | 19.4% | 26.2% |
| Anxiety | 27.7% | 12.4% | 18.3% | 29.3% | 15.6% | 27.1% | 38.0% |
| Personality disorder | 12.2% | 9.6% | 8.3% | 13.9% | 4.5% | 16.1% | 28.5% |
| Other mental or emotional condition | 2.6% | 1.7% | 1.9% | 3.5% | 0.5% | 3.8% | 0% |
Pregnant at admission^
| Race/ethnicity (self-reported) | |||||||||
|---|---|---|---|---|---|---|---|---|---|
| Total female state prison population | White (Not Hispanic) | Black (Not Hispanic) | Hispanic | American Indian/Native Alaskan (Not Hispanic) | Asian/Native Hawaiian/other Pacific Islander (Not Hispanic) | Two or more races (Not Hispanic) | Other (Not Hispanic) | ||
| Pregnant at admission (as a percent of all respondents in race/ethnicity category) | 3.7%* | 3.3% | 3.9% | 4.2% | 2.7% | 1.5% | 5.0% | n/a | |
| Among those pregnant at admission: | |||||||||
| Has seen an outside provider | 73.9% | ||||||||
| Had health insurance upon arrest | 31.8% | ||||||||
| Has had an obstetric exam | 91.4%* | ||||||||
| Has received other prenatal care in the form of special diet, medication, or special testing | 49.7%* | ||||||||
Recommended Reading:
Tracking Trump's criminal legal system moves
The Administration is making America's criminal legal system harsher, less effective, and even more unjust.

Research Library
We curate a searchable database of 4,000+ original research reports, organizing each entry by topic and adding brief summaries.

Mass Incarceration: The Whole Pie
The U.S. incarcerates nearly 2 million people. Where are they locked up and why? Read our report.

Bad Behavior
This national report explains how prison disciplinary policies manufacture misconduct and severly punish incarcerated people.