The criminal justice system is riddled with racial disparities
These 5 graphs break down just how riddled the U.S. criminal justice system is with racial disparities.
by Alison Walsh, August 15, 2016
Race is a defining characteristic of the criminal justice system.
It is common knowledge that Blacks are disproportionately represented in prison. Looking at different types of incarceration sentences shows us how pervasive these disparities really are. This slideshow scrolls through the various incarceration sentences one may receive compared to the U.S. population, broken down by race.
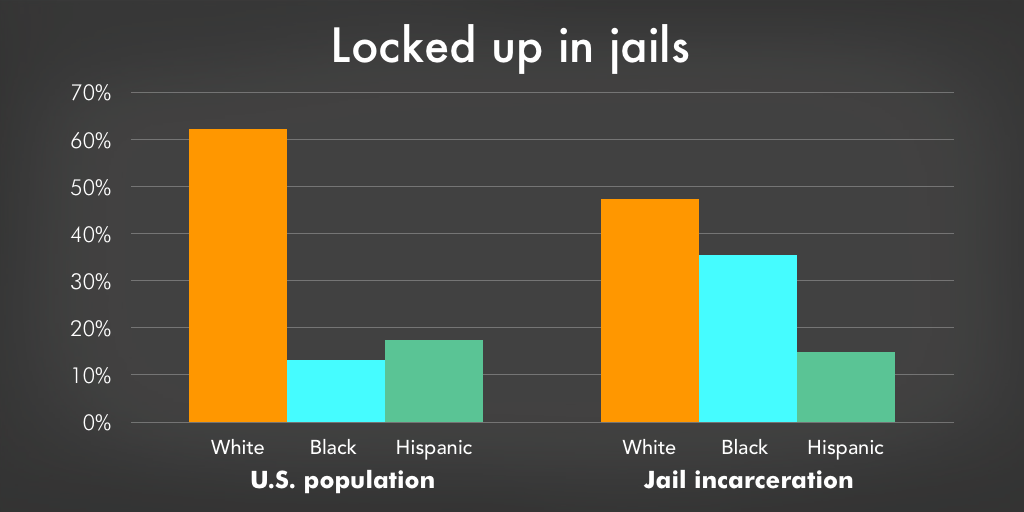
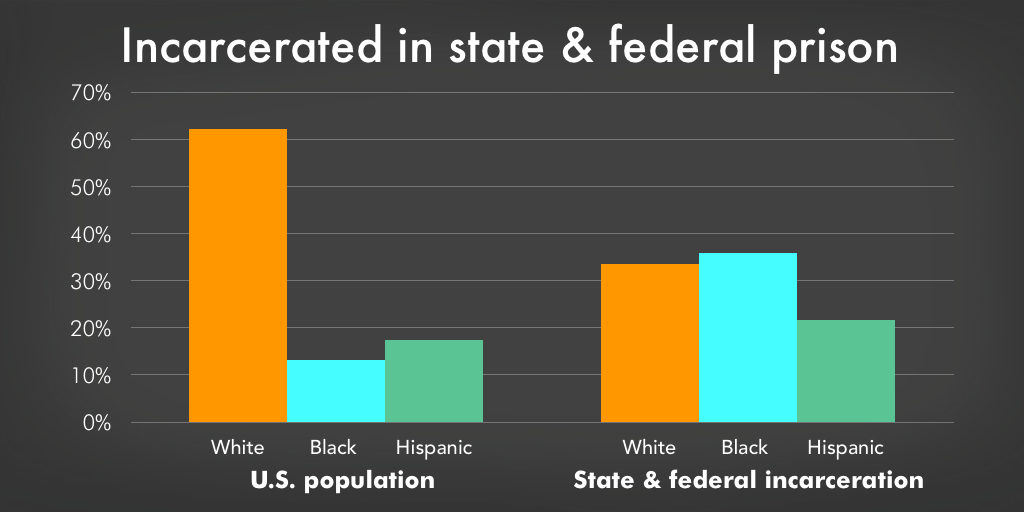
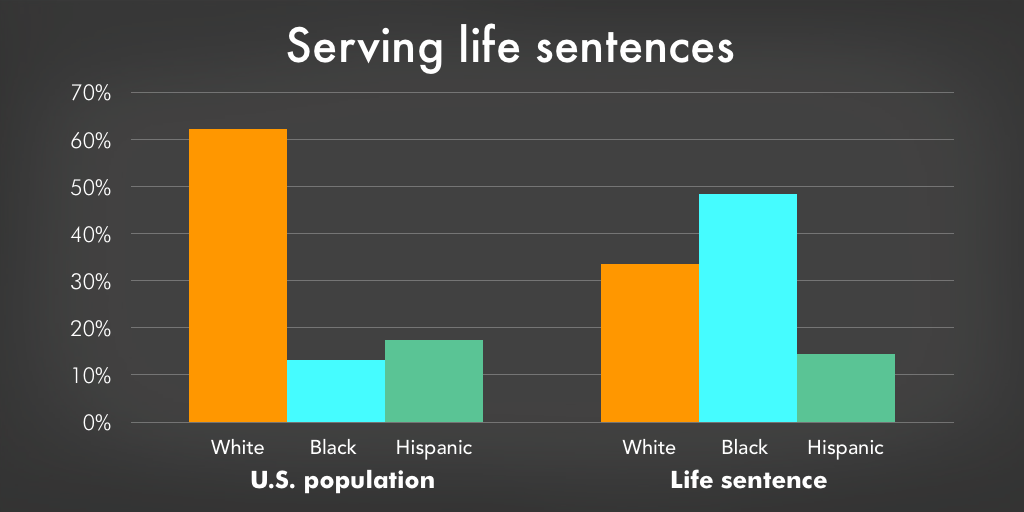
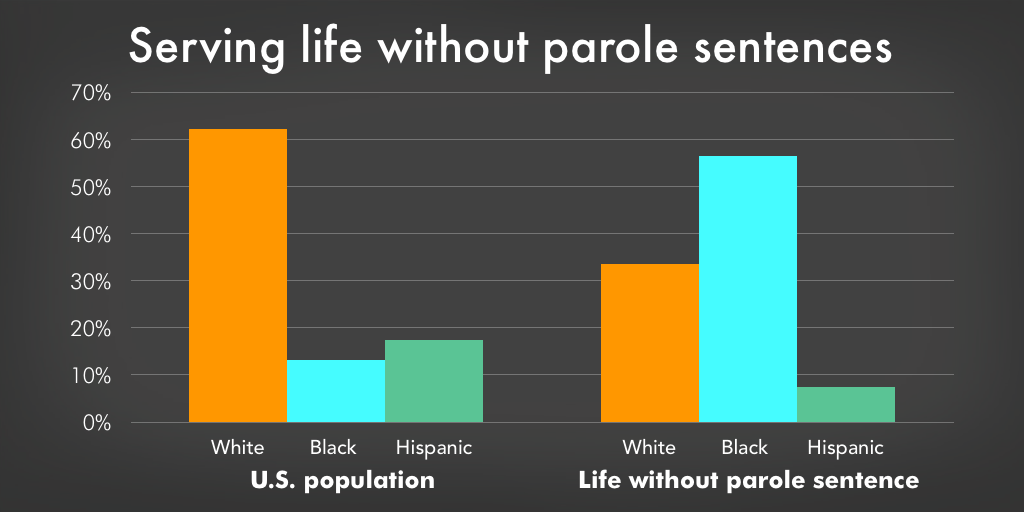
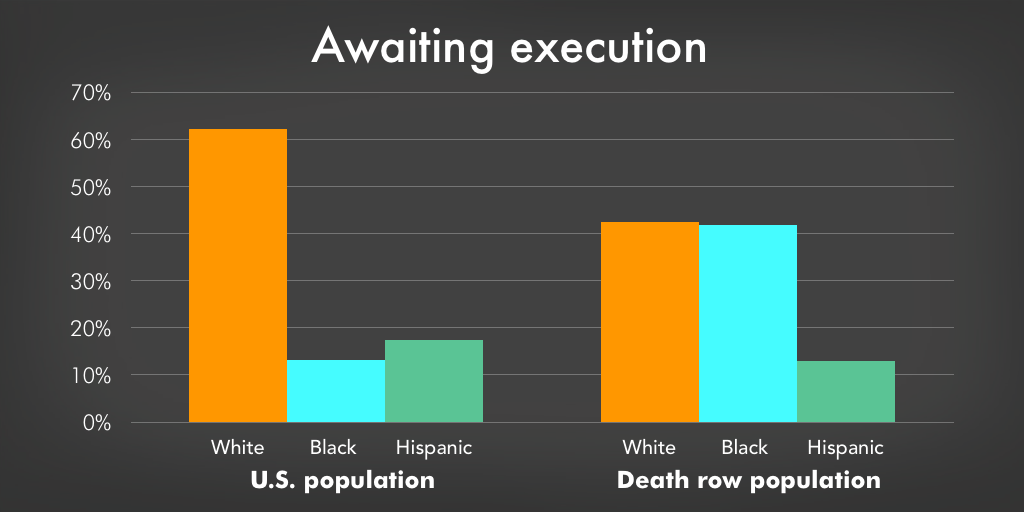
Once a person is sentenced to jail, we see that Blacks are overrepresented and Whites are underrepresented, compared to the U.S. population as a whole. This disparity endures in state and federal prison sentences, life sentences, life without parole sentences, and in the death row population.
Data sources:
- U.S. Census Bureau, QuickFacts (Using July 1, 2014 estimates)
- Bureau of Justice Statistics, Jail Inmates at Midyear 2014
- Bureau of Justice Statistics, Prisoners in 2014
- The Sentencing Project, No Exit: The Expanding Use of Life Sentences in America (2008)
- NAACP Legal Defense and Education Fund, Inc., Death Row U.S.A. (2016)
The data:
| White | Black | Hispanic | |
|---|---|---|---|
| U.S. population | 62.1% | 13.2% | 17.4% |
| Jail incarceration | 47.4% | 35.4% | 14.9% |
| State & federal incarceration | 33.6% | 35.4% | 21.6% |
| Life sentence | 33.4% | 48.3% | 14.4% |
| Life without parole sentence | 33.5% | 56.4% | 7.4% |
| Death row population | 42.5% | 41.7% | 13.0% |
