As jails around the county experiment with postcard-only policies, our new report examines jail mail standards in each state.
by Alison Walsh,
May 19, 2016
As new technologies such as video visitation and electronic messaging are too often introduced as expensive and low-quality substitutes for face-to-face contact in prisons and jails, letter writing would appear to be the most cost-effective and reliable communication option for incarcerated people and their loved ones.
And letters can help incarcerated men and women stay in touch not just with family members, but also with medical caregivers, social service workers, educators, and employers, making reentry less challenging and recidivism less likely. But jails in several states are experimenting with taking away letters and requiring people to communicate via postcards. A new report released today explores the role of state agencies in regulating counterproductive policies like the banning of letters.
The approximately 3,300 jails in the United States operate under a complex system of leadership. When individual jails adopt harmful policies such as letter bans, it becomes important to know which agency is in charge of setting and enforcing best practices in county jails on a statewide level. Corey Frost of Prison Policy Initiative’s Alternative Spring Break program set out to identify the entities that regulate jail standards in every state. He also determined whether each entity’s authority is binding and what restrictions (if any) these entities place on written communication. His new report, Protecting Written Family Communications in Jails: A 50-State Survey, finds that states that acknowledge the importance of written communication are less likely to contain jails that have adopted postcard-only policies.
Frost notes that although jails in 13 states have implemented letter bans, most state agencies prohibit restrictions on the volume or length of letters an incarcerated person can receive or send. In most states, including some of the states where sheriffs have banned letters, “restricting the written communication of incarcerated people to postcards contradicts the spirit, if not the letter, of the guidelines.” His report recommends that governing bodies, from groups with statewide oversight to local sheriffs and jail administrators, set guidelines that recognize the value of written communication, ensure that incarcerated people are allowed to receive and send letters of unlimited length and volume, and permit restrictions to mail service only when warranted by legitimate safety concerns.
Protecting Written Family Communications in Jails: A 50-State Survey, is a follow-up to Prison Policy Initiative’s 2013 report, Return to Sender: Postcard-only Mail Policies in Jails, which described the value of letter correspondence for incarcerated people and detailed the harmful consequences of postcard-only restrictions.
With a little over 6 months left in his term, President Obama is on track to become the President who has granted the smallest portion of clemency requests in history.
by Meredith Booker,
May 17, 2016
Earlier this month, President Obama granted clemency to an additional 58 incarcerated people, bringing the total number of clemency petitions he has granted to 376. While the White House boasts that the President has commuted more sentences than all of the last six presidents combined, any celebration of President Obama’s record on clemency is extremely premature. As a percentage of petitions received (a measurement that I argue better represents a President’s clemency effort) President Obama’s clemencies are the stingiest in the 116 years of available data.
By my measure, the President could grant clemency to 2,000 people tomorrow and still have granted a smaller percentage than President Reagan.
To be fair, President Obama’s percentage is so low because a record number of clemency petitions have been received; but President Obama solicited those petitions through a new clemency initiative in 2014 and made their review a central part of his criminal justice reform agenda. The actual performance, however, is a serious disappointment.
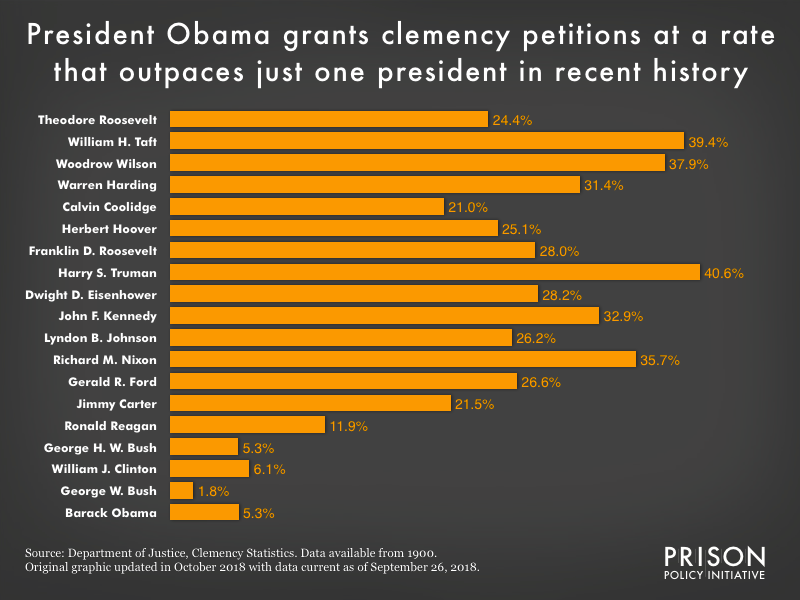
The Department of Justice has tracked the number of clemency petitions received and their outcomes since 1900. Using this data which includes the 58 clemency requests granted on May 5, 2016 by President Obama, I calculated the percent of clemency petitions that were granted (including pardons, commutations, and remissions) by each president since Theodore Roosevelt.
A different process was used the last time over 20,000 clemency petitions were received by the White House. President Ford convened a clemency board to review those charged with dodging the military draft during the Vietnam War. Ford’s Clemency Board was set up under an executive order (separate from the DOJ’s data graphed above), and its very operation was removed from the problematic pardon process that has complicated Obama’s effort.
In a great article on Fusion, Casey Tolan reports that over the course of a single year, President Ford’s board “reviewed 21,500 petitions and recommended that the president grant clemency to 14,514 of them.” That is an approval rate of 67.5%, even higher than Ford’s 26.6% of clemency requests granted through the DOJ process. No other president has convened such a board to review clemency petitions, despite it being suggested to the White House by law professor Mark Osler, and civil rights activist Nkechi Taifa in 2012 and 2013.
Part of why President Obama’s clemency initiative isn’t working is that it does the opposite of President Ford’s clemency board. Instead of making it easier to release those who have been punished by harsh War on Drugs policies, Obama created more layers of administrative oversight.
The process is failing so badly that the Pardon Attorney quit in January. Her resignation letter, obtained by USA Today was scathing, arguing that the DOJ & Deputy Attorney General:
- Failed to provide the resources it promised, including additional attorneys and staff
- Instructed her to “set aside” thousands of clemency petitions
- Overruled some of her recommendations for clemency, and
- Denied her access to White House counsel, disintegrating the integrity of the clemency decision-making process
With a little over 6 months left in his term, there is still time for President Obama to take broad and sweeping action on clemency. He needs to pick up the pace and change the structure to ensure that the next President doesn’t inherit “a sluggish and often intransigent review process” with unnecessary layers of bureaucracy.
Otherwise, the President’s grand intentions on clemency will leave him as the President who granted one of the smallest portions of requests for clemency in history. That’s not the legacy President Obama had in mind when he said that he would “make sure that more of our citizens – even those who have made mistakes — have a chance to become productive members of society and contribute to this country that we love.”
The graphic was updated October 5, 2018 to reflect President Obama’s final clemency record. His clemency program did “pick up the pace” at the very end of his presidency, ultimately granting 1,715 commutations and 212 pardons out of a total of 36,544 petitions received. The 1,927 total petitions Obama granted was the second-highest number granted through the DOJ process by any president since 1900, but this number still falls far short of his goal of 10,000.
The number of stop and frisks has gone down in recent years, but the practice is still not working.
by Yoo Eun Kim,
May 16, 2016
In 2013, a New York federal judge ruled that stop and frisk searches violate the constitutional rights of minorities and tasked Peter Zimroth, a former chief assistant district attorney, with introducing new policies to reform the NYC Police Department. Even though stop and frisk tactics are no longer sanctioned by the NYC Police Department, NYC officers have still been accused of employing stop-and-frisk tactics to conduct police stops and street interrogations.
Over the years, stop and frisk tactics have targeted a disproportionate number of young Blacks and Latinos. According to New York Civil Liberties Union (NYCLU) data, in each year from 2002-2012, over 80% of those apprehended were Black and Latino. In the same time period, over 80% of the New Yorkers searched by police were found innocent.
The NYCLU data also shows that from 2011 to 2015, the number of police stops and street interrogations declined by 97%. But the proportion of innocent individuals or minority groups subject to stop and frisk has remained virtually unchanged. From 2013-2015, the percentage of those who were stopped by police and found innocent remained at around 80%.
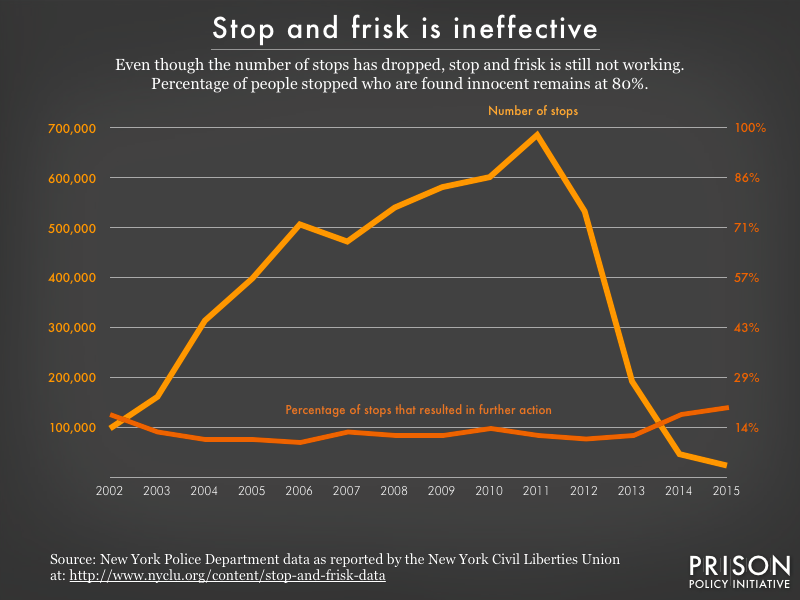
Even as the number of stop and frisks in New York has decreased significantly, the percentage of stops that resulted in further action has remained steady.
In other words, while stop and frisk is far less common today, it’s still not working when it is used. Baseless police stops and street interrogations continue to affect too many innocent minorities. The time has come to close the door on this controversial, unlawful police tactic that does little beyond undermining the liberty of minorities through fear and intimidation.
Yoo Eun Kim was a work-study Research Associate at Prison Policy Initiative from Spring 2014 to Spring 2016.
New report finds people unable to meet bail are poorest of the poor.
May 10, 2016
FOR IMMEDIATE RELEASE: May 10, 2016
Contact:
Bernadette Rabuy
brabuy [at] prisonpolicy.org
Easthampton, MA — People in local jails are significantly poorer than non-incarcerated people, and even poorer than people in prison, finds a new report by the nonprofit Prison Policy Initiative.
Detaining the Poor: How money bail perpetuates an endless cycle of poverty and jail time connects the large pretrial population in local jails to the criminal justice system’s reliance on money bail. “I kept hearing that 80% of defendants are indigent, but I was curious if people in local jails are even poorer than people in prison. To get a better picture of the role that money bail plays in the large unconvicted jail population in the U.S., we focused specifically on people unable to meet bail. I expected people unable to meet bail to be poor, but I was surprised that a majority fall within the poorest third of the national income distribution,” said Bernadette Rabuy, who, along with data scientist Dan Kopf, last year published a similar report on the pre-incarceration incomes of people in state prison.
The latest numbers from the Bureau of Justice Statistics (BJS) reveal that median bail for felony defendants was $10,000. “Using another BJS dataset, the Survey of Inmates in Local Jails, we found that the typical detained defendant would need to spend eight months’ income to cover $10,000 in money bail,” explained Kopf.
Detaining the Poor’s release coincides with newly published research by the Federal Reserve showing that many Americans are unable come up with $400 in an emergency without borrowing money from others or selling something. “If the average American cannot easily come up with $400, it is clear that a system that requires $10,000 from the poorest members of our society for pretrial release is a system set up to fail,” explained Rabuy.
The report provides the pre-incarceration incomes of people in local jails who had the opportunity to be released pretrial, but were unable to meet the conditions of bail. The report further breaks down the incomes of the detained population by race, ethnicity, and gender. Additionally, the authors compare pre-incarceration incomes to the incomes of similarly aged non-incarcerated Americans.
While the report focuses on the incomes of people who were detained for their inability to meet bail, the authors recognize the scarcity of useful information about the jail populations in this country, so they also provide the pre-incarceration incomes of people in local jails generally in an appendix.
The new report, Detaining the Poor: How money bail perpetuates an endless cycle of poverty and jail time is available at: http://www.prisonpolicy.org/reports/incomejails.html
The report is a collaboration between the Prison Policy Initiative and Dan Kopf, a member of the organization’s Young Professionals Network and co-author of last year’s report on the pre-incarceration incomes of people in state prisons.
-30-
Professor Margo Schlanger's data shows how the Prison Litigation Reform Act closed the courthouse door on incarcerated people seeking protection of their civil rights.
by Meredith Booker,
May 5, 2016
This article was updated in 2021 in a major report with more recent data about the impact of the Prison Litigation Reform Act. That version should be used instead of this one.
The Prison Litigation Reform Act, which made it much harder for incarcerated people to file and win civil rights lawsuits in federal court, was a key part of the Clinton-era prison boom. It turned 20 years old last week.
Law Professor Margo Schlanger has an important article using 40 years of court and imprisonment data to explore the impact of the Prison Litigation Reform Act on incarcerated people’s access to the courts:
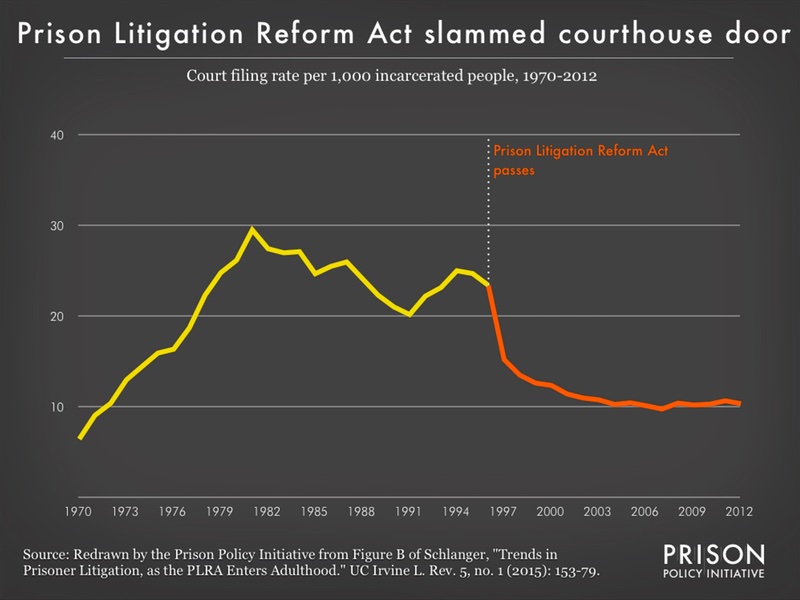
The filing rate by incarcerated people dropped significantly after the passage of the Prison Litigation Reform Act. And ironically, despite Congress’ fears of a prison lawsuits flooding the courts, this data that controls for the size of the prison population shows that in 1996, when the Prison Litigation Reform Act was passed, fewer lawsuits per 1,000 incarcerated people were being filed than during the ten year period of 1979-1988.
After the passage of the law, court filings by incarcerated people plummeted. This drop is largely attributed to several key provisions in the Prison Litigation Reform Act:
- Incarcerated people must exhaust all internal administrative grievance processes available to them within the correctional facility before taking their case to court. Working through these administrative processes can be complicated, have difficult deadlines, and often be fruitless.
- Suits alleging only mental or emotional harm are restricted. (Suits about physical injury are still allowed.)
- Courts are no longer allowed to waive court fees for incarcerated people, instead requiring installment payments. Additionally, an incarcerated plaintiff who has had three previous lawsuits dismissed can be required to pay in advance.
- When a lawsuit succeeds, the statute sharply limits the amount of litigation costs that the court can order the facility to pay the incarcerated person’s attorney. This reduces the number of lawyers willing to take good winnable cases on behalf of incarcerated people. In 2012, just over 5% of incarcerated people’s civil rights cases were represented by attorneys. (By contrast, 65% of non-incarcerated civil rights plaintiffs and 97% of labor and employment cases plaintiffs were represented by attorneys.)
- Places limits on the ability of the courts to change prison or jail policy.
These provisions shut incarcerated people out of the courts, to lasting effect. As Schlanger explains:
Since the 1970s, court orders have been a major source of regulation and oversight for American jails and prisons–whether those orders entailed active judicial supervision, intense involvement of plaintiffs’ counsel or other monitors, or simply a court-enforceable set of constraints on corrections officials’ discretion.
And her data illustrates that effect:
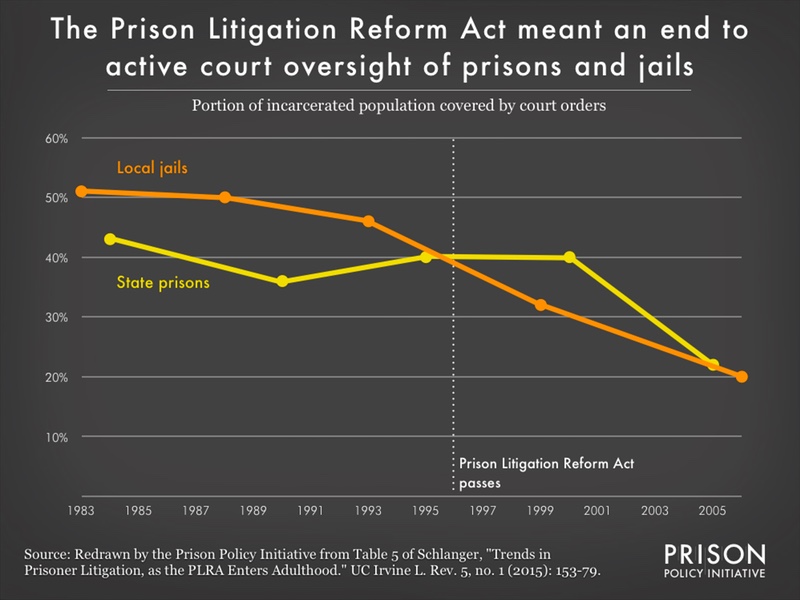
As existing orders expired, the portion of the incarcerated population that was covered by court ordered protection dropped sharply a few years after the Prison Litigation Reform Act. By the end of 2006, only 7 states had system-wide court order coverage in their jails or prisons.
The drafters of the Prison Litigation Reform Act argued that the goal was to limit frivolous lawsuits, which they claimed where rapidly increasing. While the number of prison lawsuits was rising in the 1990s, so too was the prison population. In fact, as Schlanger’s data in the first graph above reveals, court filings were – controlled for the size of the prison and jail population – actually lower than in the previous decade.
Now, at a time when the public and many elected officials are questioning the wisdom of mass incarceration, it’s time to reconsider the Prison Litigation Reform Act and the very idea of closing the courthouse doors to cries for justice.
Additional work about the Prison Litigation Reform Act by Margo Schlanger includes Civil Rights Injunctions Over Time: A Case Study of Jail and Prison Court Orders and Inmate Litigation.
All donations up to $1000 will be matched this Valley Gives Day.
by Alison Walsh,
May 2, 2016
Tomorrow is Valley Gives Day, a 24-hour online giving event for nonprofits located in western Massachusetts. And this Valley Gives Day, a generous supporter will match the first $1,000 (link no longer works) given to the Prison Policy Initiative.
So far this year, we have had historic successes in our major campaigns:
Help us keep the pressure on the Census Bureau to change where it counts incarcerated people, on the FCC to protect families from the exploitative jail and prison phone and video visitation industries, and on the remaining jurisdictions that still suspend driver’s licenses for drug offenses that have nothing to do with driving.
Please donate (link no longer works) before May 4th and double your impact. As always, we thank you for your support.
Attorney General uses pie chart report and jails matter blog post to show how many people are affected by justice system
by Bernadette Rabuy,
April 28, 2016
U.S. Attorney General Loretta Lynch penned a powerful op-ed in USA Today about the urgent need to remove the 45,000+ roadblocks that formerly incarcerated people face when reentering society. We were especially excited to see the Attorney General cite our report, Mass Incarceration: The Whole Pie, and our blog post, Jails matter. But who is listening?, in order to express the enormous churn in and out of our correctional facilities and the far larger universe of people affected by the criminal justice system.
The Department of Justice designated this week, April 24-30, the first-ever National Reentry Week in order to shine light on the many challenges formerly incarcerated people face and to encourage states and private businesses to do their part in easing these burdens.
Check out her op-ed.
We share some suggested language.
by Peter Wagner,
April 26, 2016
One of our donors asked how to remember the Prison Policy Initiative in her will, and I thought it might help others to share the suggested language here:
I give, devise and bequeath _______________ (insert dollar amount or item of property to be donated) to the Prison Policy Initiative, Inc., EIN 20-3671130 http://www.prisonpolicy.org, or its successor organization, a nonprofit corporation as described in section 501 (c) of the Internal Revenue Code, to be used to fight for a fairer justice system.
Thank you to all of our supporters for all of the generous ways that you make our work possible.
We make two graphs from Zaw, Hamilton, and Darity's groundbreaking dataset to illustrate the racial, ethnic and wealth disparities in incarceration.
by Meredith Booker,
April 26, 2016
The wealth disparity between young men who experience prison and those who never do is staggering. A fascinating study in Race and Social Problems makes this clear. The authors Khaing Zaw, Darrick Hamilton, and William Darity, Jr. use the National Longitudinal Study of Youth to examine the personal wealth of a group of young men, following them for 27 years. When the young men are divided into two groups – those who experience incarceration at some point in their lives and those who never do – a striking disparity emerges.
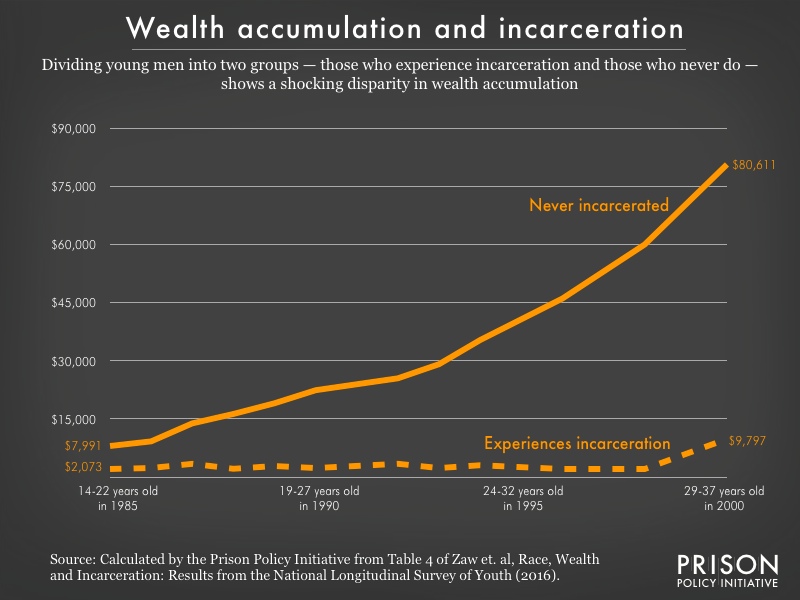 When it comes to the economic impacts of incarceration, one point becomes very clear: men who experience incarceration maintain lower levels of wealth throughout their lifetimes compared to men who are never incarcerated. This disparity is present before, during, and after a person is incarcerated. (The data stops in 2000 because of small numbers of survey respondents for some subgroups; the authors note that the wealth trends remain in the years that followed.)
Once an individual is incarcerated, they often lose what little wealth they have and are left with little to no wealth accumulation. Once released, that individual may make gains in wealth accumulation, but they will always remain at significantly lower levels of wealth compared to those who are never incarcerated in their lifetime.
This is consistent with our previous conclusions about differences in pre-incarceration incomes in our report Prisons of Poverty: Uncovering the pre-incarceration incomes of the imprisoned, where we use a little-used government dataset to find that pre-incarceration incomes of incarcerated people are 41% lower than those of people of similar ages on the outside.
Looking at the same trend disaggregated by race adds another layer of detail to the story. In a press release, author Khaing Zaw says, “When it comes to wealth and incarceration outcomes, the disadvantages of being black or Hispanic compound the disadvantages of poverty.” White men that never experience incarceration will accumulate the most wealth compared to Black and Hispanic men regardless of incarceration status. At the other end of the spectrum, Black men that are incarcerated at some point in their lifetime accumulate less wealth compared to all other groups regardless of incarceration status. Later in life, this disparity endures. As the survey respondents got older, white men who experienced incarceration reported higher levels of wealth compared to Black men who had never experienced incarceration.
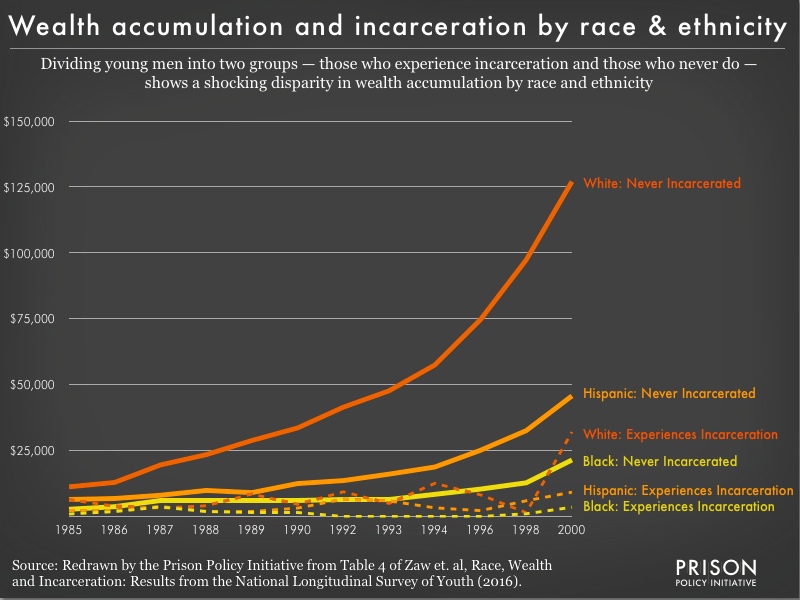 Previous research in Black Wealth, White Wealth: A New Perspective on Racial Inequality highlights the gap between the wealth of white people and that of Black people. This graph shows that even white men who experienced incarceration have greater wealth than Black men who never experienced incarceration.
This striking racial disparity, where even white men who have experienced incarceration accumulate wealth faster than Black men who have never experienced incarceration, brings to mind Devah Pager’s research about the impact of a criminal record on gaining employment. Pager found that between white men and Black men, white men who had a record of incarceration were more likely to be called back for a job interview compared to Black men with no history of incarceration. The “mark” of incarceration is harsh for everyone, but for Black men, it can be financially crippling for a lifetime.
The study, “Race, Wealth and Incarceration: Results from the National Longitudinal Survey of Youth” follows a cohort of youth over 27 years and presents wealth data in relation to race, sex, and incarceration status. For the graph entitled “Wealth accumulation and incarceration,” I used the tables in the article to calculate the average median wealth, weighted by the number of respondents in each racial category, for those that never experienced incarceration and those that experienced incarceration at some point, and I extrapolated the data for years 1991, 1995, 1997, and 1999.
For the first time since 2013, in-person visits will be allowed at Travis County jails.
by Alison Walsh,
April 19, 2016
Visits in Travis County, Texas, took on a special significance today. This morning marked the end of the county’s video-only visitation policy and the first time since 2013 that people incarcerated in the county’s jails were able to see their loved ones through a plexiglass window instead of a computer screen.
In 2013, Travis County phased out its in-person visitation program and adopted a video-only visitation policy. Jail administrators claimed that video was more efficient and conducive to more frequent visitation. Families reported a different experience, and the current psychological research confirms that video and in-person communication are far from equal.
The reversal in Travis County sets a new precedent. While almost three-fourths of the jails that adopt video visitation also ban in-person visits, the Travis County jails are now an example of how the technology can supplement in-person visits and improve communication options for families.
Congratulations to Grassroots Leadership, and to the formerly incarcerated people and their families whose advocacy brought about this change!


 When it comes to the economic impacts of incarceration, one point becomes very clear: men who experience incarceration maintain lower levels of wealth throughout their lifetimes compared to men who are never incarcerated. This disparity is present before, during, and after a person is incarcerated. (The data stops in 2000 because of small numbers of survey respondents for some subgroups; the authors note that the wealth trends remain in the years that followed.)
 Previous research in


