Formerly incarcerated people overwhelmingly want to work, but they face huge obstacles in the job market.
July 10, 2018
Easthampton, Mass. – For the 5 million formerly incarcerated people living in the U.S., landing a job means more than just personal success: It means finding a place in their communities and being able to care for their loved ones again.
It’s well known that the obstacles to finding a job are severe for formerly incarcerated people. The scale of this problem, however, has been difficult to measure – until now.
In Out of Prison & Out of Work, the Prison Policy Initiative calculates that 27% of formerly incarcerated people are looking for a job but can’t find one:
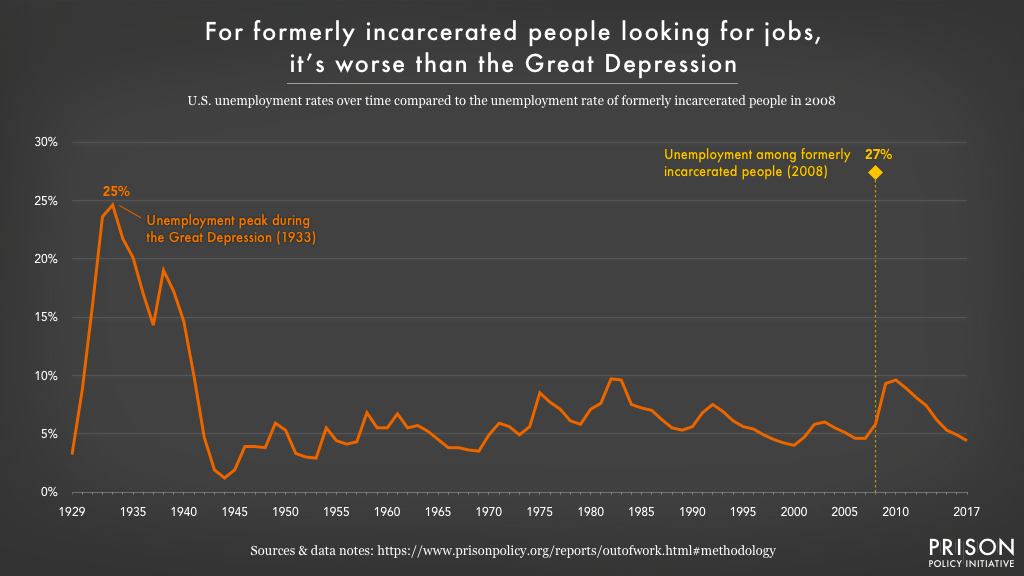
This rate, which surpasses anything Americans have experienced since the height of the Great Depression, is especially striking given the report’s other findings:
- Formerly incarcerated people are more likely than the average American to want to work;
- People of color and women face the worst “penalties” in the job market after going to prison, making historical inequalities in the labor force even worse;
- Unemployment is highest for people released in the last two years, when they are most vulnerable to re-incarceration.
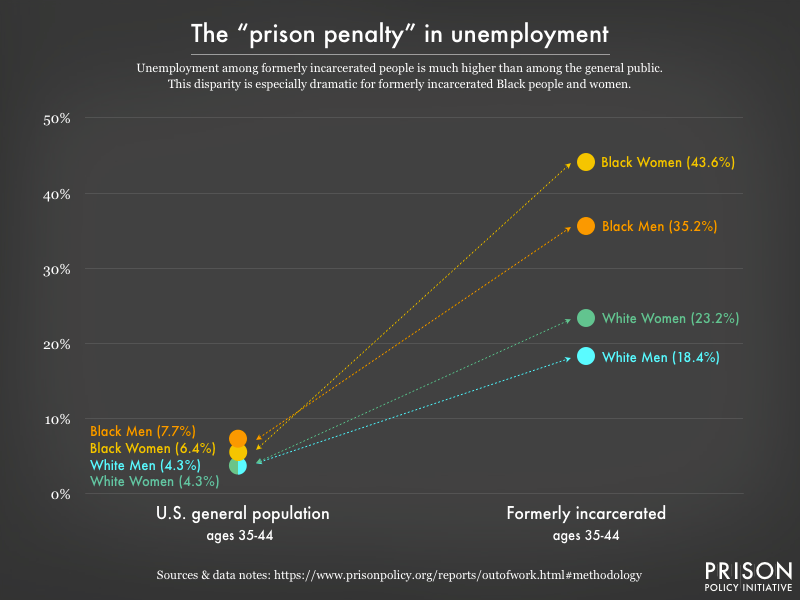
“These high unemployment rates reflect public will, policy, and practice – not differences in aspirations,” said author Lucius Couloute. In the report, he lays out policy solutions for closing this vast employment gap, including:
- A temporary basic income for formerly incarcerated people after their release;
- Automatic mechanisms for criminal record expungement;
- Occupational licensing reform at the state and industry levels.
Today’s report is the first of three to be released by the Prison Policy Initiative this summer, focusing on the struggles of formerly incarcerated people to access jobs, housing, and education. Utilizing data from a little-known and little-used government survey, Couloute and other analysts can describe these problems with unprecedented clarity. In this report and the two more to follow, they recommend reforms to ensure that formerly incarcerated people – already punished by a harsh justice system – are no longer punished for life by an unforgiving economy.
Mass incarceration grew at breakneck speed, year after year. Our reforms need to be equally ambitious.
by Peter Wagner,
June 5, 2018
Last month, the Vera Institute of Justice released a useful report with each state’s prison population as of year-end 2017. Their report fills an important gap until the Bureau of Justice Statistics publishes similar (and more detailed) numbers at the end of this year or early next. Compared to how criminal justice data usually works in this country, having numbers just 6 months old feels like a luxury.
Now, armed with timely data, we should discuss what this means and why our elected officials aren’t doing enough. But first, here are the big picture takeaways from the report:
- Total prison population is down 1% over the previous year.
- Some states are down even more, including Maryland, down 9%.
- Twenty states increased their prison populations, and half of those hit new all-time-highs.
By adding in other historical data, we can bring the broader trends into focus and highlight a hidden truth behind the slow decline of the national prison population: the sustained reductions in prison populations in just three large states — California, New York and New Jersey (plus, in the last 5 years, the Bureau of Prisons) — are responsible for a disproportionate share of the recent prison decline.
The prison populations of those three states peaked at different times, but to keep things simple, let’s look at the impact policy changes in those states have had, on the country and on themselves, since 1999 (when New York and New Jersey peaked):
Note that this data concerns only state prisons. About a third of the incarcerated population is in local jails, which are officially locally run but are ultimately responsive to state law. For more on the difference between prisons and jails, see Mass Incarceration: The Whole Pie 2018, and for state responsibility for jail growth, see Era of Mass Expansion: Why State Officials Should Fight Jail Growth.
|
1999-2017 |
|
Change |
Growth |
| California |
-31,669 |
-19.4% |
| New Jersey |
-12,040 |
-38.2% |
| New York |
-22,497 |
-30.9% |
| National |
125,911 |
9.2% |
| National without CA, NY, NJ |
192,117 |
17.5% |
So the news that Maryland’s prison population was down 9% during 2017 is good news. And it’s even better news in the context that this one-year drop comes after 6 consecutive years of smaller decreases. But through the longer lens of history, we see that Maryland has much further to go to undo the damage caused by the 1980s alone, when its prison population grew by 8% each year for a decade.
Nationwide, the state prison population in this country is 4.5 times larger now than it was in 1980, because the 1980s and 1990s saw very high rates of annual growth, year after year:
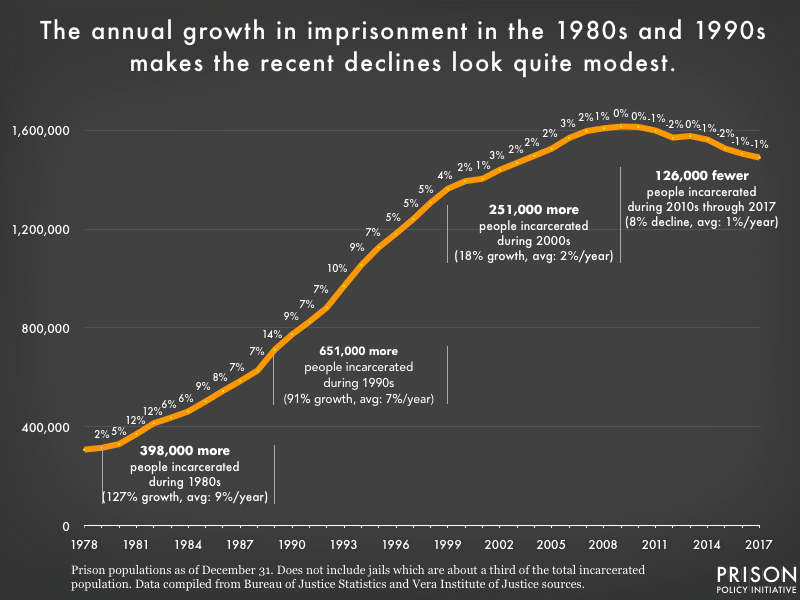
Annual average prison growth — and growth per decade — was much more dramatic in the 1980s and 1990 than the more modest changes since 2000.
|
1980s |
1990s |
2000s |
2010-2017 |
| Annual Prison growth |
8.6% |
6.7% |
1.7% |
-1.0% |
As you would expect, some years were worse than others. For example, the entire national prison system grew by about 12% in both 1981 and 1982. The historic but single-year 9% drop in Maryland can hardly make a dent in the national damage done in just those two years. Neither can reformer New York, whose entire state prison population is currently smaller than the growth in the national prison population each and every year in the 1990s.
We arrived at our position as the world’s largest incarcerator not overnight, but by making the wrong choices to large effect, year after year for decades. Undoing it will require making the better policy choices, year after year, with the same consistency.
There are many ways to do better. Take the sentences imposed when someone is found guilty by a court. In the United States, the most common outcome is incarceration. In other countries, other options are more common, as explained by this graph, based on data from a Finnish government report:
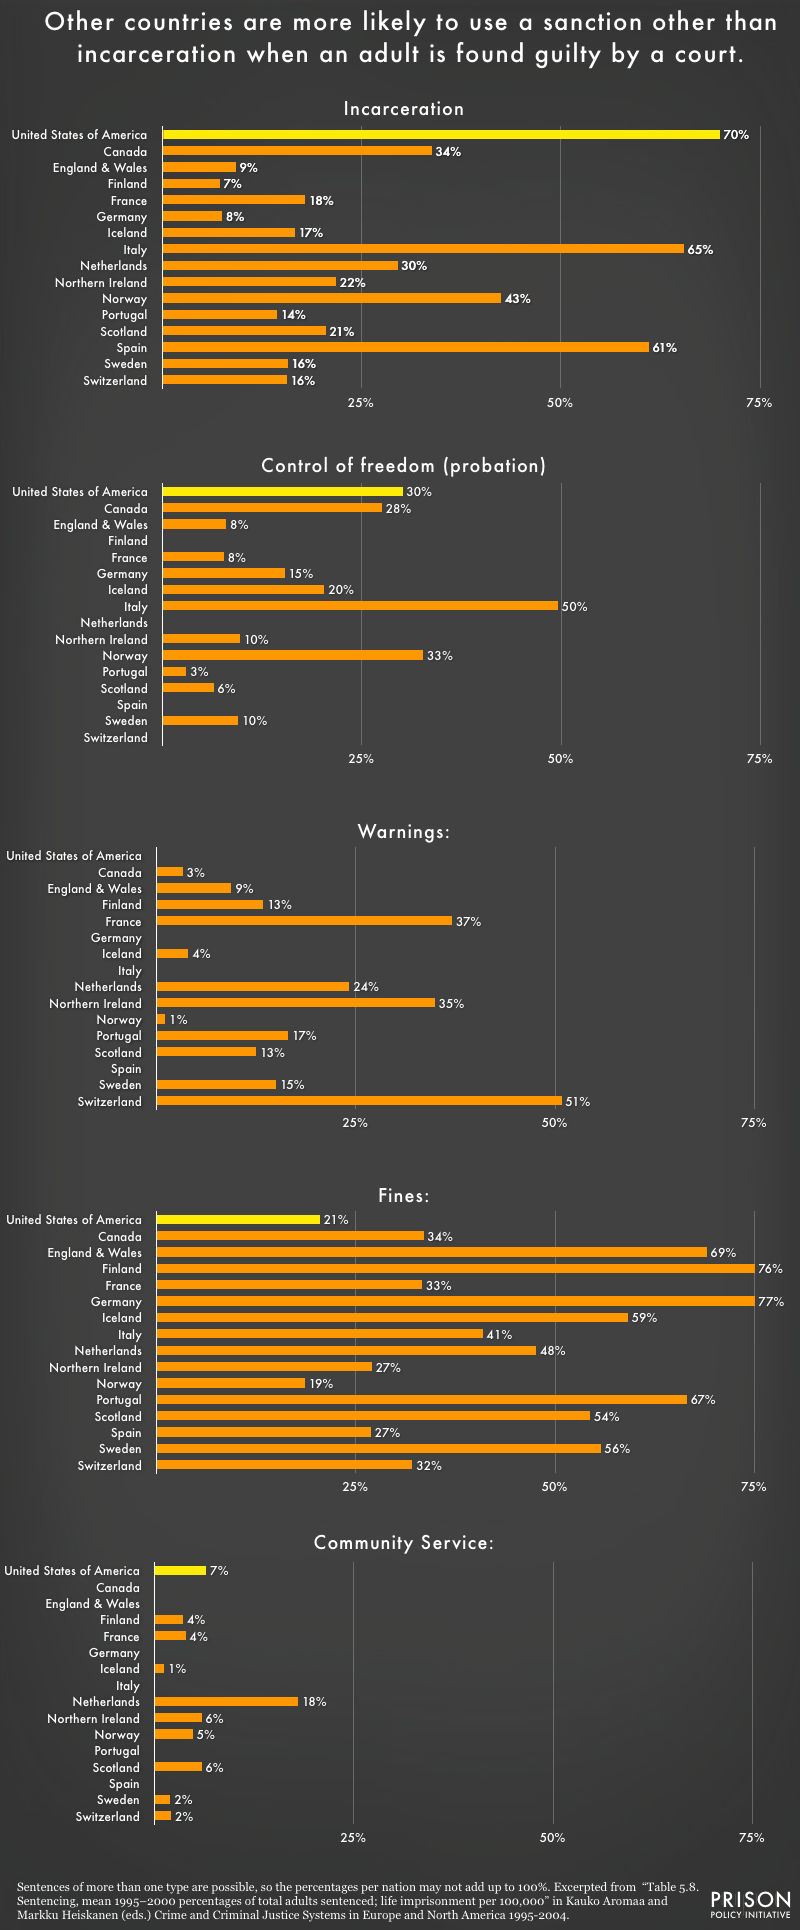 In the United States, the most common punishment upon a guilty verdict is incarceration. Other countries rely more heavily on a range of options from fines, warnings, community service and “control of freedom,” which in the United States would be called probation.
I found this study cited in a very useful 2011 report by the Justice Policy Institute, Finding Direction: Expanding Criminal Justice Options by Considering Policies of Other Nations. The report compares large stable democracies, finding a lot of basic similarities: educational attainment, government spending on education and even the occurrence of crime. Where they differ is on approaches to criminal justice, both in terms of incarceration, and in many of the policy choices that lead to it.
The Justice Policy Institute report emphasizes that it’s not just the size of the systems, but how they are run that matters. For example:
- Adults in Finland are more than twice as likely to be “suspected, arrested, or cautioned” by law enforcement than adults in the United States. (This is true even though Finland has a fewer police per capita than the United States.) (p. 15) (Despite the frequency of these interactions, 96% of Finns report trusting the police, indicating significant qualitative differences in police encounters between the U.S. and Finland. The Justice Policy Institute report touches upon these differences, p. 14).
- Sentences for similar crimes are much longer in the United States than in England and Wales, Australia and Finland. (p. 22)
- Even in countries where drug sentences are somewhat similar in length to those in the United States, all countries have a much smaller portion of their prisons filled with people serving drug sentences. (p. 26 and 22) (And this difference isn’t explained by differences in drug usage, p. 27)
- Other countries are more likely to release people to an intermediate status of supervision prior to the maximum end of their sentence. (p. 34-35)
- Other countries are more likely to provide social services rather than confinement to youth, and most countries have much higher ages of criminal responsibility than the United States. (These are laws that allow children as young as 6 — in the United States — or 14 in the case of Germany to be charged with a crime.) p. 47
Of course the Justice Policy Institute report did identify differences between nations, some of which make it harder or easier for those nations to address crime more effectively. But some of these differences also indicate that some of the best ways to address crime might be found outside of criminal
justice. For example:
- Australia, Canada, Finland and Germany each spend a larger portion of their GDP supporting unemployed people than does the United States. (p 55.)
Ending mass incarceration will require a fresh and holistic look at our societal values and priorities. Our challenge is to overcome the ideology that made it so easy for states to create the system of mass incarceration: While building up the system required complex budgetary and infrastructure changes, ideologically it was quite simple for the state to rally the public around locking up “dangerous criminals.” There were no sudden shifts in societal thinking, just a lot of tiny levers that were gradually pulled over 30 years to make every step of the criminal justice system more punitive.
Successfully ending mass incarceration will require the mirror image of the process of creating it: a sustained, multi-decade, 50-state series of policy changes that reduce the prison population significantly, year after year. It’s clear from the data above that the current pace of reform will not end mass incarceration in our lifetimes, but the fact that the system was built so quickly also means that it could, if the political will can be created, be dismantled just as quickly.
In our letter to the Florida Department of Corrections, we explain why cutting visiting hours is bad policy and an inhumane practice.
by Lucius Couloute,
May 31, 2018
Florida’s Department of Corrections recently proposed new policies that would allow correctional facilities in the state to reduce their visitation hours by half, limiting opportunities for families to see their incarcerated loved ones in person. You’d be hard-pressed to find many people who actually believe reducing prison visits is a good idea, but the DOC has cited issues with contraband and staff costs as the impetus for the proposed changes.
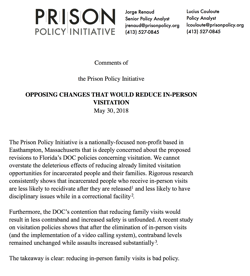
Senior Policy Analyst Jorge Renaud and I wrote a comment letter opposing the proposed changes, citing established research that shows how reducing visitation is bad correctional policy. Moreover, we argued, it’s simply cruel:
Ensuring that incarcerated people maintain ample connection to the outside world is humane, cost-effective, and would result in less dangerous correctional facilities – to the benefit of everyone.
The plan to reduce these visits in favor of for-profit video chatting will undoubtedly force the families of incarcerated people to visit stale, flatscreen kiosks inside of correctional facilities, or to pay high fees when video chatting from home (a service that is usually free). Both options trivialize the importance of family relationships during periods of incarceration.
Reducing the opportunities incarcerated people have to see their families would be an unfortunate development in Florida’s justice system, which is already being criticized for cutting vital rehabilitative programs this year.
If Florida would like to reduce the need for visitation (because of costs or contraband), reducing the overall prison population would be a good start.
Update: check out journalist Ben Conarck’s twitter thread for coverage of a public hearing on visitation in Florida.
Our new Senior Policy Analyst brings a wealth of organizing, writing, and policy experience.
by Wendy Sawyer,
May 30, 2018
 Please welcome our new Senior Policy Analyst, Jorge Renaud.
Jorge’s new role marks a return to policy work after three years of community organizing, most recently at Grassroots Leadership in Austin, Texas. Jorge also holds a Master’s degree in Social Work from the University of Texas at Austin.
He is an accomplished writer: While incarcerated, he wrote as a contributing columnist for Hispanic Link Weekly Report, focusing on race and incarceration, published poetry and essays, and authored a book, Behind the Walls: A Guide for Families and Friends of Texas Prison Inmates.
At the Prison Policy Initiative, Jorge is focused on writing about criminal justice policy in ways that will fuel the work being done by those directly affected by the criminal justice system.
Welcome, Jorge!
In a first-of-its-kind data analysis, we explore the economics of prison commissaries in three states.
May 24, 2018
The ongoing – and growing – exploitation of incarcerated people and their families has been a central theme in our work at the Prison Policy Initiative. In our new report, attorney Stephen Raher explores another overlooked but central part of prison life: the commissary. The fairness of prison commissaries is an essential bread-and-butter issue for incarcerated people, who have only the store’s limited options to choose from when the prison fails to provide them with what they need.
In his report, The Company Store: A Deeper Look at Prison Commissaries, Raher analyzes commissary sales data from three states to address questions like:
- What do people spend the most money on in prison commissaries?
- How “fair” are prices, compared to “free-world” prices and relative to prison wages?
- How does the emerging digital market compare to traditional commissary sales, like food and toiletries?
The three states sampled – Illinois, Massachusetts, and Washington – were the few from which we could easily obtain detailed statewide commissary sales data. Fortunately, this sample includes examples of both state-run and privately operated commissary systems, as well as a range of prison population sizes. While we would warn against generalizing broadly based on this small sample, the report highlights a number of issues that merit further study and serious consideration by policymakers.
The purpose and fairness of prison commissary systems come into question in light of the report’s findings:
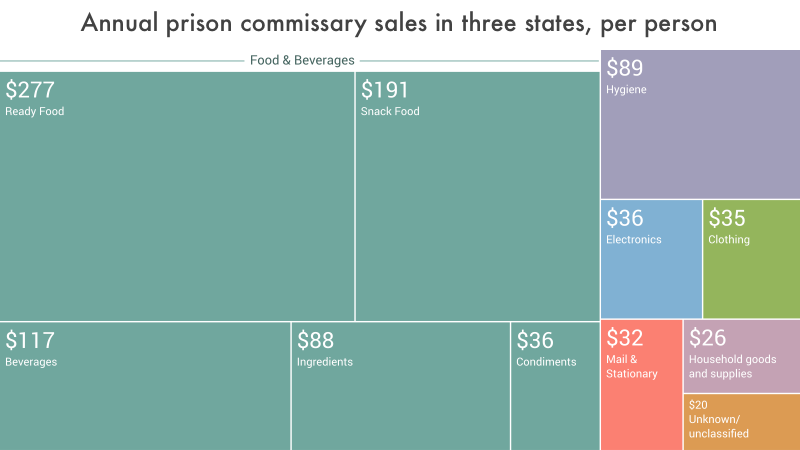
- Incarcerated people spent an average of $947 per person annually through commissaries – well over the typical amount they can earn at a prison job. In these three states, an incarcerated worker holding a job supporting the prison, such as food service or custodial work, would usually earn $180 to $660 per year.
- Incarcerated people buy most items to meet basic needs, like food, hygiene, and over-the-counter medicines, rather than “luxuries.” 75% of the average person’s annual commissary spending in the three sampled states was used to purchase food and beverages, indicating a widespread need to supplement the food provided by the prisons.
The findings also point to the incentives of the prison retail market for private commissary vendors:
- While private vendors generally charge prices comparable to those found in outside prisons, monopoly contracts and the ability to transfer goods straight from the warehouse to the customer mean vendors’ operating costs are often lower than in the “free world.” Yet their prices do not always reflect these advantages.
- The most obvious price-gouging is found in new digital services marketed to prisons, such as email and music streaming. Prison and jail telecommunications providers are aggressively pushing these new products and services, where they can charge prices far higher than similar businesses do outside of the prison setting.
- Even in state-run commissary systems, private companies are poised to profit. In Illinois, the Keefe Group (one of the largest commissary companies) was not contracted to run the commissary, but still made up the dominant share (30%) of the state’s purchases for commissary goods.
Commissaries present yet another opportunity for prisons to shift the costs of incarceration to incarcerated people and their families. Meanwhile, telecommunications contractors with prison contracts are maximizing their revenues by offering more digital services at exorbitant rates. Instead of leveraging incarcerated people to subsidize the prison system by monetizing their every need, the report concludes, states could more effectively cut costs by drastically reducing prison populations.
Mass incarceration intensifies the financial and social burdens that already fall too hard on women.
by Lucius Couloute,
May 14, 2018
1 in 4 women in the U.S. – and nearly 1 in 2 Black women – have a loved one who is incarcerated, but even in conversations about ending mass incarceration, the hardships these women face get little attention. A new report from the Essie Justice Group exposes the profound isolation that is experienced by these women and ignored by the rest of society.

Essie surveyed over 2,000 women and collected a wealth of focus-group and interview data, all aimed at uncovering the experience of being a woman with an incarcerated loved one. We partnered with Essie to help analyze this data. Our work produced disturbing findings: Not only do women with incarcerated loved ones feel stigmatized and isolated; they also disproportionately suffer from financial insecurity, homelessness, and serious mental and physical health problems.
Women provide their incarcerated loved ones with numerous types of support, which can include posting bail or paying burdensome court fees. Shouldering these burdens often destabilizes their lives: Fully 43% of the women Essie surveyed had missed out on educational opportunities, changed their career plans, or taken on longer hours as the result of their loved one’s incarceration. More than half of them had childcare responsibilities as well.
It’s clearer than ever that overpolicing and overcriminalization – far from making families safer – creates anxiety and insecurity for the mothers, wives, and sisters of people behind bars. Women with incarcerated loved ones are isolated politically, not just socially. Listening to their experiences is critical to understanding how mass incarceration devastates entire communities.
80% of the women jailed each year are mothers. We're inflicting profound damage not only on them, but their children as well.
by Wendy Sawyer and Wanda Bertram,
May 13, 2018
This report is has been updated with a new version for 2022.
Women incarcerated in the U.S. are disproportionately in jails rather than prisons, and even a short jail stay can be devastating, especially when it separates a mother from children who depend on her.
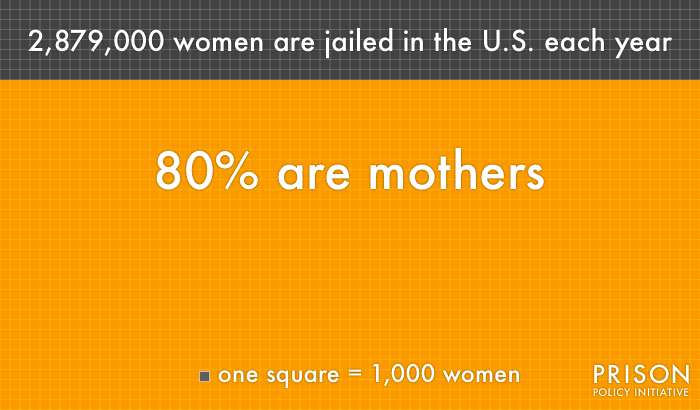 Estimates have been rounded for this graphic. Sources: Federal Bureau of Investigation, Crime in the United States 2016 (including supplemental table “Arrests by Sex, 2016”); and Vera Institute of Justice, Overlooked: Women in Jails in an Era of Reform.
80% of the women who will go to jail this year are mothers – including nearly 150,000 women who are pregnant when they are admitted. Beyond having to leave their children in someone else’s care, these women will be impacted by the needlessly brutal side effects of going to jail: Aggravation of mental health problems, a greater risk of suicide, and a much higher likelihood of ending up homeless or deprived of essential financial benefits.
It’s time we recognized that when we put women in jail, we inflict potentially irreparable damage to their families. Most women who are incarcerated would be better served though alternatives in their communities. So would their kids.
For nearly a year, the FCC knew about Securus’s cellphone tracking and turned a blind eye.
by Aleks Kajstura,
May 11, 2018
Abuse of power in the nation’s prison and jails is nothing new, but now correctional staff can target any person in the U.S. – as long as that person has a cell phone. Last night, The New York Times reported that Securus allows facility staff to track any cell phone in the country.
Securus has contracts with hundreds of correctional and law enforcement agencies across the country, meaning that staffers at any of these agencies can track you on a whim. Shouldn’t they at least have a warrant or affidavit if they want to track your cell phone? Absolutely – but Securus isn’t checking. What if you never even talked to anyone in any correctional facility? Securus doesn’t check on that, either.
As the Times reports, Senator Ron Wyden (D-OR) sent a letter to the FCC asking them to investigate, as well as letters to phone companies like Verizon and AT&T, who provide the tracking data to Securus.
The thing is: the FCC already knew about this. When Securus was up for sale last year, Lee Petro, representing the Wright Petitioners, pointed to this very practice as a reason for the FCC to block the sale. But the FCC turned a blind eye.
Thanks to Senator Wyden’s letters, Verizon, AT&T, Sprint, and T-Mobile are starting to ask their own questions. But it’s a sad day when the FCC has to rely on telecom giants to carry out its mandate.
Homicide victimization rates for Black men, Black women and Indigenous women are consistently higher than for other racial and ethnic groups.
by Emily Widra,
May 3, 2018
I wanted to compare homicide victimization across racial, ethnic, and gender groups over time, since this data is deceptively difficult to find in one place.
In the process, I found that the murder victimization rate for Black men is consistently higher than the rates for men of all other racial and ethnic groups have ever been:
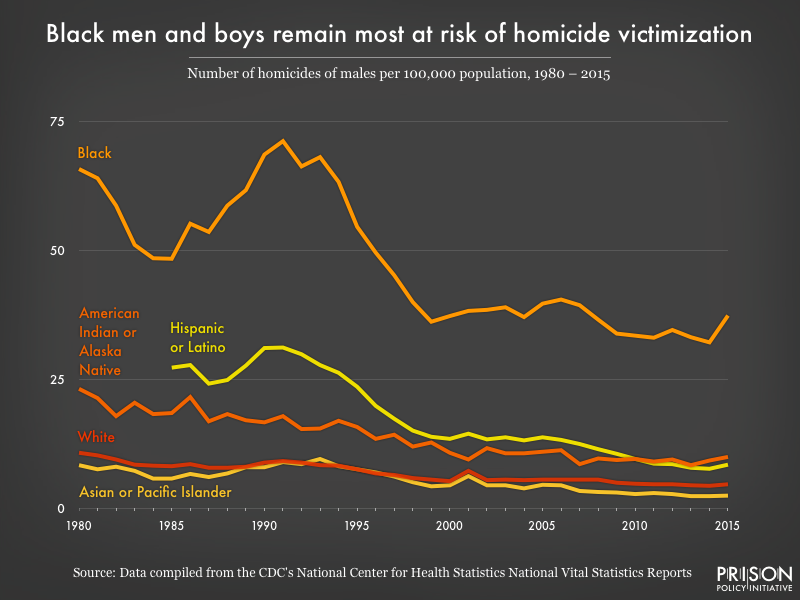 Despite a drop in overall murder rates, the racial disparities in male murder victimization rates have persisted.
Controlling for gender reveals more complexity. For example, the rate of homicide of Indigenous women is higher than the rate of homicide for Hispanic and Latina women, whereas the opposite is true for their male counterparts:
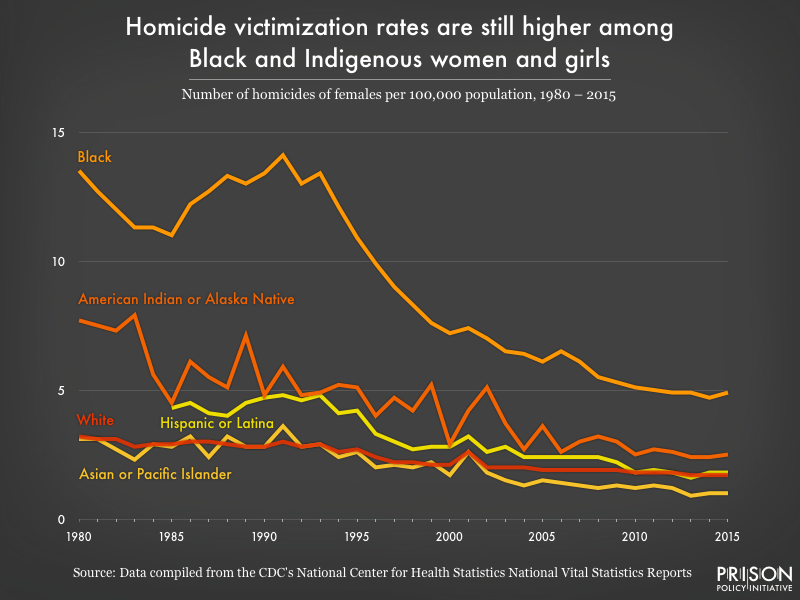 Overall, Black, Hispanic or Latinx, and American Indian and Alaskan Native people are murdered at much higher rates than their white or Asian and Pacific Islander counterparts.
Overall murder rates have been declining since 1980, when the total rate for murder and non-negligent manslaughter was 10.2 per 100,000 people. But the disproportionately high rate at which Black Americans are murdered should still concern lawmakers, reporters, and the public.
Unfortunately, conversations about about this problem often fall back on the assumption that violence in Black communities has cultural — or even biological — roots. But these assumptions aren’t supported by data.
For instance, Krivo and Peterson’s analysis of crime data in Columbus, Ohio shows that economic disadvantage, not race, is the strongest predictor of violence in a particular neighborhood. “In fact,” they conclude, “violent crime rates for extremely disadvantaged white neighborhoods are more similar to rates for extremely disadvantaged black areas than to rates for other types of white neighborhoods.”
Studies like these suggest that racial disparities in murder rates stem from a variety of structural causes, most notably economic inequality. (To dig deeper, see Krivo and Peterson’s study controlling for neighborhood disadvantage, as well as the Violence Policy Center’s recent study of Black homicide victimization.)
Comparing violent crime rates to public opinion data shows that there's a long-standing disconnect between perception and reality.
by Emily Widra,
May 3, 2018
I updated a graph from our 2003 book The Prison Index to answer the question: How closely does Americans’ fear of violent crime reflect the actual violent crime rate?
The answer: Hardly at all.
Beginning in 1965, Gallup began asking Americans if there was “any area near where you live…where you would be afraid to walk alone at night?” Over time, these poll results show a tenuous relationship, at best, between the violent crime rate and the number of people who report being afraid:
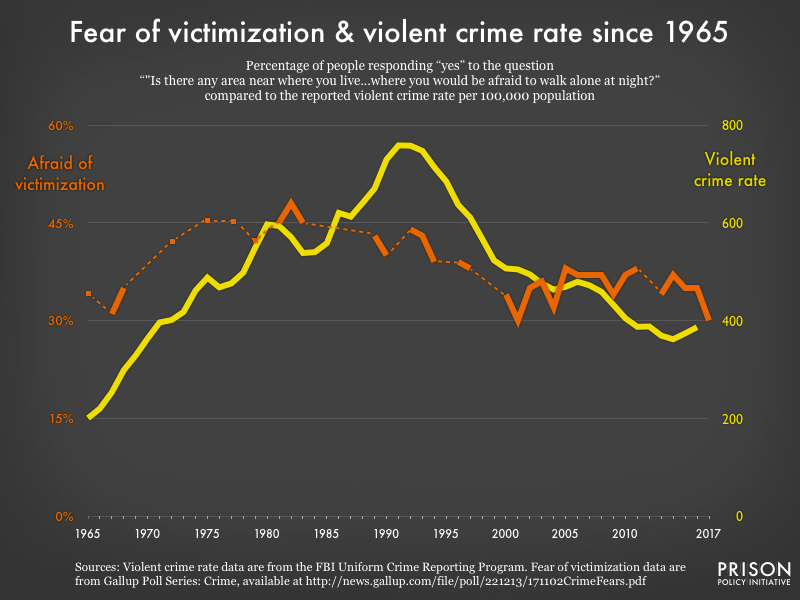 The violent crime rate (yellow) peaked in 1991. The fear of crime (orange) peaked nine years earlier and was already declining when the violent crime rate was approaching its peak.
Of course, this data isn’t sensitive to regional and economic variations in crime across the country. And people who aren’t afraid of being attacked might be afraid to walk around at night for other reasons.
But it’s interesting to explore the discrepancy between perception and reality. From the early 1980s to the early 1990s, as violent crime reached historic heights, Americans’ fear of victimization fell.
This isn’t to say that Americans are grossly out of touch. But it should remind elected officials and media that the last place to look for evidence of a crime wave is in public opinion polls.


 In the United States, the most common punishment upon a guilty verdict is incarceration. Other countries rely more heavily on a range of options from fines, warnings, community service and “control of freedom,” which in the United States would be called probation.

 Please welcome our new Senior Policy Analyst, Jorge Renaud.

 Estimates have been rounded for this graphic. Sources: Federal Bureau of Investigation,
  Despite a
  Overall, Black, Hispanic or Latinx, and American Indian and Alaskan Native people are murdered at much higher rates than their white or Asian and Pacific Islander counterparts.
 The violent crime rate (yellow) peaked in 1991. The fear of crime (orange) peaked nine years earlier and was already declining when the violent crime rate was approaching its peak.


