Not just “a few bad apples”: U.S. police kill civilians at much higher rates than other countries
Police violence is a systemic problem in the U.S., not simply incidental, and it happens on a scale far greater than other wealthy nations.
by Alexi Jones and Wendy Sawyer, June 5, 2020
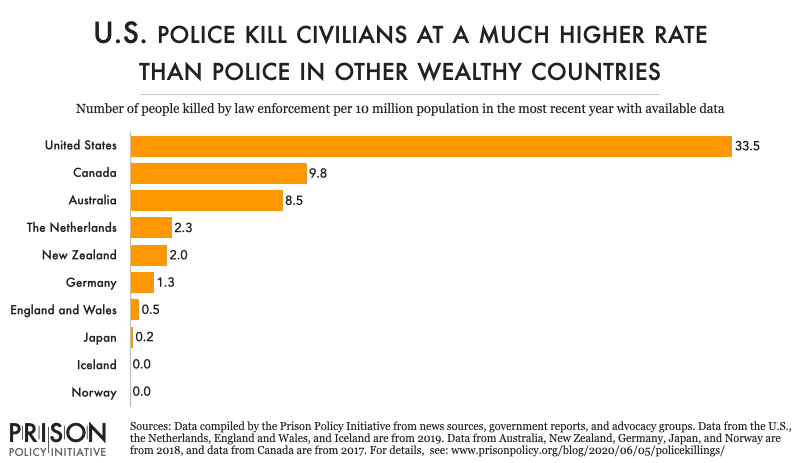
There is no question that the number of police killings of civilians in the U.S. – who are disproportionately Black and other people of color – are the result of policies and practices that enable and even encourage police violence. Compared to police in other wealthy democracies, American police kill civilians at incredibly high rates:

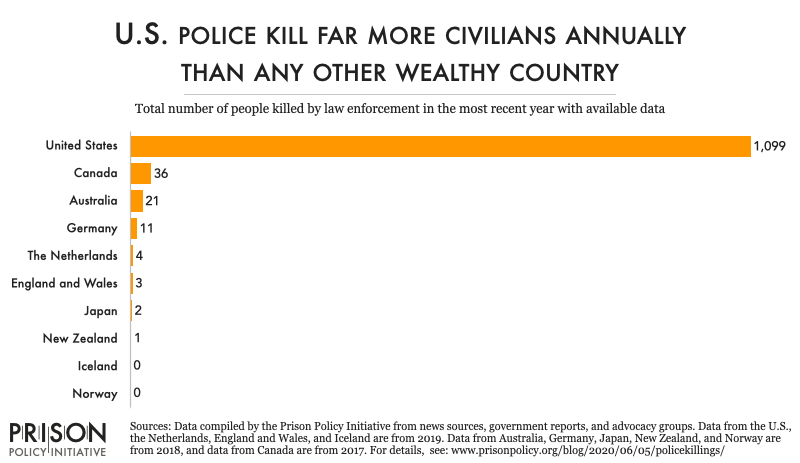
The chart above compares the annual rates of police killings in each country, accounting for differences in population size. This is the most apples-to-apples comparison we can make with this data.1 But the total number of deaths at the hands of police is also worth seeing in comparison with other countries:

The sources for these charts are listed in the table below. For more statistics on police, arrests, and incarceration in the United States, see these other pages:
- Ten key facts about policing
- Policing Women: Race and gender disparities in police stops, searches, and use of force
- Arrest, Release, Repeat: How police and jails are misused to respond to social problems
- Visualizing the racial disparities in mass incarceration
- Mass incarceration state profiles
| Country | Annual number of law enforcement killings | Total population | Law enforcement killings per 10 million people | Source for number of law enforcement killings | Data year | Source for total population |
|---|---|---|---|---|---|---|
| United States | 1,099 | 328,239,523 | 33.5 | Mapping Police Violence | 2019 | U.S. Census Population Clock (population as of July 1, 2019) |
| Canada | 36 | 36,708,083 | 9.8 | CBC News, Deadly force: Fatal encounters with police in Canada: 2000-2017 |
2017 | Statistics Canada (population estimate as of July 1, 2017) |
| Australia | 21 | 24,770,700 | 8.5 | National Deaths in Custody Program, Deaths in custody in Australia 2017-18. This includes deaths that occurred in police custody and custody-related operations (i.e. motor vehicle pursuit deaths). | 2017-2018 (1 year of data) | Australian Demographic Statistics December 2017 (Year-end 2017 population estimate) |
| The Netherlands | 4 | 17,282,163 | 2.3 | Public Prosecution Service | 2019 | Statistics Netherlands (CBS) Population key figures (2019 population estimate) |
| New Zealand | 1 | 4,840,600 | 2.1 | NZ Police Tactical Options Research Report, 2018 |
2018 | New Zealand Government Statistics (Year-end 2018 estimate) |
| Germany | 11 | 82,905,782 | 1.3 | DPA news agency, as cited by Deutsche Welle in German police kill sword-wielding man in front of his mother (2019) | 2018 | The World Bank, population data (2018 population estimate) |
| England and Wales | 3 | 59,439,840 | 0.5 | INQUEST, Fatal police shootings | 2019 | UK Office for National Statistics, Estimates of the population for the UK, England and Wales, Scotland and Northern Ireland (see link to Excel file; we used mid-2019 population estimate for England and Wales only) |
| Japan | 2 | 126,529,100 | 0.2 | Axios, Police kill far more people in the U.S. than in most rich countries (2020) | 2018 | The World Bank, population data (2018 population estimate) |
| Iceland | 0 | 352,721 | 0 | NBC News, Iceland is a gun-loving country with no shooting murders since 2007 (2018) | Every year except 2013, when the police shot and killed someone for the first and only time. | The World Bank, population data (2018 population estimate) |
| Norway | 0 | 5,311,916 | 0 | Norwegian Bureau for the Investigation of Police Affairs, Annual Report 2018 (reporting no fatal shootings that year) | 2018 | The World Bank, population data (2018 population estimate) |
Footnotes
-
The data here reflect the number of police killings of civilians reported in each country. They do not account for the manner of death, as that data was not available for every country. The rates account for population only; they do not reflect differences in police-public contact rates nor the rate of gun ownership in each country, nor any other point of comparison that might partially explain these differences. The statistics presented here can only illuminate the vast differences between policing in the U.S. and in other wealthy nations, not explain them. ↩


