We analyze gender and racial disparities in traffic and street stops, including arrests, searches, and use of force that occurs during stops.
by Prison Policy Initiative,
May 14, 2019
Jails have been described as the criminal justice system’s “front door,” but jail incarceration typically begins with the police, with an arrest. Before any bail hearing, pretrial detention, prosecution, or sentencing, there is contact with the police. But despite their crucial role in the process, we know less about these police encounters than other stages of the criminal justice system.
In particular, the experiences of women and girls1 – especially Black women and other women of color – are lost in the national conversation about police practices. They are also largely invisible in the the data. But as Andrea Ritchie details in Invisible No More: Police Violence Against Black Women and Women of Color, women, too, are subject to racial profiling, use of excessive force, and any number of violations of their rights and dignity by police. In fact, women make up an increasing share of arrests and report much more use of force than they did twenty years ago. Yet while increasing recognition of women as a growing share of prison and jail populations has prompted facilities to adopt gender-responsive policies and practices, women’s rising share of arrests and other police contact has received less attention and policy response.
The current study
To shed more light on how women’s experiences at the front end of the criminal justice system differ from men’s experiences, we look at both arrest data and data about women’s other contacts with police. We first look at trends in arrest data from the FBI’s Uniform Crime Reporting (UCR) Program. To complement this data, we also examine differences in other police encounters reported in the Bureau of Justice Statistics (BJS) Contacts Between Police and the Public (CPP) reports, which are based on responses to the Police-Public Contact Survey (PPCS).
Critically, the UCR Program does not require police to report arrests by both sex and race/ethnicity, so that dataset offers no way to compare arrest trends of white, Black, and Latina women to each other or to their male counterparts. The PPCS partially fills that gap by including both sex and race/ethnicity of survey respondents; however, the BJS reports based on that survey do not engage this valuable intersectional data.2 The second section of this briefing includes our analysis of the most recent PPCS survey (conducted in 2015), to finally offer a view – from nationally representative data – of how women of different races and ethnicities experience police-initiated encounters differently than each other and men.
Part 1: Gender differences in interactions with police
Arrests: Women make up an increasingly large share of arrests
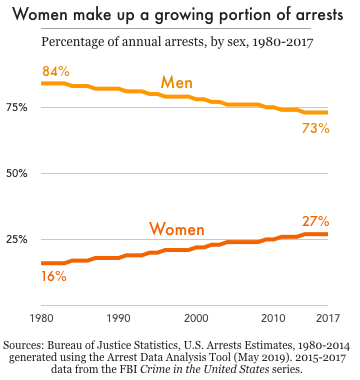 In the past two decades, the total number of arrests in the U.S. has dropped by more than 30 percent, from 15.3 million in 1997 to 10.6 million in 2017. However, this drop was mostly due to fewer arrests of men: the number of men arrested declined by 30.4 percent in that time, while the number of women arrested declined only 6.4 percent. As men’s arrest rates have fallen women’s arrest rates have remained fairly flat. As a result, women make up an increasingly large share of all arrests; as of 2017, women accounted for 27 percent of all arrests, up from 21 percent in 1997, and just 16 percent in 1980.3
An increase in arrests of women for drug offenses helps explain why women’s arrest rates have remained steady, even as crime rates have hit historic lows and men’s arrest rates have plummeted. Of the more than 2 million arrests of women in 2017, 13.9 percent were for drug abuse violations – second only to property crimes (15.8 percent), and far more frequent than arrests for violent crimes (3.8 percent). Over the past five years – while the country has been in the throes of the opioid epidemic – drug arrests have increased 6 percent among men, but almost 25 percent among women.4
Table 1. Total UCR arrests declined more dramatically among men than among women between 2013 and 2017, due in part to a much greater increase in arrests of women for drug violations. Source: Crime in the United States 2017 Table 35
|
Percent change over 5 years (2013-2017) |
|
Male |
Female |
| All arrests |
-8.7% |
-6.4% |
| Index violent crimes |
+1.8% |
+4.4% |
| Index property crimes |
-18.8% |
-24.9% |
| Drug abuse violations |
+6.1% |
+24.7% |
Other police-initiated contact: Women interact with police more than arrest statistics suggest
A key finding from the Contacts Between Police and the Public series is the true scale of women’s interactions with police, which is far greater than arrest numbers alone suggest. While arrests are sometimes used as a measure of the “first stage” of involvement with the criminal justice system, many encounters between the public and police do not result in arrest. This is especially true for women, who account for a much greater share of public-police interactions than they do actual arrests.
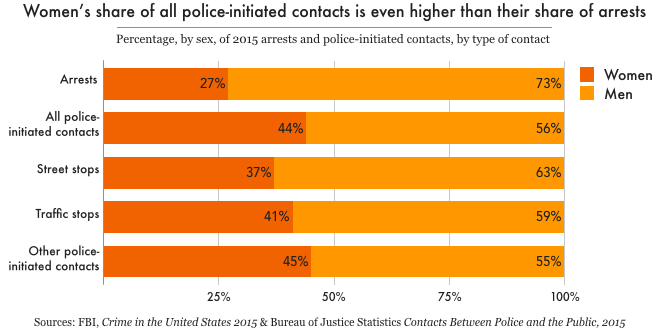
In 2015, there were about 2.1 million arrests – but about 12 million police-initiated contacts5 – with women ages 16 and over.6 That means that for every woman arrested, five more women were approached by police, either in a traffic stop, street stop, or in the execution of an arrest warrant. All police-initiated contacts are non-voluntary encounters, which are more likely than resident-initiated contacts (e.g. calling the police for help) to lead to arrest, further justice involvement, and other negative outcomes. The 2015 survey shows that women made up almost half (44 percent) of all police-initiated contacts, 41 percent of traffic stops (in which they were the drivers), and 36 percent of street stops, compared with 27 percent of all arrests. This is a critical point when assessing the need for gender-responsive policing policies and practices: basing an analysis solely on arrests would grossly underestimate the non-voluntary interactions women have with police.7
Use of force: Nearly doubled for men since 1999, but more than quadrupled among women
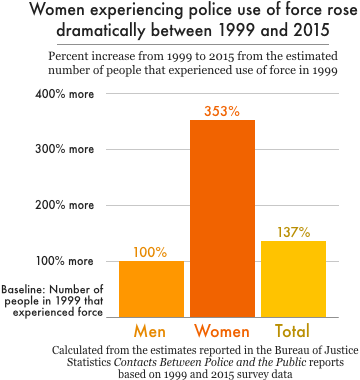 As with women’s share of arrests, women’s share of police encounters that involve the use or threat of force has increased significantly since 1999.8 That year, women made up just 13 percent of the approximately 422,000 people who experienced use of force during a police encounter. This percentage almost doubled by 2015, when women accounted for 25 percent of all people who experienced police use of force. Moreover, the total number of people experiencing police use of force more than doubled in that time, to 985,300 in 2015. But the increase in use of force was especially dramatic among women: the number of women experiencing police use of force in 2015 was 4.5 times (353%) the number experiencing force in 1999, up from 55,181 to 250,200. Meanwhile, the number of men experiencing police use of force doubled from 366,533 in 1999 to 735,100 in 2015.
Traffic stops: Stops declined more for men, and women make up a larger share of those searched during stops
The 2015 survey shows another noteworthy shift in the numbers of men and women stopped by police while driving. While the percentages of both men and women experiencing traffic stops declined since 1999, women saw a smaller decline in stops than men did. In 2015, 10 percent of male drivers were stopped (down from 12.5 percent in 1999) compared with 7 percent of female drivers (down from 8.2 percent). These changes may sound small as percentages, but the decline in the rate among women actually masks a 378,000 increase in total number of traffic stops of women since 1999, while men were stopped 451,000 fewer times than in 1999.9
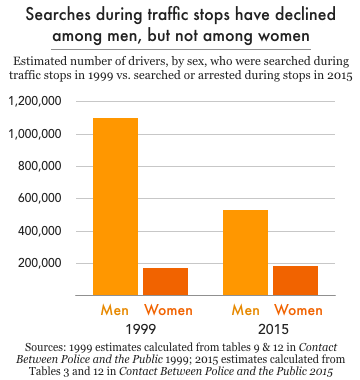 Women also make up a larger percentage of all people searched during traffic stops. In 1999, men who were stopped while driving were about four times as likely to be searched during the stop than women; by 2015, men were just twice as likely to be searched. The narrowing of this gap reflects a decline in searches of men; for women, the share of stops that resulted in search remained the same, at 2.3 percent. In 1999, police searched the driver or vehicle in 9.4 percent of stops of men, which amounts to over one million stops involving a search. In 2015, however, the percentage of stops involving male drivers that resulted in search or arrest dropped by half, to 4.7 percent – or over 500,000 stops. Female drivers, however, saw no change in their likelihood of search or arrest during a traffic stop.
Part 2: Race, Ethnicity, and Gender in Police Stops
Data from the Police-Public Contact Survey (PPCS) allow us to take a more intersectional view of women’s contact with police, going beyond gender differences to include racial and ethnic differences among men and women, too. Again, this is the only national data we are aware of that enables any intersectional analysis of civilian experiences with police, and the Bureau of Justice Statistics (BJS) does not attempt this analysis in its report on the survey’s results. That arrest data indicate racial disparities is well documented, but little is known – outside of individual stories – about how Black, Latinx, and white women experience police contact differently from each other and from their male counterparts.
Our analysis examines how race and gender, together, affect police-initiated stops, including arrests and use of force that occur during stops. It’s worth noting that police stops and arrests during these stops are relatively infrequent events, and that our findings are based on survey data from over 90,000 respondents, not the total U.S. population. That said, we find that the race, ethnicity, and gender affect policing outcomes differently depending on the context:
- Both race and gender affect the likelihood of a traffic stop.
- Race seems to matter more for men when it comes to street stops and more for women when it comes to arrests during a stop.
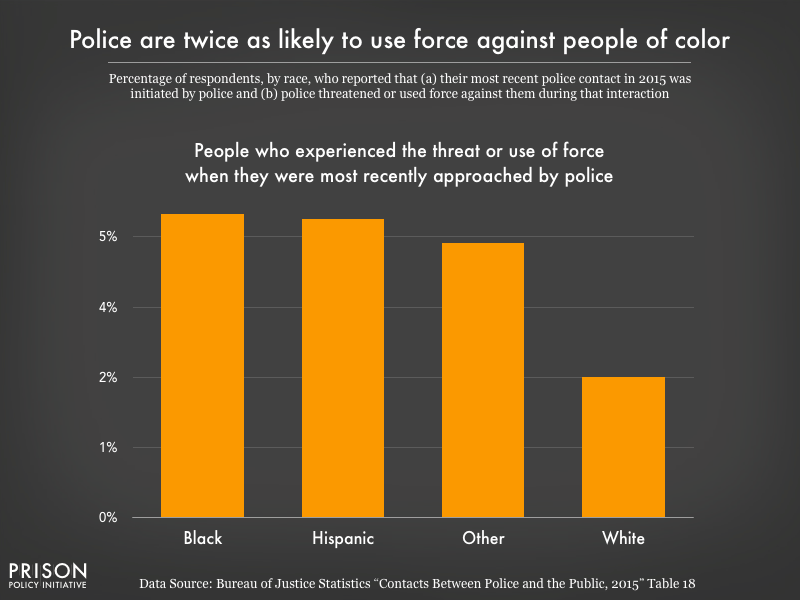
- Racial disparities are most apparent in use of force during a police-initiated stop, with Black and Latino men experiencing use of force more often than other groups, and Black women reporting similar use of force rates to white men.
Traffic stops: Black women are more likely than white or Latina women to be stopped
Both race and gender affect a person’s chances of being stopped by police while driving (excluding accidents or when they were passengers). Most broadly, the PPCS data shows that women were less likely than men to be stopped, and Black drivers were more likely to be stopped than white and Latinx drivers.10 More specifically, Black women were about 17 percent more likely to be in a police-initiated traffic stop than white women, and 34 percent more likely to be stopped than Latina women. Among men, Black drivers were about 12 percent more likely than white drivers – and 17 percent more likely than Latino drivers – to be stopped.
Table 2. See the Appendix for tables that show the statistical significance of differences between Black and Latina women compared to white women and all groups compared to white men.
| Women |
White |
7.1% |
|
Black |
8.3% |
|
Latina |
5.5% |
| Men |
White |
9.9% |
|
Black |
11.1% |
|
Latino |
9.2% |
These estimates are not adjusted for driving behavior, however, and given reported differences in driving patterns between demographic groups, it is likely that traffic stops of Black and Latina women per mile driven could be even higher compared to other groups than the survey data suggest.11
Street stops: Significant racial disparities among men, but not women
In contrast to traffic stops, the survey data on police-initiated street stops only showed significant racial disparities among men – not among women. Less than one percent of white, Black, and Latina women surveyed experienced a police-initiated street stop in 2015. However, the percentage of Black men who experienced a street stop (2.2 percent) was double that of white men (1 percent). A slightly greater portion of Latino men (1.2 percent) reported experiencing a street stop than white men, but this difference was not statistically significant.
Table 3. See the Appendix for tables that show the statistical significance of differences between Black and Latina women compared to white women and all groups compared to white men.
| Women |
White |
0.7% |
|
Black |
0.7% |
|
Latina |
0.5% |
| Men |
White |
1.0% |
|
Black |
2.2% |
|
Latino |
1.2% |
Arrests during stops: Significant racial disparities among women, but not men
Police-initiated traffic and street stops sometimes result in arrest, and the survey data show that Black women were at least as likely as white men to be arrested during a stop. White women, meanwhile, were about half as likely as white men to be arrested during a stop. Black women were arrested in 4.4 percent of police-initiated stops, which was roughly three times as often as white women (1.5 percent), and twice as often as Latinas (2.2 percent).
Among men, racial disparities in arrest-during-stop rates appear to be more related to the frequency of being stopped than the likelihood of being arrested if stopped. For women, on the other hand, racial disparities seem to be more related to what happens during the stop than whether they are stopped at all.
Table 4. See the Appendix for tables that show the statistical significance of differences between Black and Latina women compared to white women and all groups compared to white men.
| Women |
White |
1.5% |
|
Black |
4.4% |
|
Latina |
2.2% |
| Men |
White |
2.7% |
|
Black |
3.5% |
|
Latino |
4.2% |
Use of force during stops: Rates of Black women similar to white men; Black and Latino men most likely to experience force
About one percent of people surveyed indicated that they had experienced force or threat of force12 during a police-initiated stop, but use of force rates were higher for Black women than white or Latina women,13 and were highest among Black and Latino men. Black women actually experienced use of force during a stop about the same rate as white men, while white women were significantly less likely to experience use of force than white men. The marked gender disparity in reported use of force that is included in the BJS report Contacts Between Police and the Public, 2015 (2.7 percent for men versus 0.9 percent for women) masks the reality that these percentages are averages of racial and ethnic groups that are experiencing force at markedly different rates.
Table 5. See the Appendix for tables that show the statistical significance of differences between Black and Latina women compared to white women and all groups compared to white men.
| Women |
White |
0.3% |
|
Black |
0.9% |
|
Latina |
0.32% |
| Men |
White |
0.8% |
|
Black |
3.6% |
|
Latino |
2.5% |
Conclusion
As women become a more visible presence in our criminal justice system, it becomes increasingly urgent that we understand their experiences within it, both to better meet their needs and to enhance our analysis of how justice works (and doesn’t work) in the U.S. The policing of women, especially women of color, has received less attention than the policing of men; it’s even received less attention than the incarceration of women. Similarly, while correctional facilities are increasingly adopting gender-responsive policies and programs, there have been virtually no concerted efforts to create or implement trauma-informed or gender-responsive policing practices.
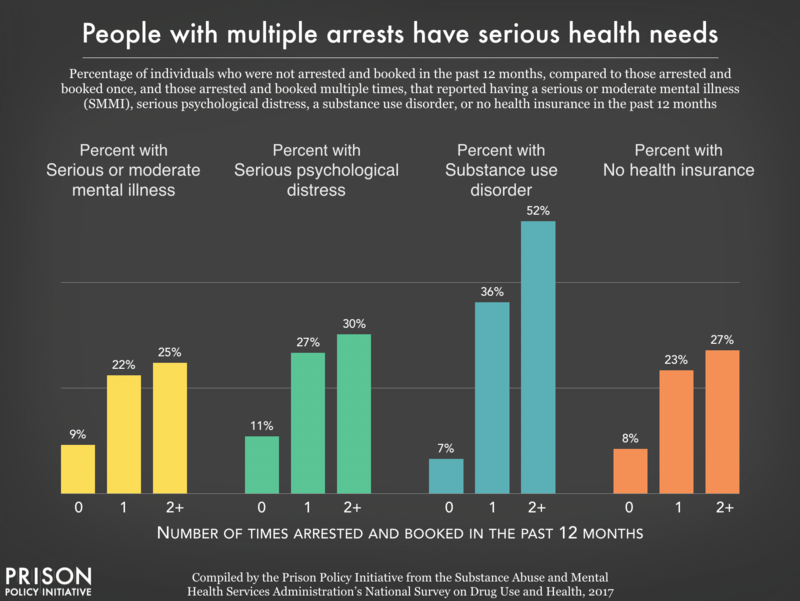
This oversight has serious consequences. Rates of sexual and physical abuse are high among justice-involved women – estimates range from half to over 90 percent – and are much higher than reported for men. Almost a third (31 percent) of women in jail have a current serious mental illness, which is over twice the rate among men in jail (14.5 percent) and over six times the rate among women in the general population (4.9 percent). With 12 million women per year experiencing police-initiated contacts – many of which involve searches, use of force, and other traumatizing experiences – it is critical that law enforcement take seriously the need for more female police officers,14 protocols, and trainings that can improve police-public interactions and reduce the harms to women.
Finally, the invisibility of Black women and other women of color in the national discourse about policing – even in the wake of high-profile tragedies like the arrest and jail death of Sandra Bland – means that the full scope of racial discrimination in policing is unknown, and certainly understated. Making policing more transparent, accountable, effective, and just will mean bringing the experiences of these women to light.
Data sources and methodology
Arrest data come from the FBI Uniform Crime Reporting Program (reported annually in the Crime in the United States series). Other police contact data are from the Bureau of Justice Statistics’ Police-Public Contact Survey (PPCS), most recently conducted in 2015 and published in 2018. The police contact data in Part 1 comes from the BJS reports based on the results of that survey, in the Contacts Between Police and the Public series. The analysis in Part 2 used the raw PPCS data, available from the National Archive of Criminal Justice Data (NACJD) here.
Using the PPCS data for the analysis in Part 2, respondents were coded into one of eight mutually exclusive sex-race categories: Black female, Black male, Latina (female), Latino (male), white female, white male, non-Hispanic other race female, and non-Hispanic other race male (the last two categories include multi-racial respondents, and results were not included in this report because of the small sample sizes and the disparate racial and ethnic categories they included.)
Our analysis focuses on non-voluntary, police-initiated stops. Therefore, the two types of police contacts included in the analysis were “stopped by police in public place (non-vehicle)” and “stopped by police while driving.” Types of police contacts excluded from the analysis were: “respondent in vehicle stopped by police” (i.e. not driving), “in traffic accident,” “other police stops or approaches,” “crime/non-crime emergencies,” and “seeking other help from police.”
“Arrests” in our analysis of the PPCS (in Part 2) refer to only those arrests that occurred during non-vehicle (street) stops, vehicle (traffic) stops, or either type of stop. Use of force refers to whether, during the encounter, the police officer did any of the following to the respondent: push, grab, kick, hit, spray with chemical or pepper spray, use an electroshock weapon (Taser), or point a gun at them.
We used Wald tests to determine whether there were statistically significant differences in average (mean) incidence of stops, arrests, and use of force between each sex-race category in comparison to two references categories: white women and white men. We used the weighting provided by the Bureau of Justice Statistics to approximate a nationally representative sample.
Acknowledgements: This briefing was a collaborative effort, but Wendy Sawyer served as the editor and created the graphics. We thank Public Welfare Foundation for their support of our research into the experiences of women who come into contact with the criminal justice system.
Footnotes
Appendix
Appendix Table 1 provides the data behind the graph titled “Women experiencing police use of force rose dramatically between 1999 and 2015.”
Use of force has increased overall, but most dramatically among women
Appendix Table 1.
|
1999 |
1999 |
2015 |
2015 |
1999 to 2015 |
|
Percentage of all people who experienced use of force during a police encounter |
Estimated number of people that experienced use of force during a police encounter |
Percentage of all people who experienced force during a police encounter |
Estimated number of people experienced use of force during a police encounter |
Percent increase in number of people experiencing police use of force |
| Men |
87% |
366,533 |
75% |
735,100 |
100% |
| Women |
13% |
55,181 |
25% |
250,200 |
353% |
| Total |
100% |
421,714 |
100% |
985,300 |
137% |
Expanded tables from Part 2
Reading these tables: There are two reference groups for looking at whether differences are statistically significant. First, we look at whether the differences in contact for Black and Latina women compared to white women are statistically significant. We then look at all sex-race groups compared to white men. The level of statistical significance is indicated for each difference, for example, “p<0.1%” indicates that a difference is statistically significant at the 90% confidence level. Where there isn’t a comparison made (for example, white women are not compared to themselves), the cell is marked with “–” and when there is no statistically significant difference between groups, this is indicated simply with “No.”
Percentage of drivers who experienced a vehicle stop in 2015
Appendix Table 2.
|
|
Percentage who experienced a vehicle stop |
Is difference from white women statistically significant? |
Is difference from white men statistically significant? |
| Women |
White |
7.1% |
— |
Yes (p<.01) |
|
Black |
8.3% |
Yes (p<.05) |
Yes (p<.01) |
|
Latina |
5.5% |
Yes (p<.01) |
Yes (p<.01) |
| Men |
White |
9.9% |
— |
— |
|
Black |
11.1% |
— |
Yes (p<.1) |
|
Latino |
9.2% |
— |
No |
Percentage who experienced a street stop in 2015
Appendix Table 3.
|
|
Percentage who experienced a street stop |
Is difference from white women statistically significant? |
Is difference from white men statistically significant? |
| Women |
White |
0.7% |
N/A |
Yes (p<.01) |
|
Black |
0.7% |
No |
Yes (p<.1) |
|
Latina |
0.5% |
No |
Yes (p<.01) |
| Men |
White |
1.0% |
— |
— |
|
Black |
2.2% |
— |
Yes (p<.01) |
|
Latino |
1.2% |
— |
No |
Percentage who were arrested during a stop in 2015
Appendix Table 4.
|
|
Percentage who were arrested during a stop |
Is difference from white women statistically significant? |
Is difference from white men statistically significant? |
| Women |
White |
1.5% |
— |
Yes (p<.01) |
|
Black |
4.4% |
Yes (p<.05) |
No |
|
Latina |
2.2% |
No |
No |
| Men |
White |
2.7% |
— |
— |
|
Black |
3.5% |
— |
No |
|
Latino |
4.2% |
— |
No |
Percentage who experienced force during a police-initiated stop in 2015
Appendix Table 5.
|
|
Percentage who experienced force during a stop |
Is difference from white women statistically significant? |
Is difference from white men statistically significant? |
| Women |
White |
0.3% |
— |
Yes (p<.05) |
|
Black |
0.9% |
No |
No |
|
Latina |
0.32% |
No |
No |
| Men |
White |
0.8% |
— |
— |
|
Black |
3.6% |
— |
Yes (p<.01) |
|
Latino |
2.5% |
— |
Yes (p<.05) |


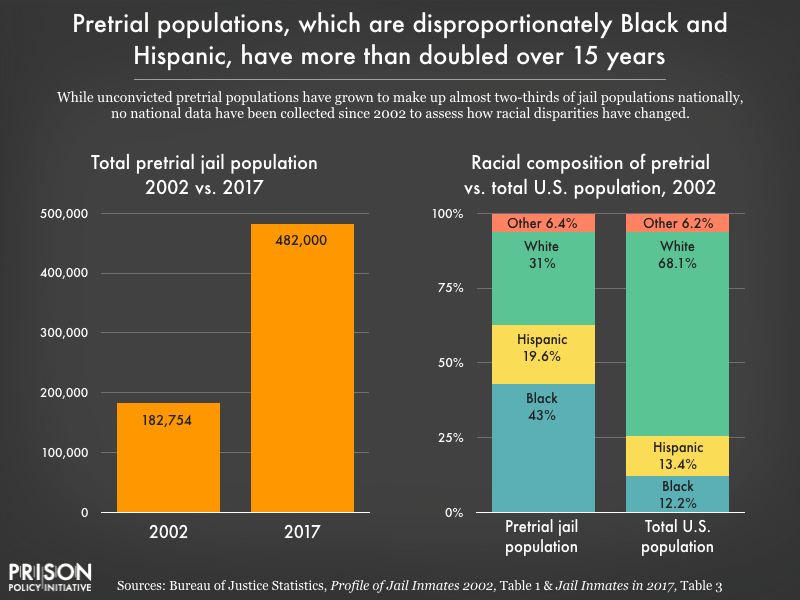 While pretrial jail populations have grown to make up almost two-thirds of jail populations nationally, and Black and Hispanic defendants were overrepresented in the 2002 population, no national data have been collected since then to assess how racial disparities may have changed.

 Women also make up a larger percentage of all people searched during traffic stops. In 1999, men who were stopped while driving were about four times as likely to be searched during the stop than women; by 2015, men were just twice as likely to be searched. The narrowing of this gap reflects a decline in searches of men; for women, the share of stops that resulted in search remained the same, at 2.3 percent. In 1999, police searched the driver or vehicle in 9.4 percent of stops of men, which amounts to over one million stops involving a search. In 2015, however, the percentage of stops involving male drivers that resulted in search or arrest dropped by half, to 4.7 percent – or over 500,000 stops. Female drivers, however, saw no change in their likelihood of search or arrest during a traffic stop.


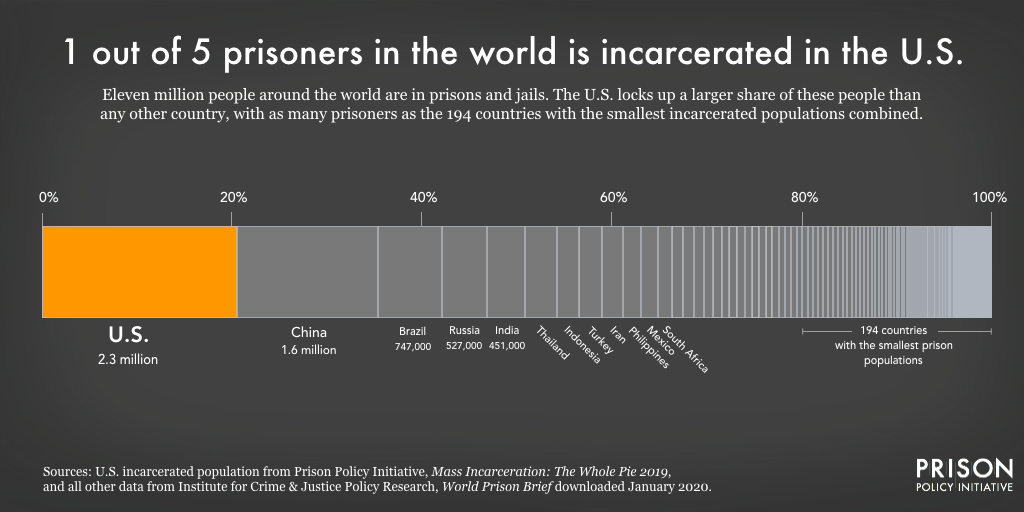
 The 2.3 million incarcerated people in the United States are, of course, excluded from the labor force and therefore are not reflected in analyses of labor force participation. Including them would make the portion of the workforce that is involved in the mass incarceration system even larger.
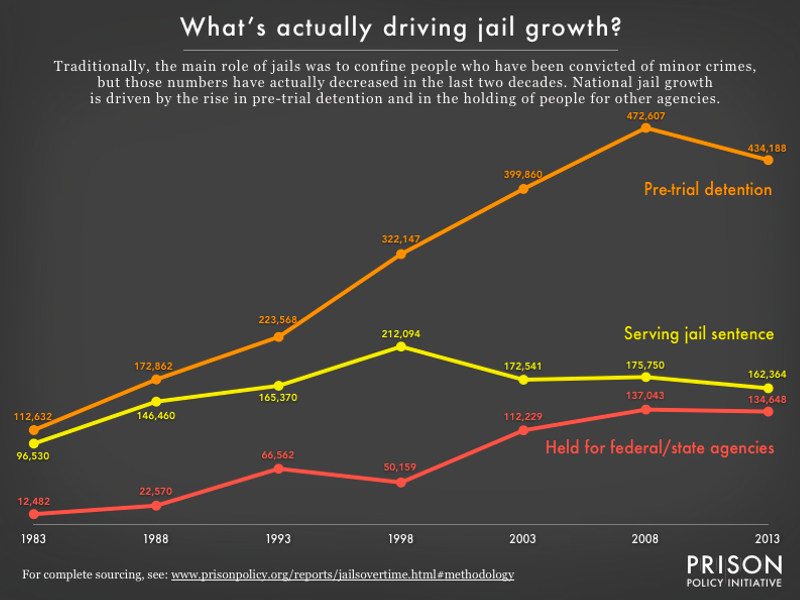 Figure 1. Most state policymakers are not tracking jails in the first place, and the jails’ frequent practice of renting cells to other agencies makes it difficult to draw conclusions from the little data that is available. This report offers a new analysis of federal data to offer a state-by-state view of how jails are being used and we find that, even more than previous research has implied, pre-trial populations are driving “traditional jail” growth. The data behind this graph is in
 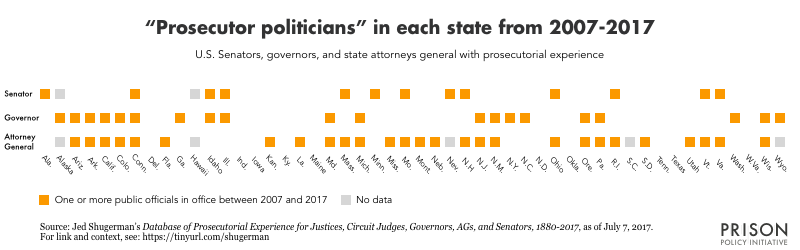 In at least 38 states, a senator, governor, and/or attorney general holding office in the past 10 years was once a prosecutor. This chart may understate the prevalence of these “prosecutor politicians,” since the source is a work in progress and has no data for some positions in five states as of July 7, 2017, and does not include changes in all offices after January 2017.


