New report finds that 12 states and Washington D.C. still automatically suspend driver’s licenses for drug offenses unrelated to driving
A relic of the War on Drugs pressures states to automatically suspend the driver’s license of anyone convicted of a drug offense, even if the offense did not involve driving. This practice hits the poor the hardest.
December 12, 2016
FOR IMMEDIATE RELEASE
Contact:,
Joshua Aiken
jaiken [at] prisonpolicy.org
(413) 527-0845
Easthampton, MA — A 26-year-old federal law passed at the height of the War on Drugs pressures states to automatically suspend the driver’s license of anyone convicted of a drug offense, even if the drug offense did not involve driving. A new report by the non-profit non-partisan Prison Policy Initiative tracks the growing state rejection of this federal policy, and shines a light on the states that continue to implement this outdated and ineffective law. These stragglers make it harder for people with drug convictions to meet economic needs, familial obligations, and even court requirements, all of which require driving.
The report, Reinstating Common Sense: How driver’s licenses suspensions for drug offenses unrelated to driving are falling out of favor provides, for the first time, a national overview of license suspension statutes. “While the majority of states have opted-out of the federal law,” said Joshua Aiken, author of the report, “12 states and Washington D.C. have continued to hurt their own citizens with these needless license suspensions.”
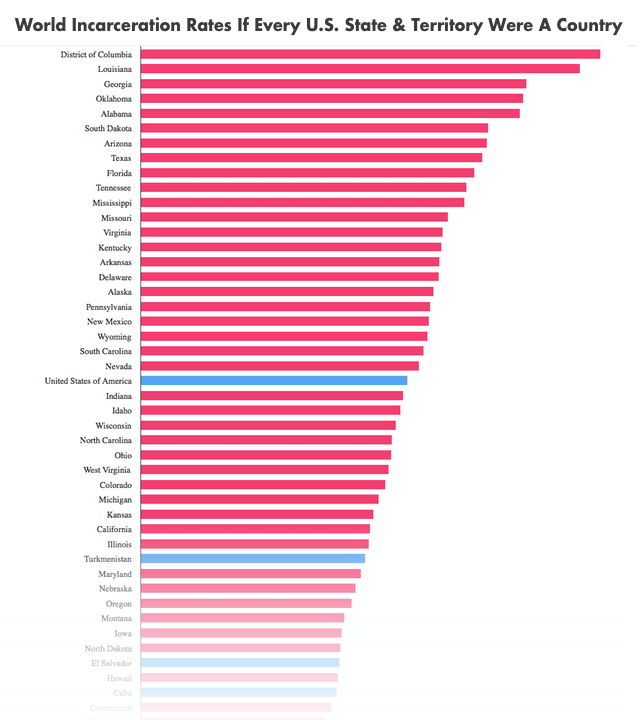
Currently, Alabama, Arkansas, Florida, Iowa, Michigan, Mississippi, New Jersey, New York, Pennsylvania, Texas, Utah, Virginia, and Washington D.C. automatically suspend driver’s licenses for non-driving drug offenses. “These drug suspension laws are one of the most punitive and unnecessary side effects of the War on Drugs,” notes Aiken, the Policy Fellow at the Prison Policy Initiative. “The report finds that the burden of these suspensions fall most heavily on low-income people and people of color.”
The report finds that driver’s license suspensions can prevent people with past drug convictions from meeting their civil and familial responsibilities. “There is no evidence that these license suspensions deter crime, but the evidence is clear that these laws harm our society,” says Aiken.
Driver’s license suspensions have serious consequences for drivers and the states. 86% of Americans rely on a motor vehicle to get to work, so a suspended driver’s license can often limit employment opportunities. The report shows that in many low-income communities impacted by non-driving drug violations, the vast majority of jobs cannot be reasonably accessed using public transportation. In one study, 45% of respondents lost their job after their license was suspended. 88% of people reported decreased income. The report also discusses the unintended fiscal burden that the federal law places on state governments.
The number of states that automatically suspend driver’s licenses for drug convictions is shrinking rapidly. In just the last three years, five states (Indiana, Delaware, Georgia, Massachusetts, and Ohio) have ended the practice.
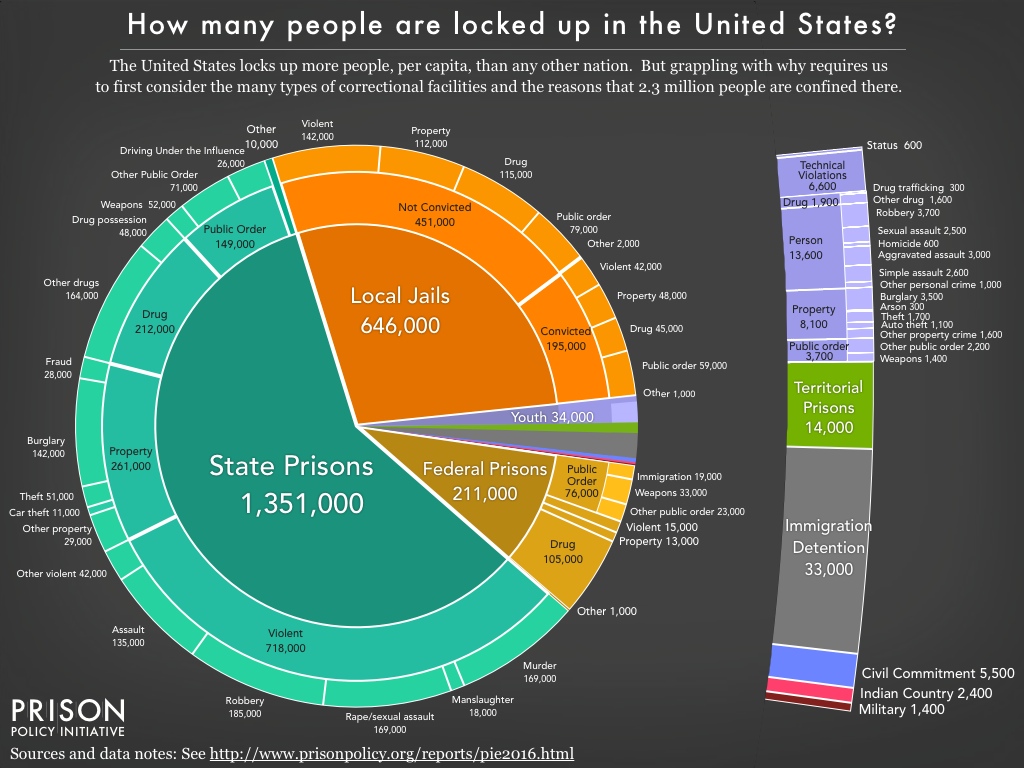
Based in Easthampton, Massachusetts, the Prison Policy Initiative was founded in 2001 to expose the broader harm of mass criminalization and spark advocacy campaigns to create a more just society. The organization is most well-known for sparking the movement to end prison gerrymandering and for its big picture data visualization “Mass Incarceration: The Whole Pie.” The organization’s 2014 report “Suspending Common Sense in Massachusetts: Driver's license suspensions for drug offenses unrelated to driving” led to reform in that state.