Prison systems have shown they are unprepared and unwilling to care for an aging prison population - whether by improving healthcare or expanding compassionate release.
by Emily Widra,
February 13, 2020
A newer article about state prison deaths with data from 2018 is now available. We suggest using that article instead of this one.
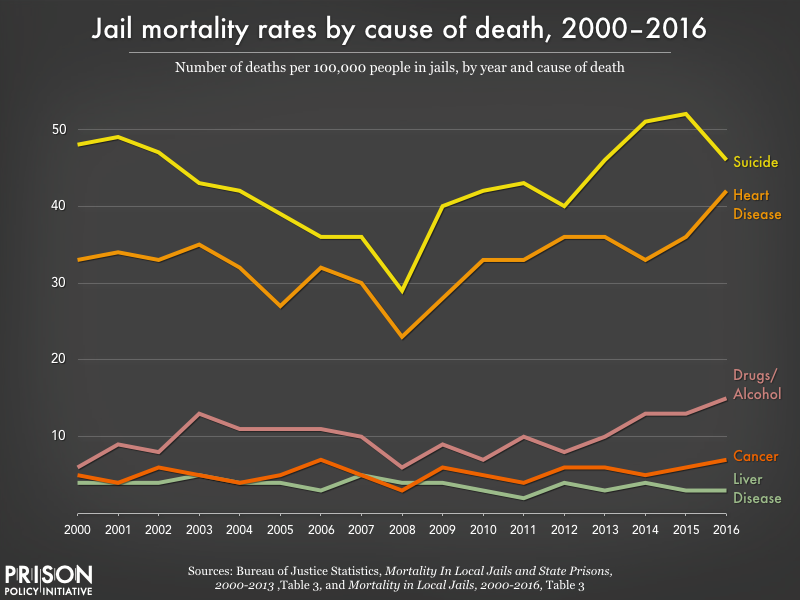
A new Bureau of Justice Statistics report released yesterday shows that from 2015 to 2016, the number of deaths in U.S. state prisons increased from 296 to 303 per 100,000 people. What accounts for these deaths?
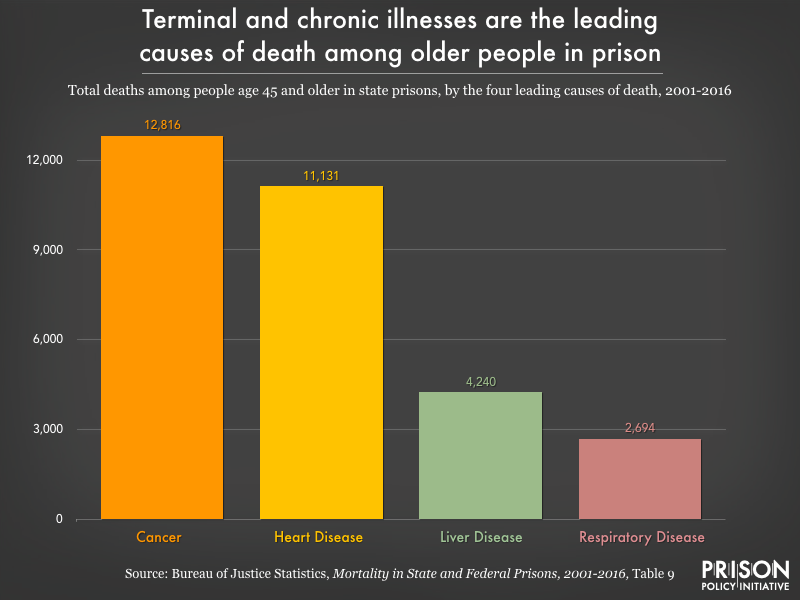
Chronic illnesses continue to be the leading cause of death in state prisons, according to the report — far outpacing drug- and alcohol-related deaths, accidents, suicides, and homicides combined. The number of deaths from chronic illness — including a growing number of deaths from cancer in prison, at a time when overall deaths from cancer are going down — is a testament to the extremely poor healthcare incarcerated people receive. It also highlights the ways that prisons are unable and unwilling to care for their elderly residents, who comprise a growing share of the prison population.
Sources: Bureau of Justice Statistics, Mortality in State and Federal Prisons, 2001-2016 and Mortality in Local Jails and State Prisons, 2000-2013
Prison accelerates aging and increases the risk of early death from illness
As we’ve written about previously, each year of time served in prison takes two years off an individual’s life expectancy. Evidence suggests that the reason for this is that incarcerated people experience “accelerated physiological aging.” Prison ages incarcerated people by 10 to 15 years on average, which in turn makes them more vulnerable to chronic health conditions earlier in life than would be expected. As we see in the new prison mortality data, these chronic conditions – cancer, heart disease, liver disease, and respiratory diseases – are among the most frequent causes of death in state prisons.
Researchers have identified a number of reasons why prisons increase the risk of illness and early death (for a concise review, see Novisky 2018). These include, but are not limited to: varying degrees of health literacy and capital among incarcerated people; constraints on transportation to necessary appointments outside the prison; and inadequate healthcare in prisons due to insufficient resources, limited medical providers, restrictions on medication administration, and treatment bias because of stigmas attached to incarcerated patients. And – particularly for older or otherwise more vulnerable people – punitive practices like solitary confinement compound existing physical and mental health concerns and risks.
Prisons are not prepared for the health problems and mortality of their aging populations
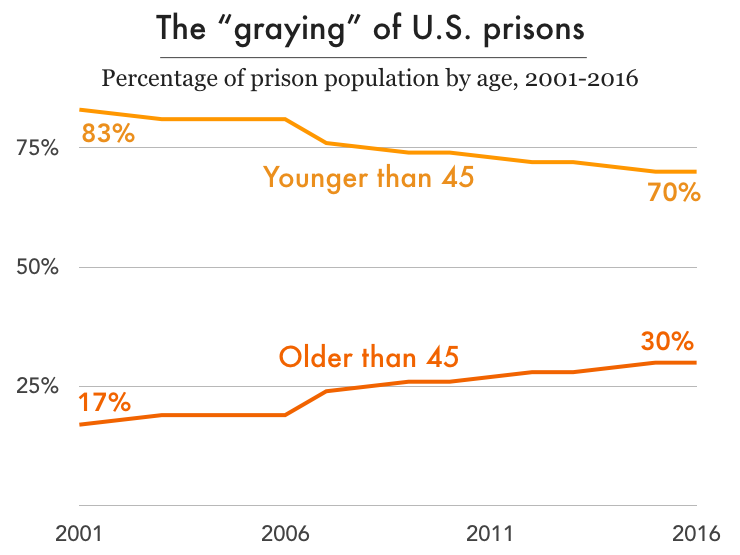
Nationally, the imprisonment rate for people over 45 years old has more than doubled over the past three decades while the rate for those under 45 has actually dropped slightly. Mortality has become an urgent issue in places like the Louisiana State Penitentiary (“Angola”), where the average age is over 40 and the average sentence is longer than 90 years. With thousands of aging adults facing the prospect of dying in prison in the coming years, how are prison systems preparing to handle the increased physical and psychological needs of the graying prison population? In short, they’re not preparing at all.
While the country incarcerates more older adults for longer sentences, prison systems have not adapted to the changing needs of the prison population. Despite examples of increased spending on prison healthcare, access to necessary healthcare remains inadequate. There are frequently lapses between prescription refills, as well as unmet dietary needs and unaffordable medical copays. We know that copays jeopardize the health of incarcerated populations, staff, and the public because when healthcare is unaffordable, sick people avoid the doctor, and diseases are likely to worsen and require more aggressive care. Yet most states still require copays to see medical staff behind bars. And even when incarcerated people do see medical staff, they face long waits: older adults in federal prisons wait an average of 114 days to see needed medical specialists in cardiology and pulmonology, which also puts them at risk for late diagnoses or no treatment at all.
Recent research from Prof. Meghan Novisky reveals how older incarcerated adults cope with the difficulties of accessing healthcare in prison. In her extensive qualitative study, Novisky finds that older incarcerated adults must rely on their networks – both in and outside of prison – and strategically use the limited resources available to them. Specifically, these older adults try to access health information from outside, from the prison library, and from other incarcerated people with medical backgrounds; they use the commissary and access to the kitchen to supplement the insufficient diet provided them; and they doggedly advocate for themselves with providers and through the grievance process, all in an effort to get their basic health needs met.
Beyond individual health outcomes, the financial burdens of the aging prison population can’t be overlooked: care for this population costs 2-3 times more than for their younger counterparts. The federal prison system reports spending 5 times more on medical care and 14 times more on medications per inmate in facilities with higher percentages of older inmates.
Bringing a measure of dignity to death in prison: Hospice programs
As the recent BJS report reminds us, mortality rates in prison are unlikely to slow, given the aging population and systemic healthcare problems. This reality begs the question: what does mortality behind bars actually look like for the people who are dying?
Currently, less than 4% of prisons have hospice programs. Most prisons and jails were not built with any consideration for the fact that they would house people dying of cancer, pulmonary diseases, liver failure, and dementia. But hospice has become one of the few humane attempts to address mortality in prison.
Hospice care involves a team of providers who care for people with life-limiting illnesses and their families with medical care, pain management, and emotional and spiritual support. The hospice model of care, based on a belief that every person has the right to die pain-free and with dignity, has made strides to fit into what Fleury-Steiner (2008) calls “the prison’s ‘natural environment’ of aggressive discipline and custody.”
“When speaking on end-of-life care, no one should be excluded. Dying with dignity is an essential component of our humanity and needs to be extended even into the shadows of our society.”
– Marvin Mutch, Human Prison Hospice Project
About half of these prison hospice programs use incarcerated people as volunteers or as employed (and underpaid) caregivers. They become a crucial part of the care team, given that medical staff are often spread thin and correctional officers don’t have the necessary training to provide end-of-life care. (Incarcerated volunteers who work in hospice do receive appropriate training.)
While having access to hospice care in prison is certainly better than dying there without such care, dying in prison is a bleak scenario no matter what. One hospice patient at the California Medical Facility expressed this succinctly to a New York Times journalist entering the hospice unit, greeting her with, “Welcome to death row.”
The alternative: Compassionate release
For terminally ill incarcerated people, the other option is compassionate release: the early release of individuals who are facing imminent death and do not pose a threat to the public. Compassionate release was created by Congress to release incarcerated people “when it becomes ‘inequitable’ to keep them in prison any longer.” This option allows incarcerated people to seek hospice care outside of prison, a chance for dignified death, and time with family. Moreover, it has the practical benefit of reducing medical costs to the state and federal government.
However, this more humane release mechanism is extraordinarily underutilized, for a number of bad reasons: narrow eligibility requirements, a burdensome application process, protracted hearings, third party veto power, a lack of formal timelines, reluctance of providers to provide a prognosis, lack of medial knowledge of parole board members, and no systematic procedures for tracking applications and decisions. According to The New York Times, between 2013 and 2017, the federal Bureau of Prisons approved only 6% of the 5,400 compassionate release applications received; meanwhile, 266 other applicants died in prison. Their analysis of federal prison data shows that it takes over six months, on average, for an incarcerated person to receive an answer on their compassionate release application from the BOP. In one tragic example, prison officials denied an application for someone because the BOP determined he had more than 18 months to live, despite prison doctors’ prognosis of less than six months. Two days after receiving the denial, he died. With a timeline like that, it is no wonder that the number of older adults dying behind bars continues to grow.


