Help us uncover the U.S. incarceration crisis
Can you make a gift today to fuel the movement to end mass incarceration?
by Peter Wagner, November 30, 2015
The Prison Policy Initiative has celebrated some huge victories recently: historic prison and jail phone industry regulation, making strides towards a national end to prison gerrymandering, and reversing bans on in-person family visitation in Oregon and Texas jails.
Here at the Prison Policy Initiative, we know that in order to keep winning victories for fairness and justice, the movement to end mass incarceration needs compelling and up-to-date information about the U.S. incarceration crisis. This year, we’ve continued to fill critical gaps in the movement’s knowledge with exciting reports that:
- Show that each state’s rate of incarcerating women is far out of step with the rest of the world. Compared to other countries, most U.S. states lock up proportionally more women than any other country in the world.
- Uncover the data to show that even before their incarceration, the people in prison are much poorer than Americans of similar ages, race/ethnicity and gender. This report was also the first to provide the pre-incarceration incomes of women in prison.
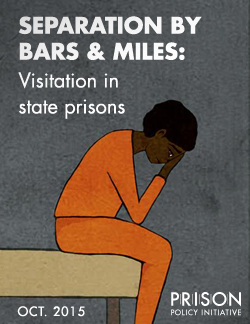
- Reframe the entire debate about visitation and reentry with new data that demonstrates that incarcerating people far from home actively discourages family visits.
- Provide critical new data to demonstrate the degree to which mass incarceration transfers people of color to predominantly white communities.
- Demonstrate that jails, not just prisons, matter in policy discussions because 11 million people cycle through jails, and the dramatic growth in the jail population is the direct result of policies that increasingly detain people awaiting trial.
These reports were made possible by the generosity of a small group of individual donors. Can you make a gift today so we can both advance specific campaigns for justice and produce critical research?
To encourage you to give generously, some of our existing donors will match the first $19,000 that we receive in this appeal.
We thank you for standing by our side in the fight for fairer and safer communities for everyone.

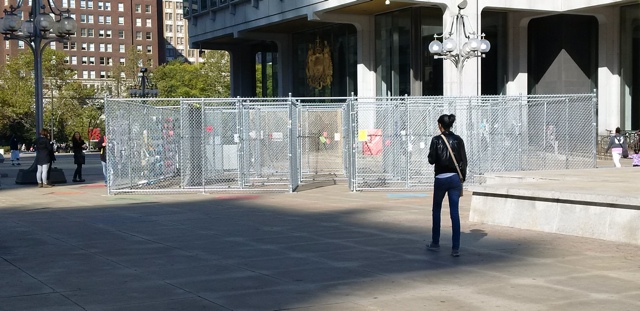
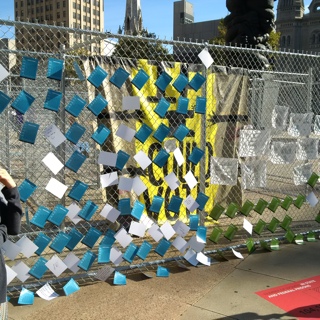
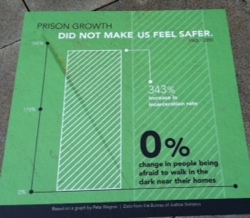 For the month of October, some of our research is hanging in a public art installation about mass incarceration just outside of Philadelphia City Hall. The central element of artist Sam Durant’s installation “Labyrinth”, designed in collaboration with men incarcerated at Graterford State prison, is a large maze made of chain-link fencing.