April 15-17, 2025: Sarah Staudt, our Director of Policy and Advocacy, will be attending the MacArthur Safety and Justice Challenge Network Meeting from April 15-17 in Chicago. Drop her a line if you’d like to meet up!
Not near you? Invite us to your city, college or organization.
The carceral environment can be inherently damaging to mental health by removing people from society and eliminating meaning and purpose from their lives. On top of that, the appalling conditions common in prisons and jails — such as overcrowding, solitary confinement, and routine exposure to violence — can have further negative effects. Researchers have even theorized that incarceration can lead to “Post-Incarceration Syndrome,” a syndrome similar to PTSD, meaning that even after serving their official sentences, many people continue to suffer the mental effects.
Incarceration itself is inherently harmful to people’s health
Many of the defining features of incarceration are linked to negative mental health outcomes, including disconnection from family, loss of autonomy, boredom and lack of purpose, and unpredictability of surroundings. Prof. Craig Haney, an expert on the psychological effects of imprisonment and prison isolation, explains, “At the very least, prison is painful, and incarcerated persons often suffer long-term consequences from having been subjected to pain, deprivation, and extremely atypical patterns and norms of living and interacting with others.” And as Dr. Seymour L. Halleck has observed, “The prison environment is almost diabolically conceived to force the offender to experience the pangs of what many psychiatrists would describe as mental illness.”
Family disconnection
By its very nature, incarceration separates people from their social networks and loved ones. In 2018, when researchers at the University of Georgia analyzed the relationship between prison conditions and mental health in 214 state prisons, they found that people incarcerated more than 50 miles from home were more likely to experience depression. This isn’t surprising: Psychologists have long known that people with social support and positive family relationships tend to have better psychological wellbeing.
Similarly, in a 2015 review of the research on the impact of prisons on mental health, separation from family and friends emerged as a major stressor for incarcerated people; it was also associated with psychological distress. In fact, many people described this separation as the most challenging aspect of their incarceration. Goomany and Dickinson, who authored the review, found that even when incarcerated people receive visits from family members, the prison environment makes it harder for them to connect. Correctional facilities are built and operate around the goal of security, and these “regulations and security measures inevitably impact on the relationships between prisoners, their families, and children.”
Separation from children can be especially distressing for incarcerated women. As one 1998 article in Behavioral Sciences & the Law noted, “Separation from children is one of the most stressful conditions of incarceration for women and is associated with feelings of guilt, anxiety, and fear of losing mother-child attachment.” A 2005 study found that “most mothers described an intense focus on feelings of distress, depression, or guilt.” One mother in that study explained her feelings: “All I’d do was cry. It is horrible being away from your kids, especially when they the only people who care for you.” Another said, “I was very hurt, depressed, crying constantly, and worried.” The study noted that 6 percent of the mothers interviewed described themselves as suicidal early in their incarceration; as their separation from their children continued, 22% “continued to focus intensely on their distress.”
Loss of autonomy & lack of purpose
Incarcerated people have virtually no control over their day-to-day lives, including when they wake up, what they eat, what their jobs are, and when they have access to recreation. This can lead to feelings of dependence and helplessness. The three main studies included in Goomany and Dickinson’s review all concluded that this loss of autonomy harms mental health. Once again, this makes sense; we know people feel better and have better mental health outcomes when they have control over their surroundings.
Similarly, incarceration is often characterized by boredom, monotony, and lack of stimulation. Many incarcerated people have limited access to education, job training, and other programming that can fill their time and become a meaningful part of their lives. In a 2003 study of incarcerated people in England, participantsreported that lack of activity and mental stimulation leads to extreme stress, anger, and frustration. Some reported using unhealthy coping mechanisms to manage boredom, including substance abuse. The 2018 University of Georgia study mentioned earlier also found that people in prisons with limited access to work assignments experienced higher levels of depression. Once again, this fits with psychological research that shows meaninglessness and a lack of purpose can lead to symptoms of anxiety, depression, and hopelessness.
Unpredictability
These feelings of anxiety and depression can be exacerbated by the unpredictable nature of the carceral environment. As the Behavioral Sciences & the Law article mentioned above explains, there are numerous rules in prisons and jails that do not exist in the free world — many of which are ambiguous and only enforced erratically. The authors note that “institutional rules are enforced selectively, depending on factors such as inmate-staff relationships, staff member’s mood, the severity of the rule violation, and the convenience of rule enforcement.” This lack of clarity and predictability can contribute to feelings of uncertainty and stress.
Cruel conditions make a negative environment worse
Even a relatively “humane” prison or jail can contribute to negative mental health outcomes for the reasons outlined above. But the reality is that poor conditions in prisons and jails cause significant additional suffering and trauma. As the World Health Organization explains, “There are factors in many prisons that have negative effects on mental health, including: overcrowding, various forms of violence, enforced solitude or conversely, lack of privacy, lack of meaningful activity, isolation from social networks, insecurity about future prospects (work, relationships, etc.), and inadequate health services, especially mental health services.” This list of mentally damaging conditions accurately describes most U.S. jails and prisons.
Overcrowding & punitiveness
Many jails and prisons throughout the country are overcrowded, which makes the inherently negative carceral environment even worse. Overcrowding often means more time in cell, less privacy, less access to mental and physical healthcare, and fewer opportunities to participate in programming and work assignments. Correctional administrators may respond to overcrowding by forgoing screening and monitoring of vulnerable people. A 2005 study found that overcrowding is highly correlated with prison suicide.
The 2018 study from the University of Georgia similarly found that overcrowding and punitiveness are correlated with depression and hostility. The researchers noted that punitive environments “likely set inmates on edge, making them overly hostile or even depressed.”
Solitary confinement
Being put in solitary confinement, which is a common practice in many prisons and jails, is especially harmful to mental health. As we discussed in a briefing last year, the stress caused by spending time in solitary confinement can lead to permanent changes to people’s brains and personalities. Depriving humans — who are naturally social beings — of the ability to interact with others can cause ‘social pain,’ which affects the brain in the same way as physical pain. A 2000 study found that people were significantly more likely to develop psychiatric disorders while in solitary confinement than while housed in non-solitary units.
Trauma from experiencing and witnessing violence
Prisons and jails are extremely violent places. People often experience traumatic verbal or physical assaults and dehumanization at the hands of correctional officers. And the various stressors in a carceral environment also increase the chances of violence between incarcerated people. Researchers in a 2009 study found that experiencing violence during incarceration was significantly related to “aggressive and antisocial behavioral tendencies as well as emotional distress.”
In fact, even witnessing violence behind bars can be traumatizing, as we have discussed previously. Exposure to violence in prisons and jails can exacerbate existing mental health disorders or even lead to the development of post-traumatic stress symptoms like anxiety, depression, avoidance, hypersensitivity, hypervigilance, suicidality, flashbacks, and difficulty with emotional regulation.
Lasting effects
Some researchers suggest that the trauma people experience behind bars can lead to Post-Incarceration Syndrome, a syndrome that shares characteristics with PTSD. A 2013 study of 25 released lifers found that participants experienced a specific cluster of mental health symptoms, including institutionalized personality traits (like distrusting others, difficulty maintaining relationships, and problems making decisions), social-sensory disorientation (issues with spatial reasoning and difficulty with social interactions), and social and temporal alienation (the feeling of not belonging in social settings).
Similarly, a 2019 literature review found that incarcerated people experience high rates of Potentially Traumatic Events, often shortened to PTEs. The review further revealed that experiencing PTEs behind bars was strongly correlated with rates of PTSD upon release.
We often think of incarceration as something people live through and from which they can ultimately be released. But the reality is that time spent in prisons and jails can create a host of collateral consequences that haunt individuals even after release. As the research shows, incarceration can trigger and worsen symptoms of mental illness — and those effects can last long after someone leaves the prison gates.
This Mother’s Day — as the COVID-19 pandemic continues to put people behind bars at serious risk — nearly 150,000 incarcerated mothers will spend the day apart from their children.1Over half (58%) of all women in U.S. prisons are mothers, as are 80% of women in jails, including many who are incarcerated awaiting trial simply because they can’t afford bail.
Most of these women are incarcerated for non-violent offenses. Most are also the primary caretakers of their children, meaning that punishing them with incarceration tears their children away from a vital source of support. And these numbers don’t cover the many women who will become mothers while locked up this year: An estimated 58,000 people every year are pregnant when they enter local jails or prisons.2
Most incarcerated mothers are locked up in local jails
Women incarcerated in the U.S. are disproportionately in jails rather than prisons. As we’ve written before, even a short jail stay can be devastating, especially when it separates a mother from children who depend on her.
80% of the women who will go to jail this year are mothers — including 55,000 women who are pregnant when they are admitted. Beyond having to leave their children in someone else’s care, these women will be impacted by the brutal side effects of going to jail: Aggravation of mental health problems, a greater risk of suicide, and a much higher likelihood of ending up homeless or deprived of essential financial benefits.
How incarceration — and life after incarceration — hurts mothers and their children
Women who are pregnant when they are locked up have to contend with a healthcare system that frequently neglects and abuses patients. In a 50-state survey of state prison systems’ healthcare policies, we found that many states fail to meet even basic standards of care for expectant mothers, like providing screening and treatment for high-risk pregnancies. In local jails, where tens of thousands of pregnant women will spend time this year, healthcare is often even worse (across the board) than in state or federal prisons.
More challenges await incarcerated mothers and pregnant women when they are released from jail or prison. Formerly incarcerated women experience extremely high rates of food insecurity, according to a 2019 study. And as we previously reported, the 1.9 million women released from prisons and jails every year have high rates of poverty, unemployment, and homelessness, confirming what many advocates already knew: that there is a shortage of agencies and organizations able and willing to help formerly incarcerated women restart their lives.
It’s time we recognized that when we put women in jail, we inflict potentially irreparable damage to their families. Most women who are incarcerated would be better served though alternatives in their communities.
So would their kids. Keeping parents out of jail and prison is critical to protect children from the known harms of parental incarceration, including:
Traumatic loss marked with feelings of social stigma and shame and trauma-related stress
More mental and physical health problems later in life
Incarceration punishes more than just individuals; entire families suffer the effects long after a sentence ends. Mother’s Day reminds us again that people behind bars are not nameless “offenders,” but beloved family members and friends whose presence — and absence — matters.
Footnotes
Based on the most recent (2016) Survey of Prison Inmates, the Bureau of Justice Statistics (BJS) estimates 57,700 women in state and federal prisons are parents of minor children. We calculated approximately 88,400 pregnant women in local jails based on the Vera Institute of Justice report’s estimate that 80% of women in jail are mothers, and the BJS reports 110,500 women in local jails at mid-year 2019 (80% of 110,500 is 88,400). While jail populations dropped quite dramatically in the early months of the COVID-19 pandemic, we opted to use the more typical 2019 jail population for our estimate because other data sources show that jail populations have largely rebounded since mid-year 2020. ↩
These estimates are based on the following percentages, reported in the linked sources: 4% of women admitted to state and federal prisons annually, and 3% of women admitted to local jails, are pregnant at the time of admission. The estimated 55,000 women admitted to jails while pregnant each year is based on the number of women over age 18 arrested in 2017 (over 1.7 million women), as reported in the original source. The estimated number of pregnant women admitted to state and federal prisons in a year is based on the total number of female admissions in 2019 (73,586) as reported by the Bureau of Justice Statistics CSAT — Prisoners tool. The one-day prevalence of pregnancy at year-end 2016 (as opposed to the share of annual admissions) was 0.6% in prisons and 3.5% in local jails. ↩
Why do some places incarcerate people at much higher rates than others? We considered this question in 2019, when we compared prison incarceration rates across U.S. counties, finding a wide range that loosely correlated to the respective state imprisonment rates. Now, we can do the same for jail incarceration rates. While it’s difficult to find jail incarceration data at the city level, this data is available by county in the Vera Institute of Justice’s Incarceration Trends Database. Using this database, we considered 63 highly populated cities,1 and calculated the overall jail incarceration rate and pretrial detention rate of each city’s surrounding county.2 We found that, like prison incarceration rates, jail detention rates vary significantly. But unlike our study of prison incarceration rates, we could find no obvious explanation: neither violent crime rates, local police budgets, nor local jail budgets explained the large differences from city to city. These variations mean that your chances of being put in jail can depend on something as arbitrary as the city you live in.
Jail and pretrial detention rates are important for showing just how deeply mass incarceration is affecting your local community. Jails are the “front door” of the criminal justice system. In 2019 alone, there were more than 10.3 million admissions into U.S. jails. Black and low-income people are disproportionately affected by repeat arrests, and are more likely to be held pretrial simply because they cannot afford bail, perpetuating the cycle of poverty and incarceration. Even short stays in jail can have a major impact on people’s livelihoods, threatening their ability to keep their jobs and housing, and straining familial relationships. This harm is unnecessary, though; as our research has shown, reforms that allow more people to return home pretrial were not associated with rising crime rates in the states, cities, and counties we analyzed.
Rates are per 100,000 county residents. In its database, the Vera Institute of Justice presents rates for counties per 100,000 residents aged 15-64. For our analysis, we recalculated the rates using the counties’ total populations, using population counts from the Vera Institute of Justice’s downloadable dataset, to make the figures comparable to other criminal justice data. The data exclude people held in jails on behalf of federal authorities, such as U.S. Immigration and Customs Enforcement and U.S. Marshals Service.
City
State
County
Jail detention rate (per 100,000 county residents)
Pretrial detention rate (per 100,000 county residents)
Memphis
Tenn.
Shelby County
491
245
New Orleans
La.
Orleans Parish
397
301
St. Louis
Mo.
None
393
395
Philadelphia
Pa.
Philadelphia County
389
257
Nashville
Tenn.
Davidson County
361
191
Baltimore
Md.
None
331
330
Virginia Beach
Va.
None
328
148
Louisville
Ky.
Jefferson County
308
171
Fresno
Calif.
Fresno County
305
221
Jacksonville
Fla.
Duval County
297
119
Denver
Colo.
Denver County
295
205
Washington, D.C.
D.C.
None
294
158
Charleston
S.C.
Charleston County
286
229
Atlanta
Ga.
Fulton County
279
198
Colorado Springs
Colo.
El Paso County
279
111
El Paso
Texas
El Paso County
277
177
Little Rock
Ark.
Pulaski County
272
203
Newark
N.J.
Essex County
262
242
Jackson
Miss.
Hinds County
259
252
Charleston
W. Va.
Kanawha County
254
193
Las Vegas
Nev.
Clark County
251
132
Indianapolis
Ind.
Marion County
249
189
Birmingham
Ala.
Jefferson County
249
179
Tulsa
Okla.
Tulsa County
248
172
Billings
Mont.
Yellowstone County
246
224
Oklahoma City
Okla.
Oklahoma County
243
173
Milwaukee
Wis.
Milwaukee County
240
126
Sacramento
Calif.
Sacramento County
235
116
Boise
Idaho
Ada County
232
205
Wichita
Kan.
Sedgwick County
230
171
Omaha
Neb.
Douglas County
225
204
Cheyenne
Wyo.
Laramie County
223
201
Tampa
Fla.
Hillsborough County
211
145
Salt Lake City
Utah
Salt Lake County
208
191
Des Moines
Iowa
Polk County
206
174
Boston
Mass.
Suffolk County
201
118
Dallas
Texas
Dallas County
198
152
Austin
Texas
Travis County
195
143
San Antonio
Texas
Bexar County
195
184
Houston
Texas
Harris County
185
141
Albuquerque
N.M.
Bernalillo County
179
187
Tucson
Ariz.
Pima County
178
147
San Diego
Calif.
San Diego County
176
82
Sioux Falls
S.D.
Minnehaha County
174
174
San Jose
Calif.
Santa Clara County
172
127
Phoenix
Ariz.
Maricopa County
171
131
Los Angeles
Calif.
Los Angeles County
170
105
Columbus
Ohio
Franklin County
169
133
Fort Worth
Texas
Tarrant County
168
121
Fargo
N.D.
Cass County
154
155
Portland
Maine
Cumberland County
154
90
Miami
Fla.
Miami-Dade County
149
112
Charlotte
N.C.
Mecklenburg County
143
125
San Francisco
Calif.
San Francisco County
143
118
Kansas City
Mo.
Jackson County
140
120
Seattle
Wash.
King County
137
107
Portland
Ore.
Multnomah County
134
106
Chicago
Ill.
Cook County
126
113
Raleigh
N.C.
Wake County
111
101
Detroit
Mich.
Wayne County
107
64
Manchester
N.H.
Hillsborough County
100
53
Minneapolis
Minn.
Hennepin County
99
62
New York
N.Y.
5 NYC Counties
98
71
Varying detention rates defy any logical explanation
We found that jail incarceration and pretrial detention rates vary greatly from city to city. There are some high outliers; Memphis, Tenn., for example, has a total jail detention rate of 491 per 100,000 residents, far above the average jail detention rate across the 63 cities of 225 per 100,000. On the other end of the spectrum, cities like New York and Minneapolis jail fewer than 100 residents per 100,000. Similarly, the pretrial detention rates in St. Louis and Baltimore (395 and 330 per 100,000, respectively) are more than double the average pretrial detention rate for the cities we studied, which was 163 per 100,000. We considered various possible explanations for the drastic differences from city to city, but didn’t find many consistent trends.
Local crime rates don’t consistently explain jail detention rates
First, we used the FBI’s Universal Crime Reporting program data to analyze the cities’ violent crime and total crime rates, to see if high rates of crime correlated with high rates of detention.3 Memphis, St. Louis, and Baltimore — all of which have notably high detention or pretrial detention rates — do in fact have the three highest violent and total crime rates of the cities for which we were able to obtain data.4 This pattern isn’t consistent across other cities, though. For example, Charleston, S.C., has some of the highest jail detention and pretrial detention rates, yet its violent crime and total crime rates rank among the lowest of these cities. On the other end of the spectrum, Detroit boasts very low detention rates, but has a relatively high violent crime rate.
It’s also difficult to know how directly violent crime is actually impacting detention rates because other factors likely influence both crime and incarceration. Poverty, addiction, and a lack of social services, for example, could contribute separately to high rates of both crime and jail detention. In fact, detention itself has been shown to increase the odds of future offending, which is counterproductive from a crime rate-defined public safety standpoint.
Local police and jail budgets don’t explain jail rates, either
Next, we explored whether police budgets were correlated with jail and pretrial detention rates. Using the Vera Institute of Justice’s police budget data, we examined the percent of city funds spent on policing and the number of city dollars per resident allocated to the police. Our analysis did not reveal any noteworthy connections between these measures and local jail rates, however.
The Vera Institute of Justice also provides data on the jail budgets in major cities and the number of county dollars spent per resident specifically on jails. Again, we found no strong correlations between jail budgets and jail incarceration rates. The only notable finding is a correlation between changes in jail population and changes in jail budgets since 2011: Cities that reduced their jail budgets (or avoided large increases) also reduced their jail populations more dramatically. While this may not be particularly surprising, it does suggest that cutting jail budgets could help communities reduce the number of people cycling through jails, while freeing up money to be used elsewhere, like schools.
In many places, the effects of bail reform remain to be seen
A number of cities and states included in this analysis, such as Philadelphia and Dallas, have enacted bail reforms in the past few years. However, since most of these changes occurred after 2018 — the most recent year for which the Vera Institute of Justice’s jail detention data are available — the data we used for this analysis do not yet show the effects of those reforms. Ultimately, these reforms should result in reduced pretrial detention rates. Current data show bail reforms have an impact on overall jail detention as well, since the pretrial population makes up about two-thirds of jail populations nationwide.
In New Jersey, for example, pretrial detention populations decreased by 50 percent from 2015 to 2018 – which was just one year after reforms were implemented. Additionally, New Jersey and San Francisco both saw at least 45 percent decreases in their overall jail populations after instituting bail reforms. We hope and expect these reforms (and others implemented more recently) will continue to lower rates of pretrial incarceration in cities and counties across the country.
While there isn’t a clear explanation for why jail incarceration and pretrial detention rates vary so much from city to city, it is clear that too many people cycle through jails each year, and reforms are long overdue. City leaders need to start investing in their communities instead of jails by expanding access to health care and social services, and implementing alternatives to incarceration.
Appendix
City
State
County
Jail detention rate (per 100,000 county residents)
Pretrial detention rate (per 100,000 county residents)
Violent crime rate (per 100,000 county residents)
Total crime rate (per 100,000 county residents)
Policing budget
Jail budget
Jail population change since 2011
Jail budget change since 2011
Albuquerque
N.M.
Bernalillo County
179
187
no data
no data
$211,084,000
$77,707,756
-52%
-13%
Atlanta
Ga.
Fulton County
279
198
no data
no data
$248,508,775
$90,484,158
8%
13%
Austin
Texas
Travis County
195
143
380
3,569
$491,265,529
$99,791,862
-31%
17%
Baltimore
Md.
None
331
330
1,843
6,116
$549,046,349
no data
no data
no data
Billings
Mont.
Yellowstone County
246
224
no data
no data
$27,017,423
$13,708,860
26%
69%
Birmingham
Ala.
Jefferson County
249
179
no data
no data
$92,775,797
no data
no data
no data
Boise
Idaho
Ada County
232
205
193
1,097
$70,561,456
$28,435,821
-8%
20%
Boston
Mass.
Suffolk County
201
118
no data
no data
$431,731,291
no data
no data
no data
Charleston
S.C.
Charleston County
286
229
196
1,384
$53,445,152
$40,081,245
-53%
9%
Charleston
W. Va.
Kanawha County
254
193
no data
no data
$22,489,588
$4,775,000
29%
-4%
Charlotte
N.C.
Mecklenburg County
143
125
no data
no data
$285,877,585
$90,941,557
-31%
-5%
Cheyenne
Wyo.
Laramie County
223
201
no data
no data
$14,493,787
$12,834,792
47%
35%
Chicago
Ill.
Cook County
126
113
497
2,076
$1,776,930,437
$437,932,791
-44%
40%
Colorado Springs
Colo.
El Paso County
279
111
461
3,254
$140,388,709
no data
no data
no data
Columbus
Ohio
Franklin County
169
133
no data
no data
$347,780,657
$82,811,353
-21%
19%
Dallas
Texas
Dallas County
198
152
406
2,275
$545,974,490
$143,920,841
-19%
20%
Denver
Colo.
Denver County
295
205
no data
no data
$277,927,093
$118,219,314
-29%
22%
Des Moines
Iowa
Polk County
206
174
342
2,344
$71,546,587
$38,268,987
-22%
10%
Detroit
Mich.
Wayne County
107
64
745
2,372
$318,193,356
$132,556,915
-43%
14%
El Paso
Texas
El Paso County
277
177
319
1,629
$157,607,718
$73,784,469
8%
1%
Fargo
N.D.
Cass County
154
155
326
2,595
$22,832,341
$14,171,961
2%
42%
Fort Worth
Texas
Tarrant County
168
121
201
1,417
$352,893,268
no data
no data
no data
Fresno
Calif.
Fresno County
305
221
no data
no data
$201,764,000
no data
no data
no data
Houston
Texas
Harris County
185
141
694
3,764
$899,879,053
no data
no data
no data
Indianapolis
Ind.
Marion County
249
189
no data
no data
$283,571,003
no data
no data
no data
Jackson
Miss.
Hinds County
259
252
no data
no data
$37,523,140
no data
no data
no data
Jacksonville
Fla.
Duval County
297
119
no data
no data
$481,594,597
$124,301,200
-18%
17%
Kansas City
Mo.
Jackson County
140
120
no data
no data
$262,247,405
$29,623,840
-15%
31%
Las Vegas
Nev.
Clark County
251
132
no data
no data
$173,702,925
$286,998,563
-12%
36%
Little Rock
Ark.
Pulaski County
272
203
875
4,385
$80,209,890
no data
no data
no data
Los Angeles
Calif.
Los Angeles County
170
105
346
1,442
$1,735,493,169
$1,347,462,000
-5%
44%
Louisville
Ky.
Jefferson County
308
171
602
4,014
$191,988,200
$56,639,000
-38%
-1%
Manchester
N.H.
Hillsborough County
100
53
no data
no data
$25,285,675
no data
no data
no data
Memphis
Tenn.
Shelby County
491
245
1,382
5,906
$274,511,008
$138,591,511
-29%
-8%
Miami
Fla.
Miami-Dade County
149
112
297
2,088
$281,251,000
$383,686,000
-35%
12%
Milwaukee
Wis.
Milwaukee County
240
126
842
2,444
$321,470,403
no data
no data
no data
Minneapolis
Minn.
Hennepin County
99
62
318
1,868
$193,360,000
$74,904,183
-44%
22%
Nashville
Tenn.
Davidson County
361
191
no data
no data
$216,790,900
$56,703,800
-33%
-12%
New Orleans
La.
Orleans Parish
397
301
no data
no data
$206,887,632
$73,312,897
-73%
-7%
New York
N.Y.
5 NYC Counties
98
71
no data
no data
$11,036,298,140
$2,307,064,976
-58%
-1%
Newark
N.J.
Essex County
262
242
no data
no data
$207,955,896
no data
no data
no data
Oklahoma City
Okla.
Oklahoma County
243
173
604
4,029
$226,626,456
no data
no data
no data
Omaha
Neb.
Douglas County
225
204
521
3,652
$159,838,743
$54,353,577
-4%
55%
Philadelphia
Pa.
Philadelphia County
389
257
no data
no data
$956,632,151
$220,169,920
-45%
-18%
Phoenix
Ariz.
Maricopa County
171
131
no data
no data
$909,129,491
no data
no data
no data
Portland
Maine
Cumberland County
154
90
65
746
$17,757,540
$20,579,182
-28%
16%
Portland
Ore.
Multnomah County
134
106
464
4,917
$238,190,326
$109,598,622
-35%
18%
Raleigh
N.C.
Wake County
111
101
132
1,038
$109,694,902
$50,109,750
-7%
55%
Sacramento
Calif.
Sacramento County
235
116
365
1,950
$184,342,524
no data
no data
no data
Salt Lake City
Utah
Salt Lake County
208
191
189
1,876
$82,235,729
$105,080,518
-36%
32%
San Antonio
Texas
Bexar County
195
184
591
4,253
$479,091,284
$72,653,612
-3%
7%
San Diego
Calif.
San Diego County
176
82
201
1,141
$542,087,473
$387,184,895
-10%
63%
San Francisco
Calif.
San Francisco County
143
118
no data
no data
$706,182,301
no data
no data
no data
San Jose
Calif.
Santa Clara County
172
127
254
1,631
$473,208,901
$243,451,168
-38%
15%
Seattle
Wash.
King County
137
107
227
1,927
$440,240,547
$208,640,119
-39%
20%
Sioux Falls
S.D.
Minnehaha County
174
174
493
3,589
$41,028,140
$17,020,439
-6%
53%
St. Louis
Mo.
None
393
395
1,913
8,049
$154,870,227
$35,382,770
-46%
-8%
Tampa
Fla.
Hillsborough County
211
145
235
1,479
$176,982,462
$192,045,470
-27%
4%
Tucson
Ariz.
Pima County
178
147
no data
no data
$193,274,430
$52,554,404
-2%
0%
Tulsa
Okla.
Tulsa County
248
172
647
4,080
$121,682,000
no data
no data
no data
Virginia Beach
Va.
None
328
148
129
1,885
$102,960,533
$40,694,736
-14%
21%
Washington, D.C.
D.C.
None
294
158
982
5,247
$655,379,632
$203,529,000
-51%
21%
Wichita
Kan.
Sedgwick County
230
171
885
4,967
$89,245,584
$33,793,490
-2%
6%
Footnotes
These cities represent some of the 50 largest cities across the country, as well as the largest cities in each state. ↩
Four cities – Baltimore, St. Louis, Virginia Beach, Va., and Washington, D.C. – are independent cities not part of a county. In these cases, the Vera Institute of Justice reported the detention rate for the cities themselves. ↩
We calculated violent crime and total crime rates for the 38 cities and counties for which the FBI had complete data. We did this by adding the reported crime counts from the city police and corresponding county sheriff’s offices together. (For independent cities, we only used the crime counts from city police.) Then, to calculate the rates, we used the populations for each county as reported in the Vera Institute of Justice’s Trends dataset, which was the same population used to calculate the jail and pretrial detention rates in this briefing. ↩
It’s difficult to compare cities because there are a multitude of factors that could explain differing crime rates. However, the FBI’s UCR data is the closest we can get to having somewhat standardized data across multiple cities and counties. ↩
People in prison have been 5.5 times more likely to get COVID-19 and have suffered a COVID-19 mortality rate 3 times higher than the general public. Now, new data from UCLA Law’s COVID-19 Behind Bars Data Project published this week in preprint1 reveals the degree to which the death rate from all causes of death — not just COVID-19 — increased in Florida state prisons during the COVID-19 pandemic.2 The findings, outlined below, give us a much fuller picture of how deadly COVID-19 has been in prisons.
More deaths, despite fewer people in prisons
The researchers collected monthly population counts for Florida state prisons from 2015 to 2020. Based on this data, the Florida state prison population decreased by about 10,000 in 2020, a reduction of approximately 11% since 2019. The Florida Department of Corrections attributes this population reduction to “fewer arrests and prosecutions, fewer individuals sentenced to incarceration, and fewer commitments received from county jails,” suggesting that while fewer people entered prison, there were no large-scale efforts to release people who were nearing the end of their sentence or those who were at high risk for death related to COVID-19. Despite the slightly smaller prison population, there were more deaths in 2020 (across all causes of death) than in any of the five years prior.
During 2020, there were 42% more “excess deaths” — from all causes — in Florida prisons
During 2020, the United States experienced 23% more deaths than expected, but the Florida prison system experienced almost double that: there were 42% more deaths than expected behind bars in Florida. Importantly, not all of these “excess deaths”3 are officially attributed to COVID-19. According to public health experts, the excess deaths in the United States may be due to undocumented COVID-19 infections, delayed access to health care, or behavioral health crises. The same is likely true in prisons, where healthcare systems frequently neglect medical complaints even during normal times, and where an increase in practices like solitary confinement during COVID-19 has exacerbated mental illnesses.
As the graph below shows, deaths spiked in Florida prisons during the pandemic- and only some were deaths from COVID-19:
Figure 1: Observed and expected mortality trends in Florida state prison population. This graph included in the article shows that deaths in Florida state prison exceeded expectations based on the past 5 years by more than 42%. Not all of those excess deaths are diagnosed COVID-19 deaths, but most are likely at least indirectly caused by the COVID-19 pandemic.
The life expectancy for people in Florida prison decreased by more than 4 years between 2019 and 2020
The authors calculate that COVID-19 reduced the life expectancy of the Florida prison population by over four years. That is far worse than the CDC estimate that the U.S. general population’s life expectancy decreased by about 1 year during the pandemic. (This mortality disparity during COVID-19 is on top of the fact that incarceration itself shortens the lives of people behind bars, as research shows that for every year of incarceration, life expectancy decreases by two years.)
Figure 2: Bootstrapped estimates of life expectancy for Florida state prison population by year. The second graph from the article shows that the life expectancy of people in Florida state prisons is the lowest it’s been in 5 years — declining by 4 years from 2019 to 2020.
Increased mortality rates in prison population
Across all age groups in Florida state prisons, the all-cause mortality rate increased from 2019 to 2020. Four age categories saw statistically significant increases: mortality rates increased 77% for people 35-44 years old, 49% for people 55-64 years old, 67% for people 65-74 years old, and 61% for those 75 or older. Although prisons are often filled with young people, older adults are making up an increasing proportion of the national prison population.
The threat of COVID-19 behind bars disproportionately impacts these older adults who are more likely to already have any number of complex medical conditions.
Conclusions
As we reckon with the consequences of states largely ignoring COVID-19 behind bars, this new data is a reminder to not limit our assessment of the harm to COVID-19 deaths alone. Since the beginning of the pandemic, we have argued that failing to depopulate prisons would not only enable massive viral outbreaks, but that it would also, indirectly, strain medical units in prison and lead to more deaths from a wide variety of illnesses. This data from Florida provides the first quantitative evidence that we and other advocates were right.
The disastrous consequences of COVID-19 behind bars could have been avoided — or at least reduced — if states acknowledged that people in prison have conditions that put them at higher risk, social distancing is impossible in prisons, and prison populations needed to be reduced significantly and quickly. Instead, states chose to leave the vast majority of incarcerated people in prison, at the mercy of a virus that thrives in crowded conditions. The consequences have extended far past the number of official diagnosed COVID-19 cases and deaths.
Footnotes
A preprint reports new medical research that has yet to be peer-reviewed and so should not be used to guide clinical medical practice. ↩
The data in this study is limited to state prisons in Florida. However, because the age and sex distribution of Florida’s prison population is typical of other state prison systems, we expect that studies of other states’ prisons would likely show similar results. ↩
Excess deaths are the number of deaths from all causes that were greater than the expected number of deaths. ↩
Low rates of vaccine uptake among correctional staff make it clear that withholding the vaccine from people who are locked up -- or offering it only to a small fraction of the prison population -- is senseless.
Correctional staff in most states have been eligible for COVID-19 vaccination for months, prioritized ahead of many other groups because of the key role staff play in introducing the virus into prisons and jails and then bringing it back out to surrounding communities. Against the recommendations of medical experts, many states chose to vaccinate correctional staff before incarcerated people, often claiming that staff would serve as a barrier against the virus entering prisons and infecting people who are locked up. Now it’s becoming clearer than ever that this policy choice was a gigantic mistake: New data suggests that most prison staff have refused to be vaccinated, leaving vast numbers of incarcerated people — who have been denied the choice to protect themselves — at unnecessary risk.
We compiled data from the UCLA Law COVID-19 Behind Bars Data Project, The Marshall Project/AP, and other sources,1 and calculated the current rate of staff immunizations in 36 states and the Bureau of Prisons. We found that across these jurisdictions, the median vaccination rate — i.e. the percentage of staff who had received at least one COVID-19 vaccine dose — was only 48%. The numbers are even more disturbing in states like Michigan and Alabama, where just over 10% of staff have gotten at least one dose of a COVID-19 vaccine.
Figure 1.Data compiled from the UCLA Law COVID-19 Behind Bars Data Project, The Marshall Project, and several state-specific data sources (see footnote 1). See the appendix to this article for a table with details about all 37 prison systems for which we gathered data.
This data confirms what we’ve learned anecdotally over the past few months through local news reporting. For example:
In Colorado, vaccine uptake among correctional staff has been so poor that the state is now offering staffers $500 each to get the vaccine.
The Marshall Projectreported in mid-March that “In Massachusetts, more than half the people employed by the Department of Correction declined to be immunized. A statewide survey in California showed that half of all correctional employees will wait to be vaccinated. In Rhode Island, 30% of prison staff have refused the vaccine, a higher rate than the incarcerated, according to the state’s Department of Corrections. And in Iowa, early polling among employees showed a little more than half the staff said they’d get vaccinated.”
These low rates of vaccine uptake among correctional staff make it clear that withholding the vaccine from people who are locked up — or offering it only to a small fraction of the prison population — is senseless. No policymaker in any state should assume there is a firewall of vaccinated staffers protecting incarcerated people from the coronavirus.
Especially as the U.S. experiences a potentially disastrous “fourth surge” of the pandemic, it remains urgently necessary to:
Offer the vaccine to all incarcerated people — now. As we’ve discussed before, incarcerated people are much more likely to contract and die from the coronavirus, because outbreaks behind bars are common and a disproportionate number of incarcerated people have chronic medical problems that make the virus more deadly. (In many of the states we researched, officials and journalists have noted that incarcerated populations have had much higher uptake rates than staff.)
Depopulate prisons and jails. The coronavirus thrives in dense environments, so releasing people is still the best way to stop outbreaks behind bars — and as long as staff and incarcerated people aren’t vaccinated, outbreaks are certain to continue. States should be considering the most medically vulnerable incarcerated people first, and not excluding people automatically based on whether they committed a violent crime (we’ve written at length about the perils of leaving behind whole categories of incarcerated people). Unfortunately, prison releases have been very sparse so far.
As the new data shows, it’s simply not true that “offering” the vaccine to correctional officers amounts to protecting incarcerated people or the public from the rapid spread of the virus in correctional facilities. What states must do is make the vaccine truly accessible to both corrections staff and people who are locked up, and immediately begin increasing prison releases through commutations, good time credits, and expansions of parole. As long as states ignore and neglect incarcerated people, there will be no end in sight to the pandemic in prisons and jails.
Update April 23, 2021: The percentage of North Carolina Dept. of Public Safety staff who had received at least one dose of a vaccine as of April 20, 2021 was erroneously reported in an earlier version of this article as 85%. That calculation was based on the number of correctional staff (7,774) as reported by The Marshall Project/AP, but the Dept. of Public Safety clarified that the staff vaccination counts include all DPS employees, not just correctional staff. All related calculations (e.g. the total reported in the appendix) have been updated as well to reflect the corrected data.
Update June 21, 2021: The percentage of Virginia Dept. of Corrections (DOC) staff who had received at least one dose of a vaccine as of April 20, 2021 was originally reported as 72%. That calculation was based on the number of correctional staff (8,895) as reported by The Marshall Project/AP, but the DOC clarified in an email that our denominator (the number of correctional staff) may not be correct, although they did not provide the correct number of staff. They did, however, report that as of June 4, 2021, only 57% of staff had received at least one dose of a vaccine. Without the details of the number of staff and number receiving a first dose, we are unable to update the other calculations in this analysis (e.g. the total reported in the appendix).
Footnotes
Source notes: In addition to the UCLA and The Marshall Project/AP data sets, we sought staff vaccination data from state Department of Corrections websites, news articles, and in one case, the Covid Prison Project’s media-sourced data set. Our vaccination rate calculations are based on total staff numbers, most of which come from The Marshall Project/AP data set; other sources are noted in the appendix table. The types of employees included in the total staff counts vary by state, and those details were not always clear in the data set. Data from UCLA, The Marshall Project/AP, and state Department of Corrections websites were accessed on April 20, 2021.
It’s important to note that states do not report vaccination data consistently, so we made every effort to avoid double-counting staff and overestimating vaccination rates. Specifically, we typically defined staff receiving “at least one dose” of a vaccine as those who were reported as “partially” vaccinated, or having “initiated” vaccination or “received first dose.” This is because many states record vaccinated staff members twice – once when a two-dose vaccine schedule is started and once when it’s completed; those receiving the one-shot Johnson & Johnson vaccine may be included in both categories as well (as a “first dose” and as “completed”). In states where the available data suggested a different definition, we have noted those differences in “notes/clarifications” in the appendix table. ↩
Appendix
Prison system
Number of staff who have received at least one dose
Total number of staff
Percentage of staff who have received at least one dose
Source for staff vaccination counts
Source for total staff count
Notes/Clarifications
Alabama
824
6,259
13%
The Marshall Project/AP
The Marshall Project/AP
Arkansas
1,421
4,045
35%
The Marshall Project/AP
The Marshall Project/AP
California
27,758
46,000
60%
UCLA Law Covid-19 Behind Bars Data Project
The Marshall Project/AP
Colorado
2,972
6,267
47%
UCLA Law Covid-19 Behind Bars Data Project
The Marshall Project/AP
Connecticut
2,697
6,170
44%
UCLA Law Covid-19 Behind Bars Data Project
The Marshall Project/AP
Delaware
1,268
2,530
50.1%
UCLA Law Covid-19 Behind Bars Data Project
The Marshall Project/AP
Idaho
567
1,999
28%
The Marshall Project/AP
The Marshall Project/AP
In addition to the 224 staff vaccinated at the department, an additional 343 self-disclosed they received both doses from outside providers.
We used the staff number from the DOC because the number of vaccinated employees was described as those “who work in Louisiana’s state prisons” (not all DOC employees).
Included in our calculation of the number of staff who received at least one dose are 1,091 who received the J&J vaccine, 743 who received a first dose from the MDOC, 485 who “completed external [outside of the MDOC] vaccination process,” and 123 who “started external vaccination process.” Because the number that “started” an external vaccination process is much smaller than the number that have completed it, we assumed that the 123 who “started” were not also included in the “completed” group, as is the case in other data sets.
While the source for the COVID Prison Project data is unavailable, its data seems to be corroborated by an April 6 MDOC Employee newsletter, which states, “Thousands of … team members have been vaccinated against the COVID-19 virus.”
Specifically, the NDOC update reports “1,230 – first dose, 822- second dose.” Because it is unclear whether those who received second doses are also counted among those who have received a first dose, as is true in other data sets, we used the first dose counts to avoid double-counting.
N.C. Dept. of Public Safety, via email (4/23/21). This includes all DPS employees, not just correctional officers.
We included both “partially” and “fully” vaccinated staff because the number of “fully” vaccinated staff was much greater than the number “partially” vaccinated, suggesting that unlike other data sources, the “fully” vaccinated staff are not double-counted in the NCDOC’s “partially” vaccinated staff counts.
Ohio
7,057
12,192
58%
The Marshall Project/AP
The Marshall Project/AP
Pennsylvania
3,094
15,073
21%
UCLA Law Covid-19 Behind Bars Data Project
The Marshall Project/AP
Rhode Island
927
1,339
69%
The Marshall Project/AP
The Marshall Project/AP
Tennessee
3,247
5,179
63%
UCLA Law Covid-19 Behind Bars Data Project
The Marshall Project/AP
Texas
11,893
36,073
33%
The Marshall Project/AP
The Marshall Project/AP
Vermont
467
1,001
47%
The Marshall Project/AP
The Marshall Project/AP (does not include health care workers, who are contractors).
Virginia
6,416
8,895
72%
UCLA Law Covid-19 Behind Bars Data Project
The Marshall Project/AP
See update of June 21, 2021 in the text above. The VA DOC reported that as of June 4, 2021, only 57% of staff had received at least one dose of a vaccine; further details were not provided.
According to a Patch.com article (3/16/21), correctional staff were only eligible for vaccination starting March 17, which was much later than many other states.
Specifically, the DCR reports 1,914 first doses and 1,774 second doses administered to 3,687 employees (including contract staff). We used the count for first doses to avoid double-counting those who have received second doses, because it was unclear in the data whether these are mutually exclusive groups.
The Marshall Project/AP report a much smaller DOC staff number (4,640), but it varied so dramatically from the WDOC number that we decided to use the count from the dashboard.
We are excited to welcome Naila Awan, who will serve as the first-ever Director of Advocacy at the Prison Policy Initiative. Naila is a civil and human rights lawyer with years of experience collaborating with, supporting, and representing Black- and Brown-led grassroots organizations in policy reform and litigation efforts. Prior to joining Prison Policy Initiative, Naila worked for multiple civil rights organizations and served on the legislative staff for Congresswoman Tammy Baldwin.
Most recently, Naila served as Senior Counsel at Dēmos, where her work centered on combating voter suppression and expanding access to the ballot for traditionally marginalized communities. In this role, she led a cross-functional project to end the disenfranchisement people experience when then come into contact with the criminal legal system, testified before Congress, and served as counsel in A. Philip Randolph Institute v. Husted, a U.S. Supreme Court case challenging Ohio’s voter purge practices, and Mays v. LaRose, a class action seeking to expand access to the ballot for voters detained in jail. She also co-authored Enfranchisement for All: The Case for Ending Penal Disenfranchisement in Our Democracy and How to End De Facto Disenfranchisement in the Criminal Justice System.
Naila holds a L.L.M in International Studies from the New York University School of Law, a J.D from the Ohio State University’s Moritz College of Law, and a B.A from Miami University of Ohio.
We are excited to welcome our new Communications Director Mike Wessler. Mike has more than a decade of experience helping campaigns, political parties, nonprofit organizations and elected officials accomplish their goals through strategic communication. Mike has done communications work at the Massachusetts Office of the State Auditor and the Office of the Montana Governor, as well at the Montana Department of Labor and the Montana Democratic Party. Mike has a Bachelor’s degree in Political Science from Florida State University.
Families with loved ones incarcerated in New York State prisons pay some of the lowest phone fees in the entire country. Meanwhile, those with loved ones in the state’s county jails have some of the highest phone costs. How can this be?
It’s all about the incentives. In 2007, New York State passed progressive legislation requiring contracts between state prisons and private phone companies to be negotiated “for the lowest price to the consumer,” and prohibiting the department of corrections from accepting commissions on phone calls. (Nationwide, the commission-based structure of correctional phone calls is a major factor driving up costs for the consumer.) New York’s legislation, however, does not apply to county and city jails, meaning counties are free to choose the phone company that charges the most and kicks the most revenue back to the jail. As a result of this loophole, the average 15-minute call from a New York jail costs seven times more than an identical call from a state prison.
These exorbitant phone rates cost some the poorest residents of New York State — and a group disproportionately made up of women of color — more than $13 million a year just to talk to their jailed loved ones.1 The role played by counties in driving up these costs is clearly demonstrated in our new dataset of commission percentages paid by phone companies to New York county jails. We found that the majority of the cost of an average jail phone call — 64 cents on the dollar — is kicked back from the service provider to the county or jail. In some counties, as much as 86% of jail phone call revenue ends up in the pockets of the county government.2
Cost of a 15-minute phone call in New York county jails — and how much more affordable they could be without commissions
Throughout New York State, counties collect significant commissions from their jail phone providers, driving up costs for families. Here, we collected the current cost of a 15-minute, in-state phone call from each county’s jail, using the rate lookup tools on the phone providers’ websites on March 9, 2021. Unlike in other states, the vast majority of New York counties have chosen to contract with GTL.3 (The five counties of New York City are not included here because New York City made all jail calls free in 2019.)
In this table, we also calculated the hypothetical cost of a 15-minute call if commissions were waived, based on a scenario where a county waives its commissions and asks the phone provider to lower the call rate proportionately (for example, if Albany County waived its 86% commission, and the cost of the call dropped by 86%, from $7.50 to $1.05). In reality, a county that took such a step would likely also strike a harder bargain with the private phone company, reducing rates even further. In every county, we were able to find current phone rates on the phone providers’ websites. However, for some counties, we could not calculate the current commission rate or hypothetical cost of a phone call if commissions were waived, because the county did provide a contract in response to public record requests.
County
Phone services provider
Current cost of a 15‑minute phone call
Hypothetical cost of a 15‑minute call if commissions were waived
Kickback percentage in contract
Albany
Securus
$7.50
$1.05
86%
Allegany
GTL
$2.25
Cannot calculate
Did not provide contract
Broome
GTL
$3.00
$1.68
44%
Cattaraugus
GTL
$9.95
$4.48
55%
Cayuga
GTL
$3.00
$1.35
55%
Chautauqua
GTL
$2.25
$1.17
48%
Chemung
GTL
$8.50
$3.83
55%
Chenango
GTL
$3.00
Cannot calculate
Did not provide contract
Clinton
GTL
$3.75
$2.10
44%
Columbia
GTL
$2.25
Cannot calculate
Contract does not specify commission amount
Cortland
GTL
$2.25
$1.01
55%
Delaware
GTL
$3.00
$0.60
80%
Dutchess
GTL
$9.95
$4.48
55%
Erie
ICSolutions
$3.15
$1.15
63.50%
Essex
GTL
$3.00
$0.60
80%
Franklin
GTL
$2.25
$0.45
80%
Fulton
GTL
$3.00
$0.60
80%
Genesee
Securus
$7.50
$1.50
80%
Greene
GTL
$9.95
$5.57
44%
Hamilton
Frontier Communications
$0.00
$0.00
0%
Herkimer
GTL
$2.25
$0.45
80%
Jefferson
GTL
$2.25
$0.45
80%
Lewis
GTL
$3.00
$1.35
55%
Livingston
GTL
$2.25
$0.45
80%
Madison
GTL
$9.95
$1.99
80%
Monroe
Securus
$1.50
$0.32
78.50%
Montgomery
GTL
$3.00
$1.68
44%
Nassau
GTL
$9.95
$4.58
54%
Niagara
GTL
$2.25
$0.45
80%
Oneida
GTL
$9.95
$5.47
45%
Onondaga
ICSolutions
$2.25
$0.79
65%
Ontario
Securus
$3.15
$1.10
65%
Orange
GTL
$9.95
$4.98
50%
Orleans
ICSolutions
$3.15
Cannot calculate
Contract does not specify commission amount
Oswego
GTL
$3.75
$0.75
80%
Otsego
GTL
$2.25
$1.26
44%
Putnam
GTL
$3.00
$0.60
80%
Rensselaer
GTL
$2.25
$1.01
55%
Rockland
GTL
$9.95
Cannot calculate
Did not provide contract
Saratoga
GTL
$3.00
$0.60
80%
Schenectady
GTL
$9.95
$4.48
55%
Schoharie
GTL
$3.00
$1.35
55% of billed or prepaid
Schuyler
GTL
$3.00
$1.35
55%
Seneca
GTL
$9.95
$1.99
80%
St. Lawrence
GTL
$3.00
$0.60
80%
Steuben
GTL
$9.95
$5.57
44%
Suffolk
Securus
$7.50
$1.05
86%
Sullivan
Securus
$7.50
$3.30
56%
Tioga
GTL
$9.95
$1.99
80%
Tompkins
GTL
$2.25
$0.45
80%
Ulster
Securus
$2.10
Cannot calculate
Did not provide contract
Warren
GTL
$9.95
Cannot calculate
Contract does not specify commission amount
Washington
GTL
$3.00
$0.60
80%
Wayne
GTL
$2.25
$1.26
44%
Westchester
GTL
$2.25
$0.86
62%
Wyoming
GTL
$2.40
$0.48
80%
Yates
GTL
$3.00
$0.60
80%
These high commissions translate to high costs for families. We found that in 2019, a 15-minute phone call from the average jail in New York was more expensive than the average jail phone call in 43 states. But it doesn’t have to be this way. If individual New York counties pledged to waive the income they earn off the backs of their poorest residents, the cost of a 15-minute phone call would instantly drop significantly. And if the state stepped in with legislation requiring jail phone contracts to be negotiated on the basis of the lowest cost to the consumer (like it already requires of prisons), the rates would go down even further.
In fact, there are several solutions that would reduce phone costs for families of jailed New Yorkers:
Individual counties should immediately tell their provider they want to waive their commission and see the cost of phone calls proportionally reduced for the consumer. (This would ultimately benefit the counties themselves. Many people in jails will soon return to their communities, and studies show that maintaining close contact with family members is linked to better post-release outcomes and lower rates of recidivism.)
Counties should, in their next contracts, refuse to take a commission, and should negotiate not on the basis of maximizing revenue for the county, but to lower the costs for families. Many contracts in New York counties are expiring in the next few years — some of which will automatically renew unless the county actively seeks a new provider and renegotiates. (See our Expiration Dates appendix for information on when your county’s contract is expiring.)
When seeking a new contract, counties should put out separate Requests for Proposals (RFPs) for each service (such as phone calls, electronic messaging, and video visitation), instead of bundling these services together into a single RFP and contract. In fact, New York State should prohibit jails from signing bundled contracts for multiple services because it obscures the provider’s profits and the true cost of the contract. (For more on the harms of bundling see Footnote 2).
Counties should consider going one step further and paying the cost of phone calls themselves, therefore making calls free for families. New York City became the first US jurisdiction to pick up the tab on jail calls in 2019.4 (This may be less expensive than it sounds. Cities or counties covering the total cost of phone calls can negotiate even lower rates, since the phone companies no longer need to do individualized billing.)
New York State should extend its historic legislation that already bans commissions on phone calls in New York State prisons, and requires prison phone contracts to be negotiated for the lowest price to the consumer. Simply closing this loophole and applying the law to jails would save families at least $13 million on their phone bills.
Methodology & Appendices:
This analysis was made possible thanks to detailed public record requests made by George Dahlbender. This collection was supplemented by Andrea Fenster; Worth Rises also generously shared three additional contracts. Finally, although Schenectady and Sullivan counties did not respond to public record requests, we were able to find recent copies of their contracts on Muckrock.com, a nonprofit that helps people and organizations file and share record requests.
In the following four appendix tables, we have highlighted key information from the contracts and other documents that counties provided. We are also providing links to the contracts themselves so that journalists and other advocates can hold the counties accountable:
Appendix 1: Commissions pocketed by counties for phone, tablet, and video services
This appendix table includes the commissions each county receives for phone calls and other services. Here, we have also provided access to the actual county contracts (and commission reports, where available) to other researchers and advocates. As you can see, the commission rate in a given county is often much higher for phones than for tablets and video services; as we’ve discussed in this article, providers often win contracts by paying huge phone commissions to the counties, while ensuring their own profits via low commissions on bundled services.
Phone
Tablet
Video
Notes
County
Provider
Phone Commission Percent
Additional Payments
Guaranteed Minimum Payments
Cite in Document
Provider
Commission
Cite in Document
Is commission contingent on 80% of the population having “reasonable access” to tablets?
Provider
Commission
Cite in Document
Albany
Securus
86%
One-time $115,000 signing bonus
Pre-paid commissions of $1,200,000 in the first year, and $600,000 in each of the second and third year
The service schedule that is referenced in the contract was not included in the county’s response to a FOIL request.
Cortland
GTL
55%
“… Premise Provider is compensated on a per call basis, depending on the program implemented, either at a flat amount per call, or on a percentage of the call charge.”
“Company will pay Premise Provider a commission every month based on average monthly revenue per tablet for that month from purchased content (“Content Revenue”)…Furthermore, Company will not owe or pay any commission on the first Eighty Nine Thousand Seven Hundred Dollars ($89,700), in Content Revenue collected.” Commissions range from 0% to 70%.
“Company shall also encumber Twenty-five percent (25%) of the Gross Reveneue billed or prepaid for inmate telephone calls covered by this Agreement, and issue a monthly check to the Premise Provider for this amount in the form of a technology grant”
Montgomery County responded on 9/30/2020 that they did not have a current contract. We obtained a contract that is expired, but automatically renews, from Worth Rises. As of 3/12/2021, rates for Montgomery County were listed on the GTL website.
In response to a request for the current contracts on 7/13/2020, the county provided a contract with Trinity for tablets and phones which expired on 4/20/2020. We assumed that this is the current provider. However, it is possible that the county has switched tablet and video service providers to Telmate, which is owned by GTL. Telmate’s website, as of 3/12/2021, lists that it provides tablets and video here.
“Such compensation will be paid monthly with a minimum annual guarantee amount of $75,000. After the first 12 months and each year thereafter during the Term, the minimum annual guarantee will be 80% of the previous 12 month’s actual commissions earned”
Orange County responded “N/A/ no such record” to the request for records relating to tablet and video services. GTL’s website lists that it provides video services as of 3/12/2021.
Orleans
ICSolutions
Unknown (Contract mentions these services, but does not specify any commission amount)
Unknown (Contract mentions these services, but does not specify commission details)
Unknown (Contract mentions these services, but does not specify commission details)
Orleans County provided some documents, but did not provide agreements with service providers. The response stated that the records requested “are trade secrets or are submitted to agency by a commercial enterprise or derived from information obtained from a commercial enterprise and which, if disclosed, would cause substantial injury to the competitive position of the subject enterprise (POL 87(2)(d)).”
Oswego
GTL
80%
$1.60 for each Collect2Card call and $0.30 for each Connect2Phone call
Rockland County responded that Corrections does not keep responsive records. We checked service provider websites to see if Rockland County was listed; we found the county on both the GTL and Securus websites. Since GTL is also listed on the Rockland County Sheriff’s Office website, we assume this is the correct phone service provider.
“… Premise Provider is compensated on a per call basis, depending on the program implemented, either at a flat amount per call, or on a percentage of the call charge.”
Schenectady County did not provide a response to FOIL requests. However, we obtained a contract from MuckRock.com. In addition, GTL’s website lists Schenectady County as one of the places it serves.
Schoharie
GTL
55% of billed or prepaid
“Company shall also encumber Twenty-five percent (25%) of the Gross Reveneue billed or prepaid for inmate telephone calls covered by this Agreement, and issue a monthly check to the Premise Provider for this amount.”
“… Premise Provider is compensated on a per call basis, depending on the program implemented, either at a flat amount per call, or on a percentage of the call charge.”
Sullivan County did not provide a response to FOIL requests. However, we obtained a recent contract from MuckRock.com. In addition, Securus’s website lists Sullivan County as one of the places it serves.
“… B) put in escrow $200,000.00 to be used for enhanced technology at the County’s request; C) roll over an escrow balance of $61,652.63 remaining from the previous agreement into the new term; …”
“… Premise Provider is compensated on a per call basis, depending on the program implemented, either at a flat amount per call, or on a percentage of the call charge.”
Appendix 2: Which counties have bundled contracts?
This appendix table shows that the majority of counties bundle together phone calls and other services into a single contract. Bundling services together usually adds additional costs for the consumers. We chose to distinguish between counties (such as Albany) that bundled together services from a single vendor within the initial contract, and other counties (such as Broome) that signed a phone contract and then later added non-phone services to that contract via amendment. Both of these scenarios are concerning for different reasons: When counties bundle from the outset, providers can obscure the true cost of the contract and the provider’s profits, as explained in Footnote 2. And when counties add new services onto an existing contract instead of putting out a competitive request for proposals, they fail to consider whether a competing company could provide either the existing or newly-added services at a lower cost.
County
Are Services Bundled?
Albany
Yes: Phone, tablet, and video services were bundled in initial contract
Allegany
Unknown (Did not provide contract)
Broome
Yes: Tablet and video services were added to existing phone contract via amendment
Cattaraugus
Yes: Tablet and video services were added to existing phone contract via amendment
Cayuga
Unknown (Did not provide Tablet and Video contracts)
Chautauqua
Yes: Phone and video services were bundled in initial contract
Chemung
Unknown (Did not provide Tablet and Video contracts)
Chenango
Unknown (Did not provide Tablet and Video contracts)
Clinton
Yes: Tablet and video services were added to existing phone contract via amendment
Columbia
Unknown (Did not provide Tablet and Video contracts)
Cortland
Yes: Tablet services were added to existing phone contract via amendment
Delaware
Yes: Tablet and video services were added to existing phone contract via amendment
Dutchess
Yes: Phone, tablet, and video services were bundled in initial contract
Erie
Yes: Video services were added to existing phone contract via amendment
Essex
Yes: Phone, tablet, and video services were bundled in initial contract
Franklin
Yes: Tablet and video services were added to existing phone contract via amendment
Fulton
No: Has contracts with different providers for phone and tablet services
Genesee
Yes: Phone and video services were bundled in initial documents
Greene
Unknown (Did not provide Tablet and Video contracts)
Hamilton
N/A (Facility does not offer tablet and video services)
Herkimer
Unknown (Did not provide Tablet and Video contracts)
Jefferson
Unknown (Did not provide Tablet and Video contracts)
Lewis
Yes: Tablet and video services were added to existing phone contract via amendment
Livingston
Yes: Phone, tablet, and video services were bundled in initial contract
Madison
Yes: Tablet and video services were added to existing phone contract via amendment
Monroe
Yes: Phone, tablet, and video services were bundled in initial contract
Montgomery
Unknown (Did not provide Tablet and Video contracts)
Nassau
Unknown (Did not provide Tablet and Video contracts)
Niagara
Yes: Video services were added to existing phone contract via amendment
Oneida
Unclear: County provided contracts for different providers for phone services and tablet/video services (GTL for phones and Trinity for tablets and video). However, Telmate, a GTL subsidiary, lists that it provides tablet and video services to Oneida County on its website.
Onondaga
Yes: Phone and video services were bundled in initial contract
Ontario
Yes: Phone, Tablet, Video were bundled in initial contract
Orange
Unknown (Did not provide Tablet and Video contracts)
Orleans
Unknown (Did not provide full phone and video contracts)
Oswego
Yes: Tablet and video services were added to existing phone contract via amendment
Otsego
Unknown (Did not provide Tablet and Video contracts)
Putnam
Yes: Tablet services were added to existing phone contract via amendment
Rensselaer
Yes: Video services were added to existing phone contract via amendment
Rockland
Unknown (Did not provide phone, tablet, or video contracts)
Saratoga
Yes: Tablet and video services were added to existing phone contract via amendment (The phone and tablet provider is Keefe, which is owned by GTL)
Schenectady
Unknown (Did not provide phone, tablet, or video contracts)
Schoharie
Yes: Tablet and video services were added to existing phone contract via amendment
Schuyler
Unknown (Did not provide Tablet and Video contracts)
Seneca
Unknown (Did not provide Tablet and Video contracts)
St. Lawrence
Yes: Tablet and video services were added to existing phone contract via amendment
Steuben
Yes: Tablet and video services were added to existing phone contract via amendment
Suffolk
Unknown (Did not provide Tablet and Video contracts)
Sullivan
Unknown (Did not provide phone, tablet, or video contracts)
Tioga
N/A (Facility does not offer tablet and video services)
Tompkins
Yes: Tablet and video services were added to existing phone contract via amendment
Ulster
Unknown (Did not provide contract)
Warren
N/A (Facility does not offer tablet and video services)
Washington
Yes: Tablet and video services were added to existing phone contract via amendment
Wayne
Unknown (Did not provide Tablet and Video contracts)
Westchester
No: Has contracts with different providers for phone and video services (county did not provide a tablet contract)
Wyoming
Unknown (Did not provide Tablet and Video contracts)
Yates
Yes: Phone, tablet, and video services are in a single contract (unknown if it was set up this way initially or if additional services were added to existing contract via amendment)
Appendix 3: Where are county kickbacks directed?
Different county contracts specify different payees for the commissions. In some cases, kickbacks are paid directly to the jail, in others to the county more broadly, and in still others to a specified fund. For each county, this table shows the payee listed in the county contract.
Of course, as we have argued for years, these kickbacks are inappropriate no matter who technically receives them. As Verizon, a vocal opponent of predatory phone calls, noted in a comment to the FCC: “DOCs may use commissions to fund beneficial inmate services that may not otherwise receive funding. But forcing inmates’s families to fund these programs through their calling rates is not the answer. Because higher rates necessarily reduce inmates’s telephone communications with their families and thus impede the well-recognized societal benefits resulting from such communications, other funding sources should be pursued.”
County
Phones
Tablets
Video
Albany
County
County
County
Allegany
Unknown (did not provide phone contract)
Unknown (did not provide tablet contract)
Unknown (did not provide video contract)
Broome
Broome County Jail/Premises Provider
Broome County Jail/Premises Provider
Broome County Jail/Premises Provider
Cattaraugus
Cattaraugus County, Attn: Sheriff’s Office
Premises Provider
Premises Provider
Cayuga
Cayuga County Jail, Sheriff David S. Gould
Unknown (did not provide tablet contract)
Unknown (did not provide video contract)
Chautauqua
Chautauqua County Jail
Unknown (did not provide tablet contract)
Chautauqua County Jail
Chemung
Chemung County Jail, Attn: Sheriff Christopher J. Moss
Unknown (did not provide tablet contract)
Unknown (did not provide video contract)
Chenango
Unknown (did not provide phone contract)
Unknown (did not provide tablet contract)
Unknown (did not provide video contract)
Clinton
Clinton County Jail, Attn: David Farro, Sheriff
Clinton County Jail/Premises Provider
Clinton County Jail/Premises Provider
Columbia
Unknown (county provided incomplete documentation that leaves details of service unclear)
Unknown (did not provide tablet contract)
Unknown (did not provide video contract)
Cortland
Cortland County Jail
Cortland County Sheriff’s Department/Premise Provider
Unknown (did not provide video contract)
Delaware
Unknown (county provided incomplete documentation that leaves details of service unclear)
County said it does not provide this service
County said it does not provide this service
Dutchess
Dutchess County Sheriff’s Department, Attn: George Krom, Correction Administrator
Dutchess County/Premise Provider
Unknown (did not provide video contract)
Erie
Erie County Sheriff’s Office, NY/Facility
County said it does not provide this service
Erie County Sheriff’s Office, NY/Facility
Essex
Essex County Jail, Attn: Sheriff David Reynolds
Essex County Jail/Premises Provider
Essex County Jail/Premises Provider
Franklin
Franklin County Jail/Premises Provider
Franklin County Jail/Premises Provider
Franklin County Jail/Premises Provider
Fulton
Fulton County Jail, Attn: Sheriff Thomas J. Lorey
Unknown (county provided incomplete documentation that leaves details of service unclear)
Unknown (did not provide video contract)
Genesee
County
Unknown (county provided incomplete documentation that leaves details of service unclear)
Unknown (did not provide video contract)
Greene
Greene County Jail, Att: Daniel Frank, County Administrator
Unknown (did not provide tablet contract)
Unknown (did not provide video contract)
Hamilton
County said there are no commissions on phone calls
County said it does not provide this service
County said it does not provide this service
Herkimer
Herkimer County Jail, Attn: Ms. Judy Higgins (Deposited by county to Account A 3150A.2450A, Commissions, Correctional Facility Fund)
Unknown (did not provide tablet contract)
Unknown (did not provide video contract)
Jefferson
Jefferson County Sheriff’s Office
Unknown (did not provide tablet contract)
Unknown (did not provide video contract)
Lewis
County of Lewis/County
Lewis County Jail/Premises Provider
Lewis County Jail/Premises Provider
Livingston
Livingston County, Attn: Chief Deputy Jason Yasso
Livingston County Jail/Premises Provider
Livingston County Jail/Premises Provider
Madison
Madison County Jail, Attn: Sheriff
Madison County/ Premises Provider
Madison County/Premises Provider
Monroe
Jail Administration, Monroe County Sheriff’s Office (by county resolution, payments go to trust fund 9620, T99 Jail Commissary-Phone)
Jail Administration, Monroe County Sheriff’s Office (by county resulotion, payments go to trust fund 9620, T99 Jail Commissary-Phone)
Jail Administration, Monroe County Sheriff’s Office (by county resulotion, payments go to trust fund 9620, T99 Jail Commissary-Phone)
Montgomery
Montgomery County Treasurer
Unknown (did not provide tablet contract)
Unknown (did not provide video contract)
Nassau
Nassau County Correctional Center, Attn: Warren Vandewater, Budget Director
Unknown (did not provide tablet contract)
Unknown (did not provide video contract)
Niagara
Niagara County Sheriff’s Office
Unknown (did not provide tablet contract)
Unknown (did not provide video contract)
Oneida
Oneida County Sheriff’s Office/Premises Provider
Oneida County Sheriff’s Office
Oneida County Sheriff’s Office
Onondaga
County of Onondaga/County
Unknown (did not provide tablet contract)
County of Onondaga/County
Ontario
Ontario County/Customer
Ontario County/Customer
Ontario County/Customer
Orange
Karen Daly, Fiscal Manager, Orange County Correctional Facility
County said it does not provide this service
County said it does not provide this service
Orleans
County
County said it does not provide this service
County
Oswego
Oswego County Correctional Facility
Oswego County Correctional Facility/Premises Provider
Oswego County Correctional Facility/Premises Provider
Otsego
Otsego County Sheriff’s Department
Unknown (did not provide tablet contract)
Unknown (did not provide video contract)
Putnam
Putnam County, NY, Attn: Robert L. Langley Jr., Sheriff
Unknown (county provided incomplete documentation that leaves details of service unclear)
Unknown (did not provide video contract)
Rensselaer
Rensselaer County Bureau of Finance
Unknown (did not provide tablet contract)
Unknown (county provided incomplete documentation that leaves details of service unclear)
Rockland
Unknown (did not provide phone contract)
Unknown (did not provide tablet contract)
Unknown (did not provide video contract)
Saratoga
County of Saratoga/County
Saratoga County Correctional Facility/Client
Saratoga County Correctional Facility/Client
Schenectady
Finance Department
Unknown (did not provide tablet contract)
Unknown (did not provide video contract)
Schoharie
Schoharie County Sheriff’s Office, ATTN: Sheriff Ron Stevens
Schoharie County Jail/Premises Provider
Schoharie County Jail/Premises Provider
Schuyler
Schuyler County Jail, Attn: Sheriff William E. Yessman
Unknown (did not provide tablet contract)
Unknown (did not provide video contract)
Seneca
Seneca County Jail
Unknown (did not provide tablet contract)
Unknown (did not provide video contract)
St. Lawrence
St. Lawrence County Sheriff’s Office
St. Lawrence County Correctional Facility
Unknown (county provided incomplete documentation that leaves details of service unclear)
Steuben
Steuben County Jail, Attn: Sheriff Joel Ordway
Unknown (county provided incomplete documentation that leaves details of service unclear)
Unknown (county provided incomplete documentation that leaves details of service unclear)
Suffolk
County of Suffolk/County
Unknown (did not provide tablet contract)
Unknown (did not provide video contract)
Sullivan
Sullivan County Sheriff’s Office, Attn: Sheriff
Unknown (did not provide tablet contract)
Unknown (did not provide video contract)
Tioga
Tioga County Jail, Att: Gary W. Howard, Sheriff
County said it does not provide this service
County said it does not provide this service
Tompkins
Tompkins County Sheriff’s Department/Premises Provider
Tompkins County Sheriff’s Department/Premises Provider
Tompkins County Sheriff’s Department/Premises Provider
Ulster
Unknown (did not provide phone contract)
Unknown (did not provide tablet contract)
Unknown (did not provide video contract)
Warren
Unknown (county provided incomplete documentation that leaves details of service unclear)
County said it does not provide this service
County said it does not provide this service
Washington
Unknown (county provided incomplete documentation that leaves details of service unclear)
Washington County Jail/Premises Provider
Washington County Jail/Premises Provider
Wayne
Wayne County Sheriff’s Office/Premises Provider
Unknown (did not provide tablet contract)
Unknown (did not provide video contract)
Westchester
County of Westchester/County
Unknown (did not provide tablet contract)
County said it does not provide this service
Wyoming
Wyoming County Jail
Unknown (did not provide tablet contract)
Unknown (did not provide video contract)
Yates
Unknown (county provided incomplete documentation that leaves details of service unclear)
Yates County Jail/Premises Provider
Yates County Jail/Premises Provider
Appendix 4: When does each county’s contract expire?
Advocates and local politicians can take note of when the current contract in your county is set to expire. Many will automatically renew unless a new contract is sought and negotiated. As you can see, some counties sent contracts that have already expired.
County
Expiration date
Renewal Terms
Notes
Albany
2/11/22
2 one-year options for renewal
Allegany
2014
Automatically renews
The full GTL contract was not provided, though the county’s FOIL response indicates that the initial contract expired in 2014 and has been renewed every year since.
Broome
2/14/22
2 one-year options for renewal
Cattaraugus
5/20/22
Automatically renews
Cayuga
10/28/19
Automatically renews
In response to a request for the current contract on 5/12/2020, the county sent a contract that expired on 10/28/2019.
Chautauqua
5/31/23
Automatically renews
This is a 10-year contract.
Chemung
4/10/22
Automatically renews
Chenango
Unknown (contract was not provided)
Unknown (contract was not provided)
Clinton
10/5/23
Automatically renews
Columbia
12/29/20
Automatically renews
Cortland
5/1/21
Automatically renews
Delaware
10/13/23
Does not specify renewal terms
Dutchess
9/29/20
Automatically renews
The exact end date of this contract is unclear because the effective date (the date that the Agreement is signed by all parties) is unclear. There are no dates accompanying signatures directly; however, the signature page bears a date of 9/29/15 in the bottom left corner. We assumed that this is the effective date.
Erie
9/30/22
2 one-year automatic renewals
Essex
7/1/23
Does not specify renewal terms
Franklin
Unknown
Unknown
Full contracts were not provided; as such, the end date of the contract is unclear. The most recent amendment was signed 9/11/2020.
Fulton
GTL: 10/8/23 Trinity: Unknown
GTL: automatically renews Trinity: Unknown”
Fulton County contracts with GTL for phone services and Trinity for tablets. The agreement with Trinity does not provide an end date. The most recent date of signature on that document is 1/9/2020.
Genesee
Unknown (contract was not provided)
Unknown (contract was not provided)
Full contracts were not provided; as such, the end date of the contract is unclear. The resolution approving Securus’s proposal, which was provided to us, was signed 5/25/2018.
Greene
6/8/14
Automatically renews
Hamilton
Not applicable
Not applicable
In response to a FOIL request, Herkimer County stated that phone calls are free at the county jail and did not provide contracts.
Herkimer
10/25/19
Automatically renews
Jefferson
10/10/17
Automatically renews
Lewis
4/15/23
Does not specify renewal terms
Livingston
GTL: 8/27/2023 Primonics: 7/18/17
Automatically renews
Madison
11/17/21
Automatically renews
Monroe
4/30/25
5 one-year options for renewal
Montgomery
4/13/17
Automatically renews
Montgomery County responded on 9/30/2020 that they did not have a current contract. We obtained a contract that is expired, but automatically renews, from Worth Rises. As of 3/12/2021, rates for Montgomery County were listed on the GTL website.
Nassau
2/7/15
Does not specify renewal terms
In response to a request for the current contract on 7/1/2020, the county sent a contract that expired on 2/7/2015. Nassau County also responded that “no records exist” relating to tablet or video services.
Niagara
6/17/21
Automatically renews
Oneida
GTL: 6/15/2012 Trinity: 4/30/2020
GTL: automatically renews Trinity: Does not specify renewal terms
In response to a request for the current contract on 7/13/2020, the county sent a contract with Trinity for tablets that expired on 4/20/2020. Telmate’s website, as of 3/12/2021, lists that it provides tablets and video here.
Onondaga
12/31/2021
Does not specify renewal terms
Ontario
10/27/23
1 five-year option for renewal
Orange
2/2/16
3 one-year options for renewal
In response to the request for current contracts on 7/10/2020, the county sent a contract that expired on 2/2/2019 at the latest. Orange County responded “N/A no such record” to the request for records relating to tablet and video services. GTL’s website lists that it provides video services as of 3/12/2021.
Orleans
5/31/22
Unclear from the documents provided
Orleans County provided no agreements with service providers. The response stated that the records requested “are trade secrets or are submitted to agency by a commercial enterprise or derived from information obtained from a commercial enterprise and which, if disclosed, would cause substantial injury to the competitive position of the subject enterprise (POL 87(2)(d)).”
Oswego
1/30/22
Automatically renews
Otsego
12/20/16
Automatically renews
Putnam
Either 4/26/24 or 10/22/22
Either automatically renews or 3 one-year automatic renewals
The contract states that the term of the agreement runs until 4/26/2024, though an amendment states that the term of the agreement is extended to 10/22/2022 with 3 one-year renewals.
Rensselaer
12/20/19
Unclear from the documents provided
In response to the request for the current contracts on 3/1/2021, the county sent a contract that expired on 12/20/2019.
Rockland
Unknown (contract was not provided)
Unknown (contract was not provided)
Rockland County responded that Corrections does not keep responsive records. Current rates were listed on both the GTL and Securus websites. GTL is listed on the Rockland County Sheriff’s Office website.
Saratoga
GTL: Unknown Keefe: 9/4/24
GTL: Unknown Keefe: automatically renews
The full GTL contract was not provided; as such, the end date of the contract is unclear. The most recent amendment was signed 3/23/2020.
Schenectady
8/14/20
Automatically renews
Schenectady County did not provide response to our FOIL requests. However, we obtained a contract from MuckRock.com. GTL’s website lists Schenectady County as one of the places it serves.
Schoharie
2/11/25
Automatically renews
Schuyler
3/16/25
Automatically renews
Seneca
8/9/23
Automatically renews
St. Lawrence
2/20/24
Automatically renews
Steuben
2/20/21
Automatically renews
Suffolk
4/30/19
Does not specify renewal terms
Sullivan
5/27/16
Automatically renews
Sullivan County did not provide response to our FOIL requests. However, we obtained a recent contract from MuckRock.com. Securus’s website lists Sullivan County as one of the places it serves.
Tioga
5/19/25
Automatically renews
Tompkins
6/15/23
Automatically renews
Ulster
Unknown (contract was not provided)
Unknown (contract was not provided)
Warren
None
Automatically renews
Some documentation was provided in response to a FOIL request, though the contract itself was not provided.
Washington
4/11/24
Does not specify renewal terms
Wayne
9/11/11
1 two-year option for renewal
Westchester
GTL: 7/31/21 Primonics: 5/14/24
GTL: 1 two-year option for renewal
Wyoming
6/11/24
Automatically renews
Yates
3/16/21
Does not specify renewal terms
Footnotes
This amount was calculated using a conservative estimate of 400 minutes of phone calls per jailed person, per month. This 400-minute estimate was based on the (rounded-down) number of minutes of use at the Albany County Jail from 2019, as well as our previous research into jail phone use. We also assumed an average phone call length of 13 minutes, based on GTL call summaries from 2017. Finally, we determined the average daily population in each jail using reports from the New York State Department of Criminal Justice Services. ↩
You might wonder how private phone companies manage to turn profits in jails, even while paying such a large percentage of phone revenue to the counties in the form of kickbacks. For one, companies charge many additional hidden consumer fees on phone calls that may be exempt from kickbacks. In some instances around the country, this fee harvesting can add up to more than the base, per-minute cost of the call. Secondly, phone companies also make money off other products and services that they bundle together with phone services into a single contract. For example, commission data from Albany County shows that while Securus kicks back a whopping 86% of phone call revenue back to the county, it gives the county just 20% of revenue from video visitation and eMessaging, and 10% of revenue from music, movies, and games. In November and December 2020, according to the commissions report for Albany County, non-phone services amounted to more than three-quarters of Securus’ post-commissions revenue in Albany. These non-phone services often escape regulation and oversight by the FCC and individual states. The bundling of regulated and unregulated services into a single contract thwarts regulators’ ability to set reasonable rates for services, and allows service providers to obscure the amount of unreasonable profits that they collect under a contract, as Stephen Raher notes in his law review article, The Company Store and the Literally Captive Market. (For more on profiteering in the world of prison tablets, see our work on hidden costs in tablet contracts). ↩
A disproportionate number of New York counties use GTL. The likely reason is that the New York State Sheriff’s Association steers counties to GTL in exchange for 3% of every GTL phone call made from a jail in New York State. This kickback — which is not in the county’s contracts — is documented in a 2019 expose in the Rochester Democrat and Chronicle. This long-standing arrangement dates back more than 20 years, as described in this 2006 settlement with the Office of the Attorney General of the State of New York, where the Sheriff’s Association was criticized for not disclosing its financial interest in the awarding of contracts to its then-preferred vendor, AT&T. (AT&T’s jail phone business was acquired by Global Tel*Link in 2005.)
Other researchers should note that the New York State Sheriff’s Association apparently has GTL funnel the money through a for-profit corporation it controls, “Star Governmental” (see paragraph 26 in the 2006 settlement linked above) which then pays the Sheriff’s Association. These funds are substantial. According to the non-profit tax returns of the New York State Sheriff’s Association, the Association receives approximately $460,000 per year in royalties from Star Governmental ($434,884 in 2016, $458,681 in 2017, $487,112 in 2018). ↩
New York City is not the only jurisdiction that has made phone calls free. New York’s Monroe County, home to Rochester — which already reduced phone calls to the relatively affordable cost of 10 cents a minute in 2019 — voted in March 2021 to use its phone commission fund to provide 75 minutes of free calls to each person in the jail each week; 30 of the minutes can be used on video calls. These free calls will save families an estimated $30 a month. And this trend is not confined to New York: San Francisco County made jail calls free in 2020, and in March 2021, the San Diego County Board of Supervisors voted to do the same. ↩
We explain the research showing that violent crimes against Black Americans - especially those in poverty - are less likely to be cleared by police and less likely to receive news coverage than similar crimes against white people.
Of 89 criminal cases recently solved with the growing but controversial use of genetic genealogy databases — all following the highly-publicized arrest of the Golden State Killer in 2018 — just four were crimes perpetrated against a Black victim. Cases solved with genetic genealogy, as a recent Atlantic article notes, “tended to be notorious crimes” that stuck in the public memory, where evidence was maintained for years and news coverage was widespread.
This racial disparity should be surprising — after all, Black people are more likely to be victims of homicide than people of other races, and are in fact more likely to experience violent crime in general.1 But the lack of “notorious” unsolved crimes involving Black victims is part of a larger American problem: the devaluing of the lives and experiences of Black, indigenous, and other people of color (BIPOC), as evidenced by clear racial disparities in crime victimization.
The research shows that not only are Black Americans – especially those in poverty – disproportionately victims of crime, but that crimes against Black people are less likely to be cleared by police and less likely to receive news coverage than crimes against white people. What’s more, crimes with Black victims are also more likely to be deemed “justifiable” by the courts. In this briefing, we highlight and discuss research findings about those disparities.
Crimes against Black and Latinx people are less likely to be solved
When crimes occur, police are more likely to clear cases in which the victims were white. In a 2018 Washington Post analysis of nearly 50,000 homicides around the country, the authors found that an arrest was made in 63 percent of murders of white victims, compared to 48 percent of those with Latinx victims and 46 percent with Black victims. And within cities throughout the country, the data revealed significant disparities in murder arrest rates between neighborhoods. Low arrest rates in disadvantaged and racially segregated areas both reflect and contribute to broader racial disparities, and as the article notes, “perpetrate cycles of violence in low-arrest areas.”
The journalists note that some of the disparity in arrest rates may stem from the fact that — due to a long history of racist policing — members of comunities of color may be less likely to trust and cooperate with police. An additional factor may be that homicides involving firearms — which are used disproportionately in murders of Black victims — are less likely to be solved, regardless of the race of the victim.2 However, these contributing factors do not explain the overall disparate experiences of violent victimization between BIPOC and white Americans.
Disparities in news coverage
Crimes against Black people are also less likely to receive media attention. A 2020 analysis of all news coverage of the 762 homicides in Chicago in 2016 found that where a crime occurred contributed to its perceived newsworthiness. Murders in predominantly Black neighborhoods received less coverage than those in white neighborhoods. What’s more, the authors noted, “Those killed in predominantly Black or Hispanic neighborhoods are also less likely to be discussed as multifaceted, complex people.” To measure this, researchers counted the number of times articles described victims in terms of their roles in the community (such as spouse, grandchild, friend, or volunteer), instead of focusing simply on the details of the crime.
The lack of media attention to crimes involving victims of color may actually explain some of the difference in police clearance rates. News coverage can help make people aware that a crime occurred, lead to information from the public, and keep pressure on police departments. For example, the media and public obsession over certain crimes, dubbed the “Missing White Woman Syndrome,” can mean less attention is given to cases of missing Black people.
Disproportionate use of Stand Your Ground laws
Even when a homicide does lead to an arrest, courts are more likely to deem homicides with Black victims “justified” than when the victims are white.
Since Florida enacted its “Stand Your Ground” law in 2005, allowing people to use lethal force if they believe they are in danger, 27 other states have passed similar statutes (an additional eight are Stand Your Ground states by legal precedent or jury instruction). In a 2015 analysis of all homicide cases in Florida from 2005 to 2013 where “Stand Your Ground” was invoked as a defense, the authors found that, after controlling for other variables, defendants were twice as likely to be convicted if the case involved white victims. Another study, which considered nationwide homicide data from 2005 to 2010, found that 11.4% of homicides with a white perpetrator and a Black victim were ruled justified, compared to 1.2% of cases where a Black person killed a white victim. This disparity existed in both states that did and did not have Stand Your Ground laws, but was greater in states with the laws.
Research shows that the cards are stacked against Black victims of crime. Not only are they more likely to experience crime in the first place, but those crimes are less likely to be publicly covered in the media and solved by police, and more likely to be ruled justified. As the authors of the analysis of homicide news coverage in Chicago noted, “Whereas the loss of White lives is seen as tragic, the loss of Black and Hispanic lives is viewed as normal, acceptable, even inevitable.”
Footnotes
Using data from the 2018 National Crime Victimization Survey, Anna Harvey and Taylor Mattia found that Black survey respondents were 22% more likely to experience a serious violent crime than non-Hispanic white respondents. When property crimes were included, the disparity rose to 41%. (In a similar fall 2020 report, the Bureau of Justice Statistics (BJS) did not find racial disparities in crime victimization in 2018. One major difference between the studies was that the BJS included simple assaults in its analysis, which Harvey and Mattia did not. Notably, neither study includes homicide in its analysis.) Another study found that the 2017 homicide victimization rate for Black Americans was 20.42 per 100,000, compared to 5.2 nationally. And as we know, Black people are more than twice as likely as people of other races to be killed by police, even in situations where there are no obvious circumstances that would make the use of deadly force “reasonable.”
A major contributing factor to this higher rate of violent victimization is that Black people are twice as likely as white people to live below the poverty line. A Bureau of Justice (BJS) report found that, from 2008 to 2012, both Black and white people living in households below the poverty line are more likely to experience violent victimization than those in low, middle, and high income households. And as The Guardian noted in an article mapping gun violence across the country, gun homicides are extremely concentrated in areas of high poverty, low educational attainment, and “neighborhoods forged out of racial segregation.” ↩
According to 2019 FBI data, 83.8% of homicides of Black people involved a gun, compared to 61.8% of homicides of white people and 73.2% of all homicides. Murders involving firearms are often more difficult to solve for a varity of reasons, including the physical distance between shooter and victim, which often leaves less evidence. Regardless of the victim’s race, police are less likely to identify the perpetrator in gun-related homicides. ↩
A new BJS report shows that U.S. jails reduced their populations by 25% in the first few months of the pandemic. But even then, the U.S. was still putting more people in local jails than most countries incarcerate in total.
Last week, the Bureau of Justice Statistics released two reports with updates on city and county jail populations nationwide: Jail Inmates in 2019 and Impact of COVID-19 on the Local Jail Population, January-June 2020. After a year of upheaval due to the pandemic, the first report is already out-of-date and mainly useful as a historical document. The second report, however, answers some important questions about the decisions local officials made when the high stakes of jail incarceration – for individual and public health – were put into stark relief by the pandemic. Their decisions, and the resulting jail population changes in the first half of 2020, hold important lessons for ongoing and future decarceration efforts; here we outline some of those lessons – the good, the bad, and the ugly.
The good: Significant drops in jail detention early on, and especially for low-level offenses and among women
First, we saw that local law enforcement, courts, and jails were able to quickly reduce jail populations when they had to. Before the pandemic, jails nationwide held almost 742,000 people on any given day, and over the course of the year, there were 10.3 million jail admissions. But by the end of June 2020, the jail population had dropped by 25%; 185,000 fewer people were held in jails in June 2020 compared to June 2019. Most of that change occurred in the first half of 2020, largely fueled by decreasing admissions and, to a lesser extent, by expedited releases due to the pandemic. In the one-year period ending June 30, 2020, there were 1.67 million fewer jail admissions – a 16% drop compared to the preceding year. Of those who were booked into jails between March 1 and June 30, 2020, 208,500 (almost 9%) received an expedited release in response to COVID-19.
Second, we saw that when pressed, local criminal justice systems did shift toward some of the common-sense changes that reform advocates have long called for (at least temporarily): eliminating unnecessary arrests and incarceration for offenses and violations that don’t threaten public safety, and ending pretrial detention for most, if not all, defendants.
Early in the pandemic, many police departments were encouraged to use arrest as “a tool of last resort,” reducing stops, shifting to citations in lieu of arrest, and adopting other best practices. At the same time, many courts took action to reduce admissions and pretrial detention. For example, Maine state courts vacated all outstanding bench warrants for unpaid court fines and fees and for failure to appear, and California reduced bail to $0 for most low-level offenses. Jail administrators and sheriffs, too, found ways to reduce detention: The Cuyahoga County (Cleveland, Ohio) Jail, for example, stopped admitting people on new misdemeanor charges, except for domestic violence charges.
The BJS Impact of COVID-19 report shows that these local efforts made a difference: The number of people held for misdemeanors dropped by 45% by June 2020 compared to 2019, and the number of people held pretrial dropped by 21% – or about 100,000 people – over the same period. As we have argued before, incarceration is especially counterproductive for people convicted of low-level offenses like misdemeanors, as it cuts people off from their families, housing, and jobs while yielding virtually no benefits to public safety.
The bad: Jail reductions didn’t go far enough, and quickly ticked back up
Of course, the Impact of COVID-19 report also reveals some disturbing jail trends during the pandemic. First, local justice systems could and should have done more to further depopulate jails, where social distancing is impossible and the flow of people in and out of facilities puts everyone around them, incarcerated or not, at greater risk. Even after reducing admissions and increasing releases, a significant number of jails were still overcrowded: average jail occupancy rate fell from 81% to 60% from 2019 to 2020, but in June 2020, 1 in 14 jails still held over 100% of their rated capacity.
Furthermore, despite its 25% decline in jail populations, the U.S. jail incarceration rate alone (that is, excluding people held in state and federal prisons) still far exceeds international norms. After cutting jail populations during the early months of the pandemic, the U.S. still locked up more people per capita in jails alone than most countries do in any type of confinement facilities. At the end of June 2020, 167 per 100,000 U.S. residents were held in local jails; that’s still well over the totalincarceration rates of peer countries like the U.K., Canada, and France.
It’s easy to see where jail decarceration efforts fell short. In particular, jails could have gone much further in reducing the number of people held pretrial. While it’s good that the number of people held pretrial declined by 21%, 381,000 people were still held pretrial at the end of last June. The percentage of people held in local jails pretrial (69%) was actually higher than at the same time a year before (65% in June 2019). As a reminder, people held pretrial are unconvicted and legally presumed innocent. While some defendants are detained because a court deems them a significant safety or non-appearance risk, many are there simply because they cannot afford to pay cash bail. During normal times pretrial detention has detrimental effects on defendants’ employment, health, housing, financial stability, and family wellbeing,but especially during a pandemic, pretrial detention can also be fatal. For example, two Texas men, aged 64 and 57 (one experiencing homelessness at the time of his arrest), recently died while being held pretrial in the Harris County Jail on $1,000 and $1,500 bonds, respectively. One of them died of COVID-19.
Finally, the BJS report confirms the rebound in jail populations starting in May 2020 that weidentifiedpreviously using a different data set – indicating that more dramatic population reductions were possible, but efforts were not sustained, with local justice systems only too eager to return to “business as usual.” Jail populations declined by 190,800 (27%) between the end of February and the end of April alone, but in May and June, populations ticked back up by 29,600, essentially undoing over 15% of the cuts achieved before May. This finding is in line with our research showing that jail populations nationwide have been creeping up since late spring. While populations are still lower than they were pre-pandemic, the data suggests the early reforms instituted to mitigate COVID-19 have largely been abandoned. With most people in local jails still unvaccinated, this has put vast numbers of people at enormous and unnecessary risk for COVID-19.
The ugly: Racial disparities in jail incarceration widened during the pandemic
One especially troubling finding in the Impact of COVID-19 report: The decrease in jail populations did nothing to address the glaring racial disparities in jails. In fact, while the total jail population dropped by 25% between June 2019 and June 2020, racial disparities increased over the same period. In June of 2019, Black people were incarcerated in jails at about 3.3 times the rate of white people; a year later, the racial gap had widened so that Black people were jailed at 3.5 times the rate of white people. Moreover, the decrease in white jail incarceration outpaced the decreases among Black, Hispanic, Asian, Native Hawaiian/Pacific Islander, and multi-racial people. For example, the number of white people in jails dropped by almost 28% while the number of Black people in jails fell by only 22%. These findings reflect the dangers of not centering racial justice in decarceration. It is not enough to focus only on “reducing incarceration” – decarceration efforts must also address long-standing racial disparities and should never make the criminal justice system less equitable.
In all, the BJS Impact of COVID-19 report proves that local and state justice systems can quickly and significantly reduce jail populations, as shown by the initial responses to COVID-19 – but it also shows that they could have diverted from jail or released far more people, and far more equitably. Although jail populations dropped significantly at the beginning of the pandemic, these changes did not reduce racial disparities in incarceration, nor did they sufficiently reduce pretrial detention. Even after reducing jail populations, the U.S. jail incarceration rate still greatly exceeds that of our peer countries, and more recent data suggests that jail populations have been increasing steadily since late spring.
Moving forward, justice system authorities should make permanent the strategies that led to the jail reductions achieved during the pandemic, and push themselves to go further now that they have seen what is possible. The number of people jailed for misdemeanors or held pretrial, as well as the number of women in jails, should never return to pre-pandemic levels. Finally, states and counties must take deliberate action to eliminate racial disparities in jails as they take the next steps toward decarceration.
April 15-17, 2025: Sarah Staudt, our Director of Policy and Advocacy, will be attending the MacArthur Safety and Justice Challenge Network Meeting from April 15-17 in Chicago. Drop her a line if you’d like to meet up!
Not near you? Invite us to your city, college or organization.
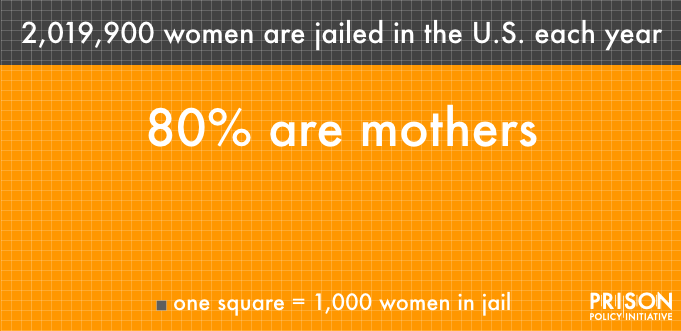 Estimates have been rounded for this graphic. Sources: Federal Bureau of Investigation,