Native incarceration in the U.S.
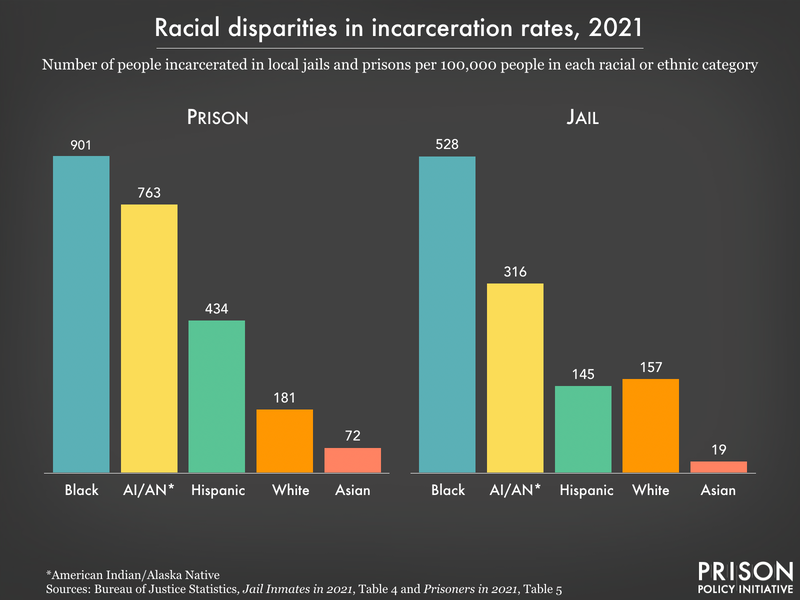
In the United States, Native people1 are vastly overrepresented in the criminal legal system. Native people are incarcerated in state and federal prisons at a rate of 763 per 100,000 people. This is double the national rate (350 per 100,000) and more than four times higher than the state and federal prison incarceration rate of white people (181 per 100,000). These disparities exist in jails as well, with Native people being detained in local jails at a rate of 316 per 100,000. Nationally, the incarceration rate in local jails is 192 per 100,000, and for white people, the jail incarceration rate is 157 per 100,000.2
Native people are overrepresented in prisons and jails
The latest incarceration data, however, shows that American Indian and Alaska Native people have high rates of incarceration in both jails and prisons as compared with other racial and ethnic groups. In jails, Native people have more than double the incarceration rate of white people, and in prisons this disparity is even greater.
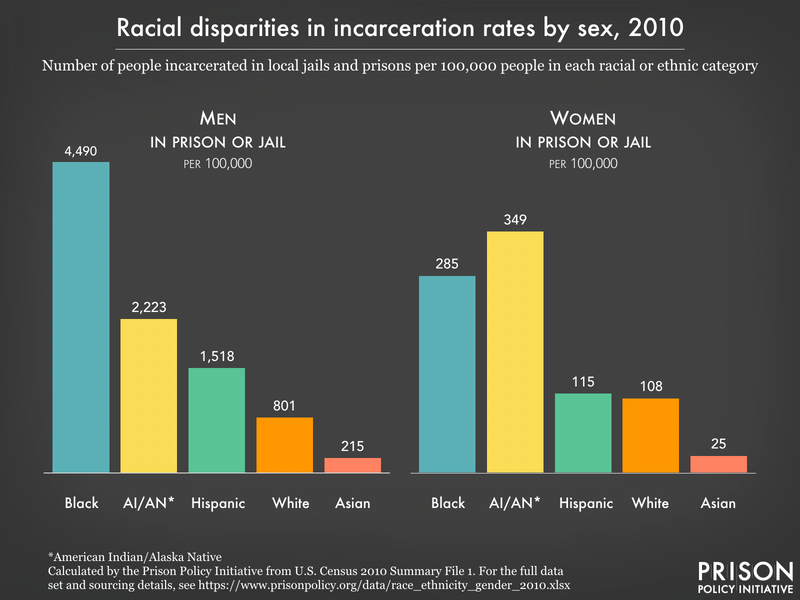
Native women are particularly overrepresented in the incarcerated population: They made up 2.5% of women in prisons and jails in 2010, the most recent year for which we have this data (until the 2020 Census data is published); that year, Native women were just 0.7% of the total U.S. female population.3 Their overincarceration is another maddening aspect of our nation’s contributions to human rights crises facing Native women, including the crisis of Missing and Murdered Indigenous Women (MMIW) and high rates of sexual and other violent victimization.4
Indian country jails
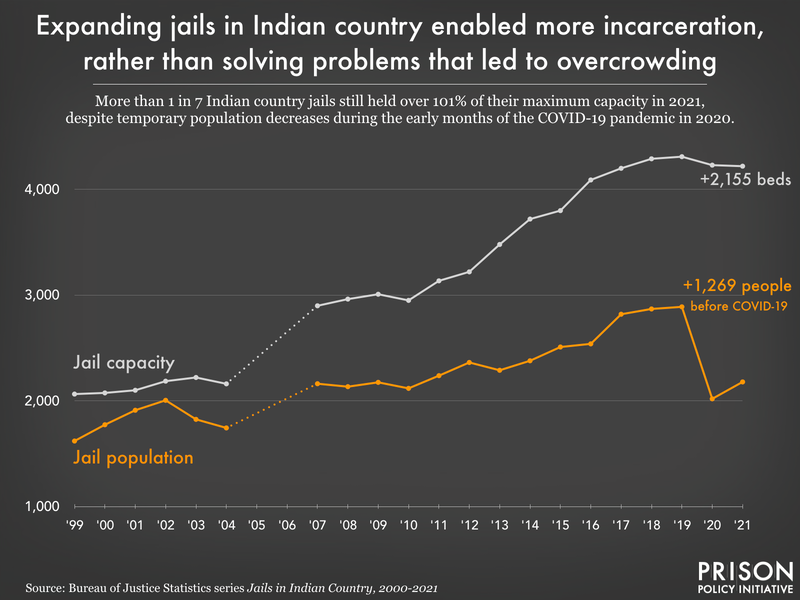
In addition to prisons and local jails, there are nearly 2,500 people in Indian country jails. The term “Indian country,” in this context, is a legal term referring to land within American Indian reservations and other Native communities and allotments.5 The Bureau of Justice Statistics collects and publishes data about jail facilities on these lands separately from other locally-operated jails in the U.S.. However, there is no available data on the race or ethnicity of people jailed in Indian country facilities, leaving us with little information about just who is included in the nearly 2,500 people in Indian country jails.
The rapid expansion of jail space in Indian country — that is, on tribal lands — holds with a recent nationwide trend. Jail populations have skyrocketed over the past three decades, leading first to overcrowding, and then to sheriffs announcing that they need to build more or bigger jails to alleviate overcrowding. But as we’ve previously discussed, while new jails might make existing jails less crowded in the short term, they can enable more incarceration in the long term. And in Indian country, it appears that they have:
At least 29,415 Native people are behind bars
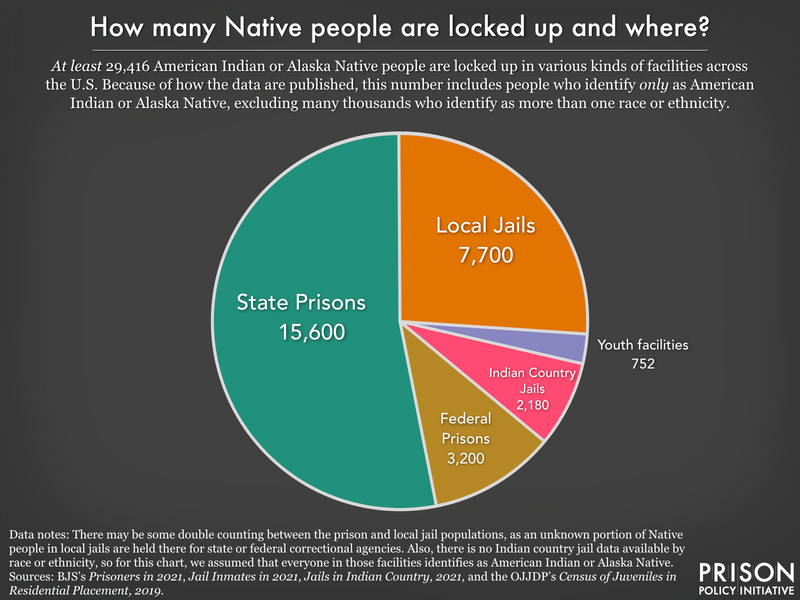
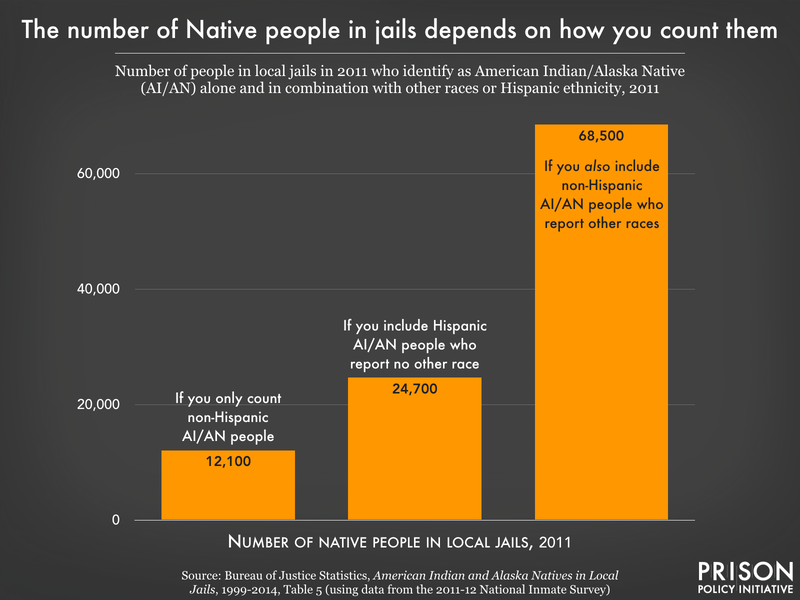
Again, the numbers in the chart above very likely undercount the population of confined people who identify as American Indian or Alaska Native, because so many Native people identify as more than one race or ethnicity (see “Understanding the flawed data” above).
Additionally, the number of Native people impacted by county, city, and Indian country jails in the United States is much larger than the chart above would suggest, because people cycle through local jails relatively quickly. For example, in just one month — June 2021 — 5,780 people were booked into Indian country jails.
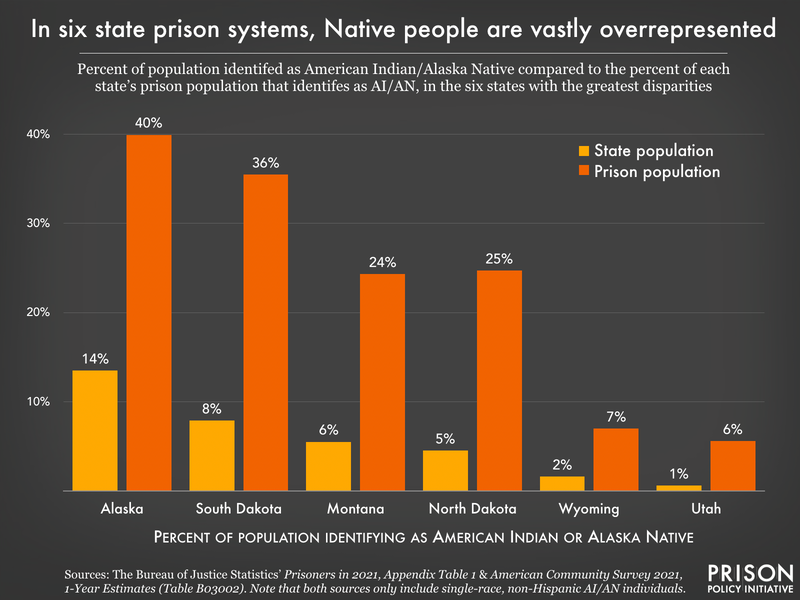
Across the country, Native people are overrepresented in state prisons, but six states show the greatest disparities:
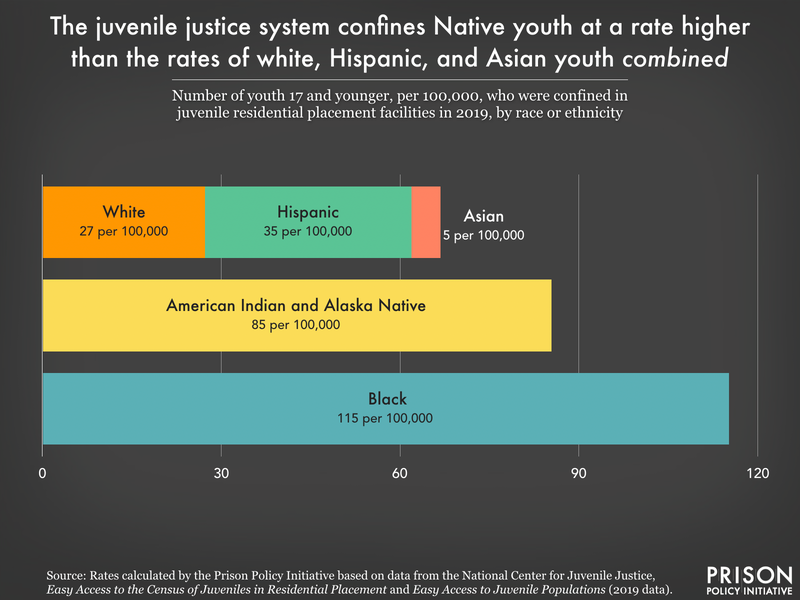
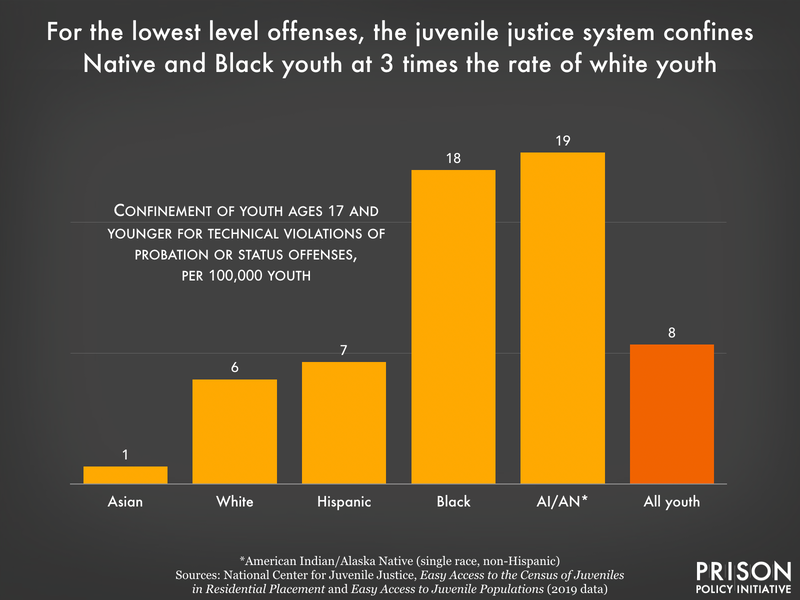
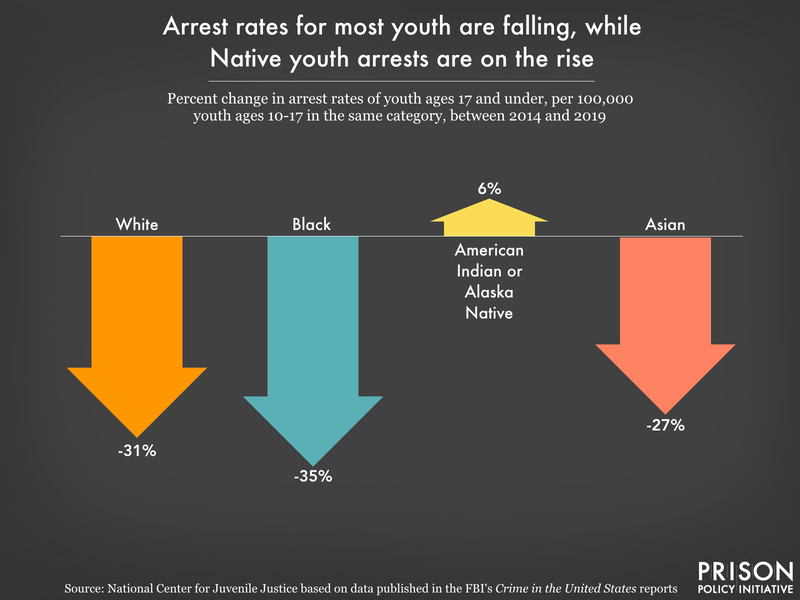
Native youth, in particular, are facing a crisis of incarceration
The U.S. criminal legal system is more than just prisons and jails: More than half of Native people under correctional control are under community supervision (probation or parole)
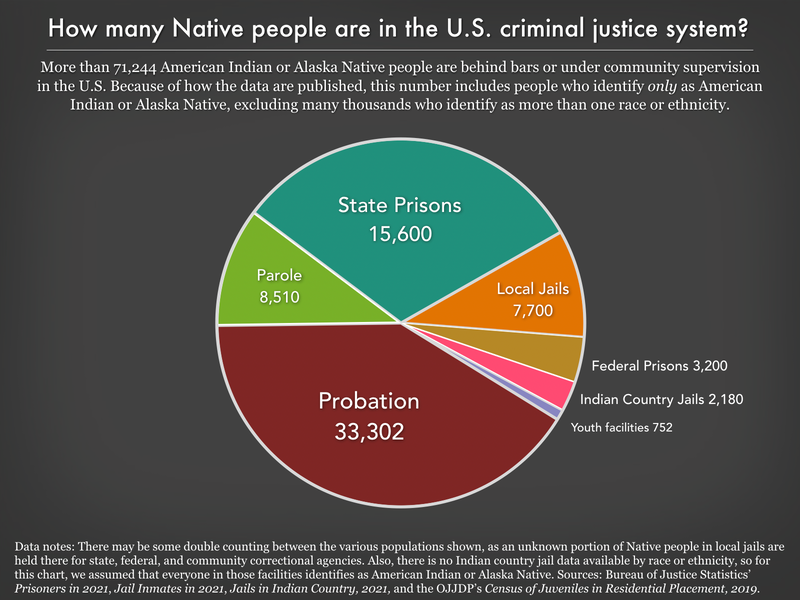
Again, the numbers in the chart above very likely undercount the population of confined people who identify as American Indian or Alaska Native, because so many Native people identify as more than one race or ethnicity (see “Understanding the flawed data” above).
Briefings about Native people in the criminal legal system:
- Who is jailed, how often, and why: Our Jail Data Initiative collaboration offers a fresh look at the misuse of local jails, by Emily Widra and Wendy Sawyer, November 27, 2024
Using a novel data source, we examine the flow of individuals booked into a nationally-representative sample of jails along lines of race, ethnicity, sex, age, housing status, and type of criminal charge. - New, expanded data on Indian country jails show concerning trends extend to tribal lands, by Emily Widra, October 8, 2024
In this briefing, we look at data that shows in Indian country jails, populations have rebounded from pandemic lows, the detention of women and older adults is increasing, and new offense type data raise questions about why so many people are incarcerated on tribal lands. - The U.S. criminal justice system disproportionately hurts Native people: the data, visualized, by Leah Wang, October 8, 2021
We offer a roundup of what we know about Native people who are impacted by prisons, jails, and police, and about the persistent gaps in data collection and disaggregation that hide this layer of racial and ethnic disparity. - New BJS data reveals a jail-building boom in Indian country, by Emily Widra, Wanda Bertram, and Wendy Sawyer, October 30, 2020
Across the country, local governments are building more jail space rather than working to reduce incarceration. New data shows that this trend is especially visible on tribal lands. - Since you asked: What data exists about Native American people in the criminal justice system?, by Roxanne Daniel, April 22, 2020
Problems with data collection — and an unfortunate tendency to group Native Americans together with other ethnic and racial groups in data publications — have made it hard to understand the effect of mass incarceration on Native people.
Footnotes
We are discussing the impact of the criminal legal system on people identified by the Census Bureau as “American Indian/Alaska Native.” ↩
The vast disparities in incarceration did not happen in a vacuum: for an overview of the historical roots of these inequities — and some proposed solutions — see the 2023 report from the Safety and Justice Challenge, Over-incarceration of Native Americans: Roots, inequities, and solutions. ↩
The number of Native women in both the U.S. population and the incarcerated population (defined as non-Hispanic, single-race females) was sourced from the 2010 U.S. Census. ↩
The “jurisdictional maze” between federal and tribal authorities (described earlier in this briefing) makes it less likely that a crime of sexual violence occurring on tribal land will be prosecuted, leaving victims with little support and little choice but to continue living near those who harm them. ↩
While the term “Indian country” (with a lowercase “c”) is a legal term, according to the National Congress of American Indians (NCAI), the term “Indian Country” — with a capital “C” — “is used with positive sentiment within Native communities, by Native-focused organizations such as NCAI, and news organizations such as Indian Country Today.” ↩
