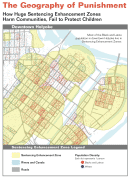
The Geography of Punishment:
How Huge Sentencing Enhancement Zones Harm Communities, Fail to Protect Children
by Aleks Kajstura, Peter Wagner, and William Goldberg
Prison Policy Initiative
July 2008
Section:
Appendix C. Demographic analysis of cities and towns in Hampden County.
| Total | Percent | |||||||||||||
|---|---|---|---|---|---|---|---|---|---|---|---|---|---|---|
| Population | White | Black | Latino | Without a high school diploma or GED (25 year or older) | In poverty | In poverty, under 5 | White | Black | Latino | Without a high school diploma or GED (25 years or older) | In poverty | In poverty, under 5 | ||
| Agawam | 28,144 | 26,871 | 295 | 514 | 2,513 | 1,537 | 138 | 95.5% | 1.0% | 1.8% | 12.5% | 5.6% | 9.1% | |
| Blandford | 1,214 | 1,195 | 7 | 4 | 96 | 41 | 0 | 98.4% | 0.6% | 0.3% | 11.4% | 3.4% | 0% | |
| Brimfield | 3,339 | 3,241 | 18 | 43 | 323 | 145 | 5 | 97.1% | 0.5% | 1.3% | 14.4% | 4.4% | 2.5% | |
| Chester | 1,308 | 1,279 | 4 | 17 | 113 | 76 | 4 | 97.8% | 0.3% | 1.3% | 13.0% | 5.8% | 5.6% | |
| Chicopee | 54,653 | 47,478 | 1,305 | 4,790 | 9,473 | 6,608 | 469 | 86.9% | 2.4% | 8.8% | 25.1% | 12.3% | 16.9% | |
| East Longmeadow | 14,100 | 13,662 | 125 | 130 | 944 | 477 | 18 | 96.9% | 0.9% | 0.9% | 9.6% | 3.4% | 2.3% | |
| Granville | 1,521 | 1,492 | 5 | 10 | 78 | 51 | 0 | 98.1% | 0.3% | 0.7% | 7.7% | 3.4% | 0% | |
| Hampden | 5,171 | 5,060 | 13 | 33 | 365 | 112 | 0 | 97.9% | 0.3% | 0.6% | 10.3% | 2.2% | 0% | |
| Holland | 2,407 | 2,317 | 6 | 34 | 273 | 174 | 11 | 96.3% | 0.2% | 1.4% | 17.0% | 7.3% | 7.8% | |
| Holyoke | 39,838 | 21,508 | 1,187 | 16,485 | 7,341 | 10,082 | 1,410 | 54.0% | 3.0% | 41.4% | 30.0% | 26.4% | 47.8% | |
| Longmeadow | 15,633 | 14,793 | 117 | 170 | 435 | 312 | 0 | 94.6% | 0.7% | 1.1% | 4.0% | 2.1% | 0% | |
| Ludlow | 19,549 | 18,980 | 87 | 302 | 3,674 | 1,238 | 89 | 97.1% | 0.4% | 1.5% | 24.8% | 6.4% | 8.9% | |
| Monson | 8,359 | 8,098 | 64 | 98 | 950 | 450 | 52 | 96.9% | 0.8% | 1.2% | 16.7% | 5.6% | 10.1% | |
| Montgomery | 654 | 639 | 0 | 5 | 32 | 19 | 0 | 97.7% | 0% | 0.8% | 7.0% | 2.9% | 0% | |
| Palmer | 12,497 | 12,024 | 115 | 154 | 1,710 | 975 | 103 | 96.2% | 0.9% | 1.2% | 20.1% | 7.9% | 15.2% | |
| Russell | 1,657 | 1,603 | 7 | 25 | 184 | 149 | 13 | 96.7% | 0.4% | 1.5% | 16.5% | 9.0% | 13.4% | |
| Southwick | 8,835 | 8,502 | 63 | 152 | 910 | 537 | 52 | 96.2% | 0.7% | 1.7% | 15.3% | 6.1% | 9.6% | |
| Springfield | 151,854 | 74,291 | 31,780 | 41,303 | 24,173 | 33,772 | 4,561 | 48.9% | 20.9% | 27.2% | 26.6% | 23.1% | 40.1% | |
| Tolland | 426 | 413 | 5 | 5 | 42 | 18 | 0 | 96.9% | 1.2% | 1.2% | 12.8% | 4.2% | 0% | |
| Wales | 1,737 | 1,692 | 15 | 11 | 175 | 60 | 2 | 97.4% | 0.9% | 0.6% | 14.7% | 3.5% | 1.9% | |
| West Springfield | 27,899 | 24,673 | 628 | 1,605 | 3,851 | 4,234 | 481 | 88.4% | 2.3% | 5.8% | 15.1% | 11.3% | 19.0% | |
| Westfield | 40,072 | 36,893 | 427 | 2,008 | 3,121 | 3,278 | 363 | 92.1% | 1.1% | 5.0% | 16.3% | 11.9% | 21.9% | |
| Wilbraham | 13,473 | 12,873 | 190 | 189 | 687 | 679 | 28 | 95.5% | 1.4% | 1.4% | 7.4% | 5.1% | 3.7% | |
| Hampden County | 454,340 | 339,577 | 36,463 | 68,087 | 61,463 | 65,024 | 7,799 | 74.7% | 8.0% | 15.0% | 20.8% | 14.7% | 26.8% | |
Recommended Reading:

Advocacy Toolkit
Resources, tips, and best practices to help advocates working to end mass incarceration.

50 state incarceration profiles
All of our recent reports about prison/jail growth, racial disparities, and more, re-organized by state.

Mass Incarceration: The Whole Pie
The U.S. incarcerates nearly 2 million people. Where are they locked up and why? Read our report.

Events
- April 15-17, 2025:
Sarah Staudt, our Director of Policy and Advocacy, will be attending the MacArthur Safety and Justice Challenge Network Meeting from April 15-17 in Chicago. Drop her a line if you’d like to meet up!
Not near you?
Invite us to your city, college or organization.