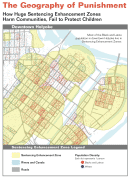
The Geography of Punishment:
How Huge Sentencing Enhancement Zones Harm Communities, Fail to Protect Children
by Aleks Kajstura, Peter Wagner, and William Goldberg
Prison Policy Initiative
July 2008
Section:
Appendix F. Demographic analysis of the populations living in enhancement zones, by House district.
| District demographics in Hampden County | Populations in the zones | Percent of population living in a zone | ||||||||||
|---|---|---|---|---|---|---|---|---|---|---|---|---|
| Population | White | Black | Latino | Total | White | Black | Latino | Total | White | Black | Latino | |
| 1st Hampden | 19,980 | 19,274 | 154 | 242 | 3,134 | 3,017 | 28 | 31 | 15.7% | 15.7% | 18.1% | 12.7% |
| 2nd Hampden | 41,286 | 38,629 | 664 | 979 | 9,871 | 8,797 | 303 | 428 | 23.9% | 22.8% | 45.6% | 43.7% |
| 3rd Hampden | 40,157 | 38,468 | 370 | 701 | 7,873 | 7,552 | 62 | 141 | 19.6% | 19.6% | 16.9% | 20.1% |
| 4th Hampden | 40,072 | 36,893 | 427 | 2,008 | 11,697 | 10,452 | 134 | 867 | 29.2% | 28.3% | 31.3% | 43.2% |
| 5th Hampden | 39,838 | 21,508 | 1,187 | 16,485 | 23,322 | 9,730 | 742 | 12,475 | 58.5% | 45.2% | 62.5% | 75.7% |
| 6th Hampden | 40,846 | 35,884 | 969 | 2,763 | 13,356 | 11,702 | 315 | 898 | 32.7% | 32.6% | 32.5% | 32.5% |
| 7th Hampden | 29,849 | 27,198 | 1,064 | 1,162 | 7,061 | 6,210 | 254 | 401 | 23.7% | 22.8% | 23.8% | 34.5% |
| 8th Hampden | 38,016 | 32,204 | 1,026 | 3,987 | 13,007 | 10,437 | 493 | 1,812 | 34.2% | 32.4% | 48.0% | 45.5% |
| 9th Hampden | 40,859 | 26,709 | 5,298 | 7,927 | 13,846 | 9,137 | 1,514 | 2,838 | 33.9% | 34.2% | 28.6% | 35.8% |
| 10th Hampden | 37,732 | 11,108 | 5,379 | 19,799 | 23,148 | 6,586 | 3,402 | 12,257 | 61.3% | 59.3% | 63.2% | 61.9% |
| 11th Hampden | 40,461 | 11,684 | 17,675 | 10,121 | 25,138 | 6,223 | 11,068 | 7,256 | 62.1% | 53.3% | 62.6% | 71.7% |
| 12th Hampden | 41,642 | 36,492 | 2,234 | 1,882 | 10,642 | 9,094 | 604 | 609 | 25.6% | 24.9% | 27.0% | 32.3% |
| 1st Hampshire | 654 | 639 | 0 | 5 | 0 | 0 | 0 | 0 | 0% | 0% | n/a | 0% |
| 4th Berkshire | 2,948 | 2,887 | 16 | 26 | 226 | 220 | 2 | 1 | 7.6% | 7.6% | 11.3% | 3.1% |
| Hampden County | 454,340 | 339,577 | 36,463 | 68,087 | 162,321 | 99,155 | 18,919 | 40,011 | 35.7% | 29.2% | 51.9% | 58.8% |
District descriptions
- 1st Hampden:
- Palmer, Brimfield, Wales, Holland and parts of Worcester and Hampshire counties.
- 2nd Hampden:
- Monson, Hampden, Longmeadow, and parts of East Longmeadow and Springfield.
- 3rd Hampden:
- Russell, Granville, Southwick and Agawam.
- 4th Hampden:
- Westfield.
- 5th Hampden:
- Holyoke.
- 6th Hampden:
- West Springfield, parts of Chicopee and Springfield.
- 7th Hampden:
- Ludlow, parts of Chicopee and Springfield and Hampshire County.
- 8th Hampden:
- Parts of Chicopee.
- 9th Hampden:
- Parts of Chicopee and Springfield.
- 10th Hampden:
- Parts of Springfield.
- 11th Hampden:
- Parts of Springfield.
- 12th Hampden:
- Parts of East Longmeadow and Springfield.
- 1st Hampshire:
- Montgomery and parts of Hampshire County not included in this analysis.
- 4th Berkshire:
- Blandford, Chester, Tolland and parts of Berkshire County not included in this analysis.
Recommended Reading:

Why are calls from prisons and jails so expensive?
We look at the progress in the fight for phone justice and what comes next.
Research Library
We curate a searchable database of 4,000+ original research reports, organizing each entry by topic and adding brief summaries.

Mass Incarceration: The Whole Pie
The U.S. incarcerates nearly 2 million people. Where are they locked up and why? Read our report.

Bad Behavior
This national report explains how prison disciplinary policies manufacture misconduct and severly punish incarcerated people.
Events
- April 15-17, 2025:
Sarah Staudt, our Director of Policy and Advocacy, will be attending the MacArthur Safety and Justice Challenge Network Meeting from April 15-17 in Chicago. Drop her a line if you’d like to meet up!
Not near you?
Invite us to your city, college or organization.