Who is jailed, how often, and why: Our Jail Data Initiative collaboration offers a fresh look at the misuse of local jails
Using a novel data source, we examine the flow of individuals booked into a nationally-representative sample of jails along lines of race, ethnicity, sex, age, housing status, and type of criminal charge.
by Emily Widra and Wendy Sawyer, November 27, 2024
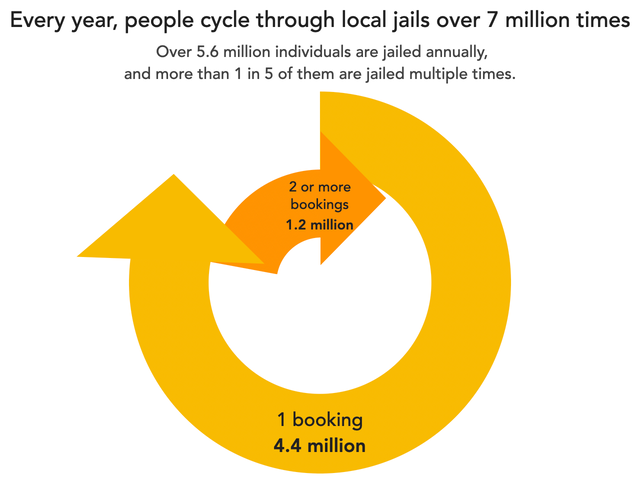
Millions of people are arrested and booked into jail every year, but existing national data offer very little information about who these people are, how frequently they are jailed, and why they are jailed. Fortunately, we now have new data through a collaboration with the Jail Data Initiative to help answer these questions: In 2023, there were 7.6 million jail admissions; but 1 in 4 of these admissions was someone returning to jail for at least the second time that year. Based on the Jail Data Initiative data, we estimate that over 5.6 million unique individuals are booked into jail annually1 and about 1.2 million are jailed multiple times in a given year. Further analysis reveals patterns of bookings — and repeat bookings in particular — across the country: The jail experience disproportionately impacts Black and Indigenous people, and law enforcement continues to use jailing as a response to poverty and low-level “public order” offenses.
We first looked into these questions about repeat jail bookings in our 2019 report, Arrest, Release Repeat: How police and jails are misused to respond to social problems. In particular, our 2019 analysis found that repeated arrests are related to race and poverty, as well as high rates of mental illness and substance use disorders. While these new data don’t include as many contextual details as the survey we used in that analysis, the Jail Data Initiative data offer a more accurate accounting of unique versus repeat jail bookings — a number that the Bureau of Justice Statistics still does not collect or report. Our two analyses are not directly comparable: Our 2019 report uses data from a public health survey, the National Survey of Drug Use and Health, while the Jail Data Initiative data we use here are collected directly from online local jail records and updated daily.23 As a result, these reports have different strengths: this analysis can provide more accurate jail booking data because of the much larger sample size, while Arrest, Release, Repeat offers more descriptive data about people who have been jailed, including details regarding health, education, and income.
More than 1 in 5 people are jailed multiple times a year
While unique jail admissions (the number of individual people admitted to jail) account for three-quarters of jail bookings, more than 1 in 5 people (22%) booked into jail are booked again within 12 months. People who are jailed multiple times a year inevitably face exacerbated consequences of incarceration: As we have discussed before, there is no “safe” way to jail a person, nor is there an amount of time a person can be detained without escalating short- and long-term risks to themselves, their families, and their communities, including rearrest, legal debt, missed work, lost jobs, and health risks.
Racial disparities in jail admissions extend to repeat bookings
Black people are overrepresented in every part of the criminal legal system including jails, and this new data reveal that not only are Black people jailed at alarmingly high rates, but they are jailed again and again. Relative to their share of the total US population (14%), Black people are greatly overrepresented among the unique jail admissions in this sample (32%) and the people booked multiple times in a year (29%), while white people are underrepresented in both populations. This is consistent with what we know about the over-incarceration of Black people in this country, but the rebookings data add another layer of detail about their experiences with law enforcement, which often targets Black communities.4
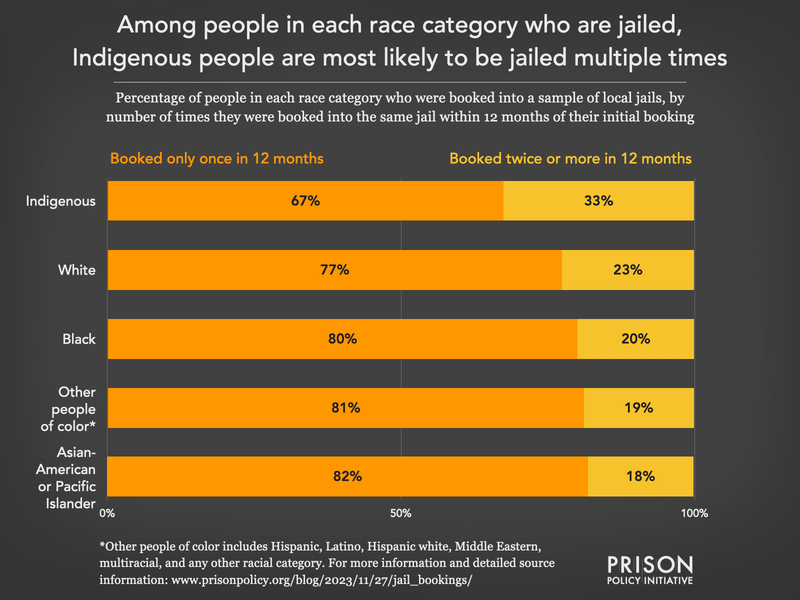
Indigenous people account for only 1% of the total U.S. population, but 3% of the incarcerated population, with incarceration rates between two and four times higher than that of white people.5 In the Jail Data Initiative data, we find that Indigenous people are especially likely to be booked into jail multiple times: 33% of Indigenous bookings were people who had been booked at least once in the past 12 months, compared to 18-22% among other racial and ethnic groups.
Women are funneled into jails
Women make up about a quarter of individuals booked into jail each year, which is in line with annual arrest data showing 27% of arrests in 2023 were of women.6 While we found no significant difference between men and women in terms of multiple jail admissions, we do know that the jail incarceration of women is growing: From 2021 to 2022, the number of women in jail increased 9% while the number of men in jail increased only 3%. The jailing of women has a devastating “ripple effect” on families: At least 80% of women booked into jail are mothers, including over 55,000 women who are pregnant when they are admitted. Beyond having to leave their children in someone else’s care, these women are impacted by the brutal side effects of going to jail: aggravation of mental health problems, a greater risk of suicide, and a much higher likelihood of ending up homeless or deprived of essential support and benefits. So while women may account for a relatively small share of people booked into jails, those jail admissions have serious and long lasting consequences for the women, their families, and their communities.
1 in 10 people booked are 55 years or older
Older adults account for one in ten of all jail bookings, but a slightly smaller share of rebookings (7%). This is consistent with existing arrest data that show an increasing proportion of older adults caught up in the criminal legal system: In 2021, people 55 years or older accounted for 8% of all arrests, a four-fold increase from their share of arrests in 1991. The Bureau of Justice Statistics only began publishing the age ranges of people in jails in recent years, but from 2021 to 2022, the jail incarceration rate of people 55 and older increased by 8%, compared to a 3% increase in jail incarceration rates across all other age groups. Considering most older adults are arrested for low-level, non-violent offenses like trespassing, driving offenses, and disorderly conduct,7 it is likely that the older adults admitted to jail are in need of other systems of support outside of the criminal legal system, like substance use treatment, accessible medical care, and behavioral health services.
More than 40% of unhoused people booked into jail were booked again within the year
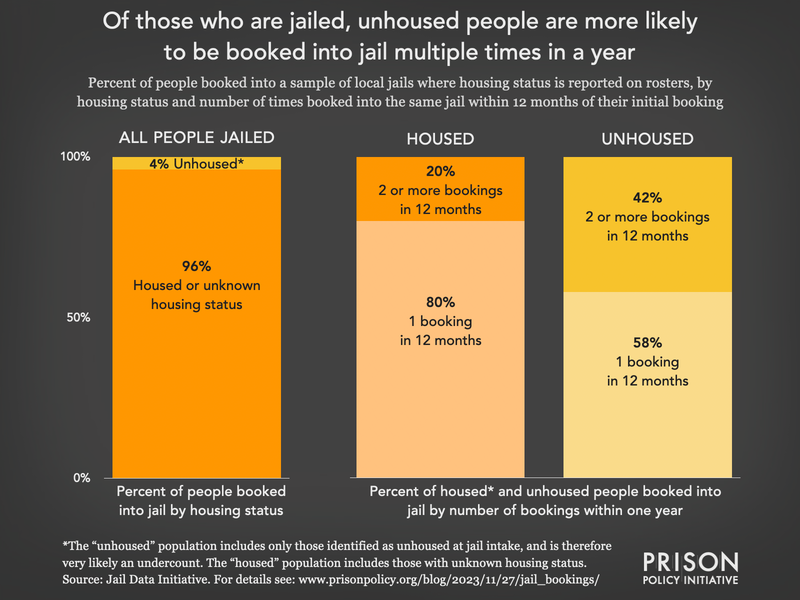
Poor people in the United States are a primary target for policing, especially those forced to live on the streets: In a 2022 analysis of Atlanta city jail bookings, we found that 1 in 8 admissions involved people experiencing homelessness, a proportion more than 30 times greater than the city’s total unhoused population. In this analysis of the Jail Data Initiative data, we find that across the 140 jails that include housing status on their online rosters, 4% of individuals booked are explicitly listed as unhoused, although this is almost certainly a significant undercount.8 While this is a relatively small portion of all bookings, unhoused people were the most likely to be jailed multiple times across all the demographic categories we looked at: Over 40% of unhoused people booked into jail were booked more than once in a twelve month period. This finding adds to the existing evidence of law enforcement’s ineffective but disproportionate and deliberate targeting of people experiencing homelessness.
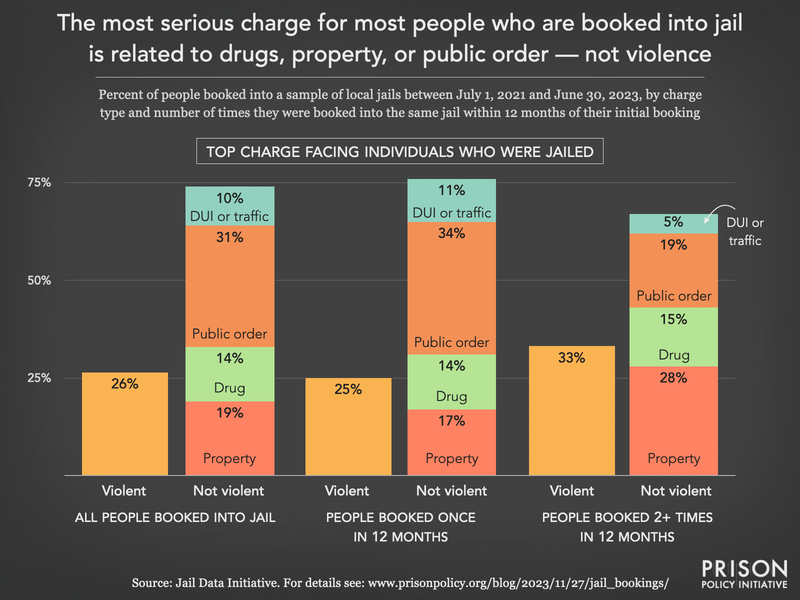
Most people are jailed for public order, property, or drug charges — not “violent” charges
The Bureau of Justice Statistics last collected charge data for jail populations in their 2002 Survey of Inmates in Local Jails. Given that the most recent jail offense data is over 20 years old, the Jail Data Initiative dataset offers a rare opportunity to analyze the top charges9 that people are booked under nationwide. Of course, the difference in data sources makes a fully apples-to-apples comparison of the 2002 data and the more recent Jail Data Initiative data impossible.10 The data provided in the Bureau of Justice Statistics survey reflects self-reported information from people detained in a sample of local jails on a single day in June 2002, while the Jail Data Initiative data is based on jail bookings across a two-year time period and relies on administrative data. Nevertheless, the overall trends since 2002 offer some valuable insights into the reasons people are detained in jails today:
- Drug charges appear to play a smaller role now than they did two decades ago, when the “war on drugs” was in full effect. In 2002, a quarter of people in jail were held for drug charges, compared to 14% of people admitted to jail in our 2021-2023 sample.
- Property charges also appear to represent a smaller portion of the jail population now than they did in 2002: Property charges are the top charge for 19% of jail admissions, compared to 24% of the jail population in 2002.
- In 2002, public order charges were the top charge for 25% of people in jail, but now, 31% of people admitted to jail are booked for a most serious charge related to public order, such as disorderly conduct, loitering, and public intoxication.
- We see very little change in the proportion of people in jail for violent charges: in 2002, 25% of people were in jail for a violent charge and in our analysis of more recent jail bookings, about 26% of jail bookings were for violent charges.
In our 2021-2023 sample, only one-third (33%) of people booked multiple times had a top charge categorized as violent in the study window, suggesting that the vast majority of people admitted to jail — including people booked repeatedly — are not accused of violent charges like homicide, assault, robbery, or sexual assault.
In their own analysis of a similar sample of the dataset, researchers at the Jail Data Initiative, Orion Taylor and Anna Harvey, found that rebooking rates vary by the type of initial booking charge. Looking closely at the rates of people returning to jail on serious violent charges11 within six months of their release from jail, they found the average rebooking rate for a serious violent charge was only 2% for people initially booked into jail on any other kind of top charge. The rate was only slightly higher (9%) if they were also jailed on a serious violent charge initially.12
Conclusion
The Jail Data Initiative offers a sorely-needed alternative source of information about jail admissions and about people who are jailed repeatedly. In many ways, our findings from this analysis support what we already know: people who are arrested and booked more than once per year often have other vulnerabilities, including homelessness, in addition to the serious medical and mental health needs of this population that we discussed in our 2019 analysis based on public health data. In addition, this dataset fills a serious gap in our knowledge about the demographics and charges of people booked into jails, given that comparable data has not been collected or published from the Bureau of Justice Statistics in over twenty years.
Methodology
The Jail Data Initiative (JDI) collects, standardizes, and aggregates individual-level jail records from more than 1,000 jails in the U.S. every day. These records are publicly available online in jail rosters — the online logs of people detained in jail facilities that often include some personal information like name, date of birth, county, charge type, bail bond amounts, and more. JDI uses web scraping — the process of automating data collection from webpages — to update their database of jail records daily.13 The more than 1,000 jails included in the Jail Data Initiative database represent more than one-third of the 2,850 jails identified by the Bureau of Justice Statistics’ Census of Jails, 2019 and are nationally representative.
Of course, not all of the jails included in the Jail Data Initiative database provide the same information. For the purposes of our analysis, we used data from 648 jail rosters for which there was available data for a two-year window (July 1, 2021 to June 30, 2023), plus an additional 365 days for a look-forward review of rebookings (to June 30, 2024). We looked at people who were both booked into jail and released within the two-year study period, and counted people as “rebooked” or “booked two or more times” if they were booked into the same jail system within 365 days of their first jail admission in the study time period. We elected to use a two-year time frame to capture a larger sample of bookings than we could in a single calendar year.
In all, there were 2.9 million jail bookings captured across these 648 rosters, representing almost 2.2 million unique individuals booked into jail: People who were booked more than once in the two-year window accounted for 26% of all bookings.14 For the more detailed analyses of jail bookings and rebookings by race and ethnicity, gender, age, housing status, and charge type, we had to use subsets of this sample of 648 rosters because the inclusion of these details was less consistent:
- Race and ethnicity: Of the 648 rosters in this sample, 437 rosters (67%) included the relevant race and/or ethnicity data needed for this analysis.15 Often, the data included in these jail rosters are administrative decisions and may not reflect an individual’s self-identified race or ethnicity.16 The final sample of rosters with race information included 1,923,668 bookings from 1,437,730 individuals.
- Gender: Of the 648 rosters in this sample, 517 rosters (80%) included the relevant gender data needed for this analysis.17 Out of the more than two million bookings in this subset, 75 bookings with values of “trans” or “nonbinary” were omitted because of the small sample size.18 The final sample of rosters with binary “male” and “female” gender identifiers included 2,180,992 bookings from 1,623,638 people.
- Age: Of the 648 rosters in this sample, 529 rosters (82%) included the relevant age data (under 55 years of age or 55 years and older) needed for this analysis.19 The final sample of rosters with age information included 2,393,299 bookings from 1,775,721 people.
- Housing status: Of the 648 rosters in this sample, only 140 rosters (22%) included housing information needed for this analysis. This is the fewest rosters included in any of our subsets of the Jail Data Initiative dataset because most rosters in the sample do not have clear indications of housing status. We categorized individuals as “unhoused” if a person was reported unhoused upon admission for any of their bookings in the two-year period,20 and all other housing statuses were considered “housed or unknown housing status.” The final sample of rosters with housing information included 599,423 bookings from 457,025 people.
- Charge type: Of the 648 rosters in this sample, 554 rosters (84%) included the relevant charge data needed for this analysis.21 Charges were grouped into the following categories (in order of severity, from most severe to least severe): violent, property, drug, public order, DUI offense, and criminal traffic. Because the top charge category does not indicate whether it was the first, second, or subsequent booking that had the top charge, nothing should be inferred about release decisions. The final sample of rosters with charge information included 2,517,899 bookings from 1,869,156 people.
Footnotes
-
Jail bookings — or admissions — involve the administrative process of collecting and entering information about the individual into the jail system and subsequently detaining that person in a jail facility. Almost all arrests lead to at least some in jail. ↩
-
The jail records and data are collected from jail rosters — publicly available, online logs of all individuals detained in a jail facility on a given date. The jail rosters used by the Jail Data Initiative are updated at least daily, excluding any jail rosters that are updated less frequently. A single jail roster may contain information for multiple counties or facilities: for example, West Virginia provides a single online search portal for all jails in the state. ↩
-
While the Jail Data Initiative data includes individual-level jail data in approximately 1,300 local jails, representing over one- third of all local jails in the country, this current analysis is based on a subset of those jails: 648 jails rosters with available data throughout the study period of July 1, 2021 to June 30, 2023. See the Methodology for more details. ↩
-
People who are arrested and jailed are often among the most socially and economically marginalized in society. The overrepresentation of Black people among those who are arrested is largely reflective of persistent residential segregation and racial profiling, which subject Black individuals and communities to greater surveillance and increased likelihood of police stops and searches. Poverty, unemployment, and educational exclusion are also factors strongly correlated with likelihood of arrest. ↩
-
Throughout this briefing, “Indigenous” refers to people identified in jail rosters as Native American, American Indian, Alaska Native, or Indigenous. This is inevitably an undercount of Indigenous people in local jails, given the flawed single-race categorization system that frequently obscures data on Indigenous people throughout the criminal legal system. For more information, see our profile page on Native incarceration in the U.S. ↩
-
According to the FBI’s National Incident-Based Reporting System (NIBRS), 1,681,794 of the 6,120,563 reported arrests in 2023 were women (Table 14: Arrestees Sex by Arrest Offense Category). ↩
-
According to the FBI’s National Incident-Based Reporting System (NIBRS), Table 13: Arrestees Age by Arrest Offense Category, 54% of people 55 and older arrested in 2023 were arrested for “Group-B offenses” including trespassing, driving offenses, and disorderly conduct. ↩
-
“Unhoused” refers to people who were positively identified as unhoused on the jail roster. This is likely a significant underestimate because many more unhoused people may have chosen to list a shelter address, a family member’s address, or another location as their address when they were booked into jail. This estimate is based on only bookings from 140 jail rosters where housing status was indicated for at least one booking in the study time period. If a person was reported unhoused upon admission for any of their bookings, they were counted as “unhoused.” Because of the unique method required to standardize this indicator (it is extracted from a variety of fields by substring searching), and because it is only reported in the positive, we cannot assume that people who are not reported to be unhoused are housed; rather, we assume that they are either housed or have an “unknown” housing status. Unlike the larger sample used in other parts of this analysis, the final sample for this part included 599,423 bookings involving 457,025 individuals. ↩
-
The “top charge” category reflects the most serious charge from among all jail bookings for that individual. For example, if the first booking for an individual was for a criminal traffic offense and a subsequent booking three months later was for a violent offense, that person’s “top charge” category is “violent.” The charge categories are based on the CJARS Text-based Offense Classification (TOC) model and include, from most severe to least severe: violent, property, drug, public order, DUI offense, criminal traffic. ↩
-
In particular, the offense distribution of the static one-day population in jails is likely to differ from the offense distribution of all jail bookings over a longer time period, because charges are directly related to the likeliness of pretrial detention, and in turn, how long people stay in jail. For example, courts are likely to set higher bail amounts or deny bail for people booked on serious charges (especially charges of violence) and more likely to order release without monetary conditions for people accused of less serious charges. Additionally, less serious offenses carry shorter sentences that result in quicker release from jail even when people are convicted. Therefore, we would expect a higher proportion of “violent” and serious charges in the one-day jail population than we would across all admissions. ↩
-
In that analysis, the researchers considered “serious violent charges” to include murder, unspecified
homicide, voluntary/nonnegligent manslaughter, non-vehicular manslaughter, aggravated assault, kidnapping, rape, statutory rape, lewd act with children, sexual assault, and human trafficking. ↩ -
As the authors of that study write, “In other words, over a 6-month period, a recently released individual originally booked on a top charge not involving serious violence can be expected to be charged with 0.02 crimes of serious violence. A recently released individual originally booked on a top charge of serious violence can be expected to be charged with 0.09 crimes of serious violence.” ↩
-
For more information about the data collections and web scraping process, cleaning of the data, aggregations, and other relevant methodological details used by the Jail Data Initiative, please see their documentation and methodology at https://jaildatainitiative.org/documentation/about. ↩
-
Across the 648 rosters, some bookings were excluded from the analysis due to potential issues with date range overlap (12,413 bookings) and issues with unique person identification (15 bookings). ↩
-
For more information on how the Jail Data Initiative standardized race and ethnicity across rosters, please see their documentation page at https://jaildatainitiative.org/documentation/glossary. ↩
-
In criminal legal system data, race and ethnicity are not always self-reported (which would be ideal). Police and jail administrators may report an individual’s race based on their own perception — or not report it at all — and the jail rosters used by Jail Data Initiative rely on administrative data, which may not reflect how individuals identify their own race or ethnicity. ↩
-
Gender is not always self-reported (which would be ideal) in criminal legal system data. Police and jail administrators may report an individual’s gender or sex based on their own perception — or not report it at all — and the jail rosters used by Jail Data Initiative rely on administrative data, which may not reflect how individuals identify their own gender. For more information on how the Jail Data Initiative standardized sex and gender across rosters, please see their documentation page at https://jaildatainitiative.org/documentation/glossary. ↩
-
While these 75 bookings could not be included in this analysis, we know that trans and non-binary are disparately impacted by the criminal legal system: In particular, Black trans people and other trans people of color face high rates of police harassment and high lifetime rates of incarceration. In jails and prisons, trans people face high rates of assault, are frequently denied healthcare, and are at high risk of being sent to solitary confinement. We suspect that because most jail systems likely operate on a gender binary (male/female), this likely represents a serious undercounting of trans and non-binary people admitted to jails. ↩
-
For more information on how the Jail Data Initiative standardized age across rosters, please see their documentation page at https://jaildatainitiative.org/documentation/glossary. For this analysis, we were interested in looking specifically at the jailing of older adults, so we collapsed all categories younger than 55 into one group, and all categories 55 and older into another. ↩
-
This ultimately results in a significant undercount of the unhoused population admitted to jail: administrative records of unhoused people may include previous addresses, shelter addresses, or addresses of family and friends and would therefore not be considered “unhoused” in jail records. ↩
-
Using the Criminal Justice Administrative Records System (CJARS) Text-based Offense Classification (TOC) algorithm, the Jail Data Initiative standardized the most severe charge reported for individuals into the following categories (in order of severity, from most severe to least severe):
- Violent
- Property
- Drug
- Public order
- DUI offense
- Criminal traffic
An overall top charge category per person was determined by selecting the most severe charge from among all bookings for that individual. For more information on how the Jail Data Initiative standardized the “top charge” — or the most severe charge reported — across rosters, please see their documentation page at https://jaildatainitiative.org/documentation/glossary. ↩
