Best of the blog

Instead of releasing more people to the safety of their homes, parole boards in many states held fewer hearings and granted fewer approvals during the ongoing, deadly pandemic

by Tiana Herring, February 3, 2021

Prisons have had 10 months to take measures to reduce their populations and save lives amidst the ongoing pandemic. Yet our comparison of 13 states’ parole grant rates from 2019 and 2020 reveals that many have failed to utilize parole as a mechanism for releasing more people to the safety of their homes. In over half of the states we studied—Alabama, Iowa, Michigan, Montana, New York, Oklahoma, Pennsylvania, and South Carolina – between 2019 and 2020, there was either no change or a decrease in parole grant rates (that is, the percentage of parole hearings that resulted in approvals).

Granting parole to more people should be an obvious decarceration tool for correctional systems, during both the pandemic and more ordinary times. Since parole is a preexisting system, it can be used to reduce prison populations without requiring any new laws, executive orders, or commutations. And since anyone going before the parole board has already completed their court-ordered minimum sentences, it would make sense for boards to operate with a presumption of release.1 But only 34 states even offer discretionary parole, and those that do are generally not set up to help people earn release. Parole boards often choose to deny the majority of those who appear before them.

chart showing percent change in parole hearings, parole grant rates, the number of people approved for release
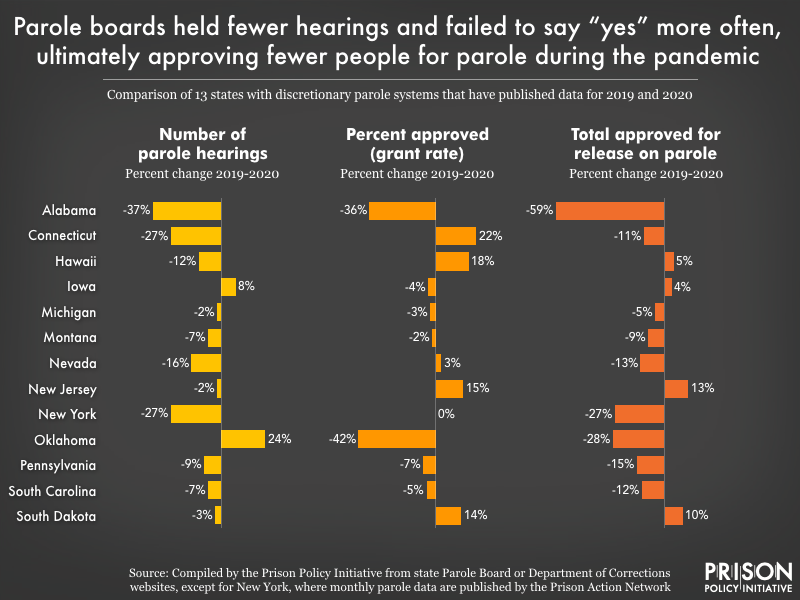
Of the 34 states with discretionary parole, we were able to find parole data for both 2019 and 2020 for these 13 states. Four states – Alabama, Hawaii, Iowa, and New Jersey – report their parole data by the fiscal year instead of the calendar year. Thus, the impact of the pandemic on parole releases may appear less extreme in these four states. (Fiscal Year 2020 data from Alabama reflects hearings held between Oct 1, 2019 and Sept 1, 2020, while Fiscal Year 2020 data in the other three states reflects hearings held between July 1, 2019 and June 30, 2020.) We’ve still included these states, however, as they capture early parole responses to the pandemic.

We also found that, with the exception of Oklahoma and Iowa, parole boards held fewer hearings in 2020 than in 2019, meaning fewer people had opportunities to be granted parole. This may be in part due to boards being slow or unwilling to adapt to using technology during the pandemic, and instead postponing hearings for months. Due to the combined factors of fewer hearings and failures to increase grant rates, only four of the 13 states – Hawaii, Iowa, New Jersey, and South Dakota – actually approved more people for parole in 2020 than in 2019.

Denying people parole during a pandemic only serves to further the spread of the virus both inside and outside of prisons. As the number of cases and deaths in prisons due to COVID-19 continue to rise, parole boards still have the opportunity to help slow the spread of the virus by releasing more people in 2021.


Number of parole hearings, percent approved for release, and number of approvals, 2019 and 2020

States 2019 Number of parole hearings 2020 Number of parole hearings 2019 Percent approved (grant rate) 2020 Percent approved (grant rate) 2019 Total approved for release on parole 2020 Total approved for release on parole
Alabama 4,270 2,704 31% 20% 1,337 544
Connecticut 1,703 1,247 50% 61% 848 758
Hawaii 2,923 2,582 26% 31% 768 803
Iowa 13,385 14,502 34% 33% 4,527 4,724
Michigan 12,483 12,218 73% 71% 9,075 8,642
Montana2 2,966 2,748 38% 37% 1,113 1,013
Nevada 6,873 5,786 67% 69% 4,601 4,000
New Jersey 5,453 5,329 47% 54% 2,571 2,899
New York 8,378 6,141 47% 46% 3,919 2,852
Oklahoma 3,314 4,125 42% 24% 1,407 1,008
Pennsylvania3 18,209 16,599 60% 56% 10,884 9,244
South Carolina 3,051 2,831 36% 34% 1,089 961
South Dakota 1,729 1,675 44% 51% 769 849


Footnotes

  1. It’s important to note that people released on parole are not truly free, and complete the remainder of their maximum sentences on community supervision. There are many problems with community supervision, including that it sets people up to fail with strict conditions and intense surveillance. But in the context of the pandemic where mitigation efforts like social distancing are virtually impossible inside of prisons, it is generally safer for people to be released into a flawed community supervision system than to remain behind bars.

     ↩

  2. We calculated Montana’s parole numbers by 2019 and 2020 calendar year, using the official list of decisions for each month published by the Montana Board of Pardons and Parole. However, the Montana Department of Corrections’ 2021 biennial report notes the total number of parole hearings, number of approvals, and number of denials, broken down by fiscal year. Here, the DOC reports a much higher grant rate, which we were unable to replicate using the monthly data from the Board of Pardons and Parole.

     ↩

  3. Pennsylvania Act 115 (2019) reduced the number of people eligible for parole hearings by creating presumptive release for some people serving sentences of two years or less. The Act likely contributed to the drop in parole hearings and total approvals in Pennsylvania in 2020.

     ↩


At the International Symposium on Solitary Confinement, researchers and formerly incarcerated people made it clear that isolation causes severe and permanent damage.

by Tiana Herring, December 8, 2020

On a given day last year, an estimated 55,000 to 62,500 people had spent the previous 15 days in solitary confinement in state and federal prisons, often in cells smaller than a parking space.1 Correctional officials often defend their frequent use of solitary confinement as an effective means of maintaining order and deterring violence and gang activity. But this reliance on solitary ignores the abundance of studies demonstrating the harmful and often long-lasting effects it wreaks on the human mind and body.

At the International Symposium on Solitary Confinement, sponsored by Thomas Jefferson University in November, researchers and formerly incarcerated people made it clear that any “positive” benefits correctional institutions gain by using solitary confinement are outweighed by the severe and often permanent damages caused by prolonged isolation. Recent studies show that time spent in solitary confinement shortens lives, even after release, and speakers at the International Symposium emphasized various other ways solitary causes irreparable harm.

Solitary confinement goes by many names, including “special housing units,” “administrative segregation,” “disciplinary segregation,” and “restrictive housing,” but the conditions are generally the same: 22 to 24 hours per day spent alone in a small cell.2 The practice is widespread in jails, prisons, ICE detention centers, and juvenile facilities, and people are often sent to solitary for vague reasons or minor offenses. Black and Hispanic people, who are already overrepresented in correctional facilities, are further overrepresented in solitary confinement. Solitary isn’t just used for short periods of time, either: many people are confined without human interaction for years, and sometimes even decades.3

Prisons and jails are already inherently harmful, and placing people in solitary confinement adds an extra burden of stress that has been shown to cause permanent changes to people’s brains and personalities. In fact, the part of the brain that plays a major role in memory has been shown to physically shrink after long periods without human interaction. And since humans are naturally social beings, depriving people of the ability to socialize can cause “social pain,” which researchers define as “the feelings of hurt and distress that come from negative social experiences such as social deprivation, exclusion, rejection, or loss.” Social pain affects the brain in the same way as physical pain, and can actually cause more suffering because of humans’ ability to relive social pain months or even years later.

graph show mortality risk with solitary confinement
Premature deaths — by suicide, homicide, or opioid overdose — after release from prison are more likely for those that spent any amount of time (even one day) in solitary confinement than those who never did.

The effects of solitary confinement on mental health can be lethal. Even though people in solitary confinement comprise only 6% to 8% of the total prison population, they account for approximately half of those who die by suicide. Relatedly, observation cells in prisons, which are used for suicide watch — often with similar conditions to solitary confinement — are disproportionately filled with transfers from segregation. People often cycle between the two units without receiving adequate professional help to address their underlying mental health concerns.

Even if someone doesn’t enter solitary with a mental health condition, it’s possible for them to develop a specific psychiatric syndrome due to the effects of isolation. Dr. Stuart Grassian, who first identified the syndrome, notes that it is characterized by a progressive inability to tolerate ordinary things, such as the sound of plumbing; hallucinations and illusions; severe panic attacks; difficulties with thinking, concentration, and memory; obsessive, sometimes harmful, thoughts that won’t go away; paranoia; problems with impulse control; and delirium.

Robert King and Jack Morris, who spent a combined 62 years in solitary confinement, underscored many of the above findings at the International Symposium on Solitary Confinement. Mr. King noted that after a while, he lost his interest in communicating and experienced an emotional numbness that led to a loss of basic skills. Even since his release from prison in 2001, Mr. King says he struggles with simple things, including his sense of direction. Research indicates that many problems people develop while in solitary confinement often persist upon their return to the general population or their release to the outside world.

The irreparable damages caused by solitary confinement are unjustifiable, and have led the Union Nations to consider solitary torture when used for longer than 15 consecutive days. But this overwhelming research is often ignored in jails and prisons, where solitary confinement is frequently used as a “solution” to nearly every problem that arises, including disobedience, perceived threats, alleged gang affiliation, and even supposedly for individuals’ own protection. And as prisons continue using lockdowns in response to COVID-19, leaving many people alone or with a cellmate in tight spaces for 24 hours a day, understanding the damaging effects of solitary and changing these practices is more important than ever.


Footnotes

  1. It’s possible this number is higher, as this report relied on self-reported data from the state Departments of Corrections, and only counted people as being in solitary if they’d been there for at least 15 days.

     ↩

  2. Solitary Watch reports that cells generally measure from 6×9 to 8×10 feet.

     ↩

  3. In 2011, about 45% of people in the Pelican Bay Security Housing Unit had been in solitary for longer than a decade. A more recent study by Yale Law School’s Arthur Liman Center for Public Interest Law found that 11 percent of people in solitary had been segregated for at least three years.

     ↩


Halfway houses are a major feature of the criminal justice system, but very little data is ever published about them. We compiled a guide to understanding what they are, how they operate, and the rampant problems that characterize them.

by Roxanne Daniel and Wendy Sawyer, September 3, 2020

In May, an investigation by The Intercept revealed that the federal government is underreporting cases of COVID-19 in halfway houses. Not only is the Bureau of Prisons reporting fewer cases than county health officials; individuals in halfway houses who reached out to reporters described being told to keep their positive test results under wraps.

It shouldn’t take exhaustive investigative reporting to unearth the real number of COVID-19 cases in a halfway house. But historically, very little data about halfway houses has been available to the public, even though they are a major feature of the carceral system. Even basic statistics, such as the number of halfway houses in the country or the number of people living in them, are difficult to impossible to find.

Broadly speaking, there are two reasons for this obscurity: First, halfway houses are mostly privately operated and don’t report data the way public facilities are required to; second, the term “halfway house” is widely used to refer to vastly different types of facilities. So, we compiled the little information that does exist about halfway houses, explaining how various facilities commonly called “halfway houses” differ from each other, and the ways in which these criminal justice facilities often fail to meaningfully support formerly incarcerated people. We also explore why poor conditions and inadequate oversight in halfway houses have made them hotspots for COVID-19.

“Halfway house” is an umbrella term

The term “halfway house” can refer to a number of different types of facilities, but in this briefing we will only use halfway house to mean one thing: A residential facility where people leaving prison or jail (or, sometimes, completing a condition of probation) are required to live before being fully released into their communities. In these facilities, individuals live in a group environment under a set of rules and requirements, including attendance of programming, curfews, and maintenance of employment.

State corrections departments, probation/parole offices, and the Federal Bureau of Prisons (BOP) often contract with nonprofits and private companies to run these facilities. These contracts are the primary means through which halfway houses receive funding.1

Federally contracted halfway houses are called Residential Reentry Centers (RRCs). State-licensed halfway houses can be referred to by a variety of terms, like Transitional Centers, Reentry Centers, Community Recovery Centers, etc. These facilities work with corrections departments to house individuals leaving incarceration, often as a condition of parole or other post-release supervision or housing plan.

“Halfway house” can also refer to a few other types of facilities, which will not be addressed in this briefing:

  • Sober living homes, though sometimes housing formerly incarcerated people, do not serve the sole purpose of acting as a transitional space between incarceration and reentry. Sober living homes accomodate people with substance use disorders, and they’re sometimes called “halfway houses” because they often act as transitional housing for people leaving drug and alcohol rehabilitation programs.
  • Restitution centers and community based/residential correctional facilities act as alternatives to traditional incarceration, instead of prison or jail, where individuals can go to serve their entire sentence. In restitution centers, people are expected to work and surrender their paychecks to be used for court-ordered fines, restitution fees, room and board, and other debts. Community based/residential correctional facilities frequently include a work-release component, but they function more as minimum-security prisons than reentry services.
  • Some transitional housing providers for people leaving prison are voluntary for residents, and are not funded and contracted by the government. Susan Burton’s A New Way of Life Reentry Project, for example, provides safe housing and support for women leaving incarceration. Their services provide a potential model for the future of reentry programs that actually help residents rebuild their lives after the destructive experience of prison or jail.

Some facilities, like community-based correctional facilities, can serve dual functions that blur the lines of what facilities are and are not halfway houses. For instance, a community-based corrections facility might primarily house people who have been ordered to serve their full sentences at the facility, but also house some individuals who are preparing for release. We have included an appendix of the most recent list of adult state and federal correctional facilities that the Bureau of Justice Statistics calls “community-based correctional facilities” (those that allow at least 50% of the population to leave the facility). In our appendix table, we attempt to break down which of those 527 facilities fall under our “halfway houses in the criminal justice system” definition, and which facilities primarily serve other purposes.

graphic displaying the different kinds of facilities that are called halfway houses. “Halfway house” can refer to different types of facilities that share some similarities. These facilities range from entirely carceral to not carceral at all (represented by the locked doors), and feature different priorities and programming for the people residing in them. Their purposes can also overlap, as community based correctional facilities, for instance, house individuals at various stages in their incarceration. For the purpose of this briefing, however, we are focusing on “Halfway Houses in the Criminal Justice System”– which are state or federally contracted facilities for people leaving state or federal incarceration.

Every year, tens of thousands spend time in halfway houses

The federal government currently maintains 154 active contracts with Residential Reentry Centers (RRCs) nationwide, and these facilities have a capacity of 9,778 residents. On any given day in 2018, RRCs held a nearly full population of 9,600 residents. While regular population reports are not available, 32,760 individuals spent time in federal RRCs in 2015, pointing to the frequent population turnover within these facilities.

Unfortunately, much less information exists about how many state-run or state-contracted halfway houses and halfway house residents there are. BJS data collected in 2012 indicates that there are 527 “community-based correctional facilities,” or facilities where 50% or more of the residents are regularly permitted to leave.2 These facilities held a one-day population of 45,143 males and 6,834 females, for a total of 51,977 individuals. However, as we will discuss later, these numbers include facilities that serve primarily or entirely as residential correctional facilities (where people serve their entire sentences). This ambiguity means that pinning down how many people are in halfway houses each day – and how many specifically state-funded halfway houses there are – is nearly impossible.

One reason that we know more about federal than state-level halfway houses has to do with the contracting process. The federal contract process is relatively standardized and transparent, while state contracting processes vary widely and publish little public-facing information, which makes understanding the rules governing people in state-contracted facilities much more difficult.

Halfway houses are carceral facilities

Contrary to the belief that halfway houses are supportive service providers, the majority of halfway houses are an extension of the carceral experience, complete with surveillance, onerous restrictions, and intense scrutiny.

For the most part, people go to halfway houses because it is a mandatory condition of their release from prison. Some people may also go to halfway houses without it being required, simply because the facility provides housing. Placement in Residential Reentry Centers (RRCs) post-incarceration can technically be declined by people slated for release, but doing so would require staying in prison instead.

In federal RRCs, staff are expected to supervise and monitor individuals in their facilities, maintaining close data-sharing relationships with law enforcement. Disciplinary procedure for violating rules can result in the loss of good conduct time credits, or being sent back to prison or jail, sometimes without a hearing.

Federal RRC residents3 are generally subject to two stages of confinement within the facility that lead to a final period of home confinement. First, they are restricted to the facility with the exception of work, religious activities, approved recreation, program requirements, or emergencies. A team of staff at the RRC determines whether an individual is “appropriate4 to move to the second, less restrictive component of RRC residency. Even in this second “pre-release” stage, individuals must make a detailed itinerary every day, subject to RRC staff approval. Not only are residents’ schedules surveilled, their travel routes are subject to review as well.

Most states do not release comprehensive policy on their contracted halfway houses. From states like Minnesota, we are able to see that the carceral conditions in federal RRCs are often mirrored in the state system. Minnesota Department of Corrections (DOC) policy specifically calls for halfway houses to “[conduct] searches of residents, their belongings, and all areas of the facility to control contraband and locate missing or stolen property.” They also mandate that “staff shall maintain a system of accounting for the residents at all times,” that “methods used for control and discipline” are incorporated in written policy, and that there are “written procedures for the reporting of absconders.” The exact policies and procedures vary by facility, but all are expected to adhere to statewide guidelines; the conditions and intensity of carcerality will surely vary from halfway house to halfway house.

There’s far more that we don’t know: Lack of publicly available data makes it difficult to hold facilities accountable

Understanding halfway houses — including basic information like how many facilities there are and what conditions are like — is difficult for several reasons:

  • No standard, transparent policies. There are few states that publicly release policies related to contracted halfway houses. In states like Minnesota, at least, there appear to be very loose guidelines for the maintenance of adequate conditions within these facilities. For example, beyond stating that buildings’ grounds must be “clean and in good repair,” the Minnesota DOC specifies no regular sanitation guidelines. Troublingly, beyond an on-site inspection to determine whether to issue a contract, there are no provisions for regular audits of halfway houses to affirm compliance with these policies.
  • Privatization. The majority of halfway houses in the United States are run by private entities, both nonprofit and for-profit. For example, the for-profit GEO Group recently acquired CEC (Community Education Centers), which operates 30% of all halfway houses nationwide. Despite their large share of the industry, they release no publicly available data on their halfway house populations. The case is similar for other organizations that operate halfway houses.
  • Poor federal data collection. As we noted earlier, the Bureau of Justice Statistics does periodically publish some basic data about halfway houses, but only in one collection (the Census of Adult State and Federal Correctional Facilities), which isn’t used for any of the agency’s regular reports about correctional facilities or populations. The BJS unhelpfully lumps reentry-focused halfway houses together with minimum security prisons and other kinds of community-based facilities in a broad category it calls “community-based correctional facilities,” making the data difficult to interpret. We can tell from the most recent data that, in 2012, there were 527 community-based facilities, but it remains unclear which facilities are which (we did our best to categorize them in the appendix ). It follows that the BJS does not publish disaggregated demographic data about the populations in these different types of facilities, making the sort of analysis we do about prisons and jails impossible. By contrast, the BJS releases detailed, publicly accessible data about prisons and jails, including population counts, demographic data, the time people spend behind bars, what services are offered in facilities, and more.
  • Lack of oversight. The most comprehensive reporting on conditions in halfway houses are audits by oversight agencies from the federal government or state corrections departments. However, these audits are too few and far between. Since 2013, only 8 audits of federal RRCs have been released by the Office of the Inspector General. In the few publicly released reports from state-level agencies, we found a similar lack of frequency in reporting and other significant issues with oversight. In a 2011 audit from New Jersey, the state’s Office of Community Programs was found to be conducting far fewer site visits to halfway houses than policy required. The testing they performed to determine the extent and quality of services being provided was found thoroughly inadequate, and the Department of Corrections had no set standards to grade facilities on performance. Even when site visits were conducted, there was no way of authentically monitoring conditions at these facilities, since halfway house administrators were notified in advance of site visits and were able to pick and choose files to be reviewed.

These woeful inadequacies are indicative of a larger systemic failure of halfway house oversight that often results in deeply problematic conditions for residents. Too often, audits are only conducted after journalists report on the ways specific halfway houses are failing residents, rather than government correctional agencies doing proper oversight on their own.

Conditions in halfway houses often involve violence, abuse, and neglect

Since data remains sparse and oversight is unreliable, we have retrieved the bulk of information about conditions in halfway houses from the media and advocates. The voices of those who have spent time in halfway houses, and those who have worked in them, are key to understanding the reality of these facilities and the rampant problems that plague them.

Over 200 interviews with residents, workers, officials and others associated with halfway houses in New Jersey were conducted for a 2012 New York Times report. The interviewees described over 5,000 escapes since 2005, and cited drug use, gang activity and violence occurring in the facilities. The private company Community Education Centers (CEC, now GEO Group) operates the majority of New Jersey halfway houses. In a 2015 report on CEC (now GEO)’s troubled history, The Marshall Project confirmed the frequency of violence, drug use, and escapes in these facilities. While the role of halfway house administrators in creating unlivable, miserable conditions is unfortunately not the focus of these news reports (nor do they address the complex circumstances that foster drug use and violence), they do indicate that the facilities are inadequately serving their residents.

The largest CEC (now GEO) halfway house in Colorado was similarly subject to criticism when reporters found evidence of rampant drug use and gang violence, indicating the failure of the facility to provide a supportive reentry community. Subsequent audits identified a number of major staffing issues, including high turnover rates and misconduct. This pattern of inadequate staffing extends to CEC halfway houses in California, where a former facility director cited inadequate training and earnings barely above minimum wage. The clinical director of the California facility, responsible for resident health, did not possess a medical degree, or even a college degree.

Improper management and inadequate oversight of halfway houses also enables inequities in the reentry process. Journalists have revealed how, when individuals are required to have a halfway house lined up in order to be released on parole, they can encounter lengthy waitlists due to inadequate bed space, forcing them to remain in prison. In July, a Searchlight New Mexico investigation revealed that one halfway house was asking individuals to pay upfront rent in order to move to the “front of the line.” 89 people who were approved for release remained in prison due to their inability to pay to get off of the halfway house waitlist.

These media reports are too often the only way we are able to retrieve public information about the internal conditions of halfway houses. From the lived experiences of those who have resided in halfway houses, it is clear that egregious conditions in halfway houses are common.

Poor conditions and bad incentives make halfway houses hotspots for COVID-19

Now, during the COVID-19 pandemic, it is even more important that the public focus on the jail-like conditions of halfway houses which put vulnerable populations at risk. As of August 18, federal Residential Reentry Centers (RRCs) had 122 active cases, and 9 deaths, of coronavirus among halfway house residents nationwide. However, recent investigative reports suggest that the real numbers are even higher, as the BOP continues to underreport cases in RRCs and state-level data is nearly non-existent. For instance, The Intercept noted that the GEO Grossman Center in Leavenworth, Kansas had 67 cases (including staff) in May, as reported by the country health officials; yet the federal Bureau of Prisons (BOP) currently only reports a history of 29 cases of coronavirus in the Center, with no history of cases among staff.

Cases of COVID-19 are uniquely dangerous in halfway houses due to the work release component of many facilities. When some halfway houses locked down to prevent community spread, people who had been employed in high-density work environments, and/or travelled to work by public transportation, were confined in tight quarters with other residents for an extended period, risking disease spread. Now, as individuals return to work, halfway houses are positioned to be vectors of the virus, as the lack of social distancing and adequate living spaces is exacerbated by the frequency with which individuals have contact with the greater community.

Residents of halfway houses have described deeply inadequate sanitation and disease prevention on top of the lack of social distancing. In the now-defunct Hope Village in Washington, D.C., residents reported packed dining halls, makeshift PPE, and restricted access to cleaning products and sanitation supplies. In a Facebook video, a resident described “6 to 8 people” leaving Hope Village daily in an ambulance.

What’s more, halfway houses have a financial incentive to maintain full occupancy due to the conditions of contracts. While the federal Bureau of Prisons has prioritized home confinement as a component of the CARES Act, and has urged federal RRCs to facilitate the process of home confinement releases despite the financial risk, state systems have been more ambiguous about their recommendations for halfway houses. Since states have overwhelmingly failed to protect incarcerated people in jails and prisons, the outlook for halfway houses is bleak.

Conclusion

The gruesome portrayal of halfway houses in the media can often be the catalyst for formal audits of these facilities. But it should be noted that regular monitoring, auditing, and data reporting should be the norm in the first place. Halfway houses are just as much a part of someone’s prison sentence as incarceration itself, but they are subject to much less scrutiny than prisons and jails. This lack of guidelines and oversight has ensured that people in halfway houses are not being aided in safely and effectively rebuilding their lives after serving time in jails and prisons. It’s past time to start implementing oversight measures and extensive reforms that keep residents safe and help the halfway house experience feel more like reentry – and less like an extension of the carceral experience.

Footnotes

  1. In 2011, the private company Community Education Centers (CEC) received $71 million in contracts from state and county agencies.

     ↩

  2. This number includes federal RRCs.

     ↩

  3. In the Census, residents of halfway houses are counted at the halfway house, not at their pre-incarceration home. Halfway houses are supposed to be located in the communities in which residents will return to post-release, but this might not always be the case. We refer to individuals in halfway houses as “residents” as a working term to indicate halfway house placement, but they are still subject to prison gerrymandering.

     ↩

  4. Residential Reentry Center, Statement of Work (SOW) April 2017. P. 54

     ↩


Racial inequality is evident in every stage of the criminal justice system - here are the key statistics compiled into a series of charts.

by Wendy Sawyer, July 27, 2020

Recent protests calling for radical changes to American policing have brought much-needed attention to the systemic racism within our criminal justice system. This extends beyond policing, of course: Systemic racism is evident at every stage of the system, from policing to prosecutorial decisions, pretrial release processes, sentencing, correctional discipline, and even reentry. The racism inherent in mass incarceration affects children as well as adults, and is often especially punishing for people of color who are also marginalized along other lines, such as gender and class.

Because racial disparity data is often frustratingly hard to locate, we’ve compiled the key data available into a series of charts, arranged into five slideshows focused on policing, juvenile justice, jails and pretrial detention, prisons and sentencing, and reentry. These charts provide a fuller picture of racial inequality in the criminal justice system, and make clear that a broad transformation will be needed to uproot the racial injustice of mass incarceration.

Following the slideshows, we also address five frequently asked questions about criminal justice race/ethnicity data.

There are racial disparities in policing and arrests:

  • police contact
  • use of force
  • number of arrests
  • police contact
  • use of force
  • number of arrests


There are racial disparities in the arrest and confinement of youth:

  • youth arrests
  • youth confinement
  • youth confinement for low level offenses
  • youth arrests
  • youth confinement
  • youth confinement for low level offenses


There are racial disparities in local jails and pretrial detention:

  • jail incarceration rates
  • pretrial growth
  • incomes of people held pretrial
  • jail incarceration rates
  • pretrial growth
  • incomes of people held pretrial


There are racial disparities in prisons, extreme sentences, and solitary confinement:

  • imprisonment rates
  • pre-incarceration incomes of people in prison
  • life sentences
  • death sentences
  • solitary confinement
  • imprisonment rates
  • pre-incarceration incomes of people in prison
  • life sentences
  • death sentences
  • solitary confinement


There are racial disparities in homelessness, unemployment, and poverty after release:

  • unemployment
  • homelessness
  • wealth accumulation
  • unemployment
  • homelessness
  • wealth accumulation


Frequently asked questions about race and ethnicity in criminal justice data

Q: Why are terms used inconsistently, such as “Hispanic” and “Latino/a”?

A: Sharp-eyed readers will notice some inconsistency in the terms used in the charts above, and across the literature more generally. For example, the Census Bureau and most national criminal justice data uses the category “American Indian or Alaska Native” to describe indigenous people in the U.S., but the juvenile justice system data uses the term “American Indian.” Likewise, “Hispanic” is used most frequently in various national data sets to refer to those with Spanish-speaking ancestry, but some sources use Latino/a (or Latinx), which specifically refers to those with Latin American ancestry. In these charts (and in most of our publications), we use the terminology of the original data sources.

Q: Why are some racial/ethnic categories not represented in the data?

A: The question of how accurately race and ethnicity data reflect justice-involved populations goes beyond inconsistent labels. Most obviously, not all racial or ethnic groups are consistently represented in the data; less populous Census-identified groups, such as Native Hawaiian or other Pacific Islander, Asian, and American Indian or Alaska Native – as well as the sizable but less specific “Two or more races” and “Some other race” – are very often excluded in publications, even when they are collected. Moreover, all of these categories are so broad that they lump together groups with very different experiences with the U.S. justice system. They disregard tribal differences, sweep people of East Asian and South Asian origins into one category, and somehow ignore Arab Americans entirely. As a result, our observations of racial and ethnic discrimination are limited to these broad categories and lack any real nuance.

Q: Where can I find data about racial disparities in my state’s criminal justice system?

A: Unfortunately, the more specific you want to get with race/ethnicity data, the harder it is to find an answer, especially one that’s up-to-date. State-level race and ethnicity data can be hard to find if you are looking to federal government sources like the Bureau of Justice Statistics (BJS). BJS does publish state-level race and ethnicity data in its annual Prisoners series (Appendix Table 2 in 2018), but only every 6-7 years in its Jail Inmates series (most recently the 2013 Census of Jails report, Table 7). The Vera Institute of Justice has attempted to fill this gap with its Incarceration Trends project, by gathering additional data from individual states. Individual state Departments of Correction sometimes collect and/or publish more up-to-date and specific data; it’s worth checking with your own state’s agencies.

Q: Where can I find criminal justice race/ethnicity data disaggregated by sex?

A: Disaggregating racial/ethnic data by sex is unfortunately not the norm in reports produced by the federal government (i.e. BJS). For people able to access and analyze the raw data, such analyses are often possible, but most people rely on the reports published by government agencies like BJS. As you can see in the chart showing prison incarceration rates by sex and race/ethnicity, BJS does sometimes offer this level of detail. But again, the same level of detail is not available for jails, and an analysis of both race/ethnicity and sex by state is all but unheard-of – even though it is precisely this level of detail that is most useful for advocates trying to help specific populations in their state.

Q: How are the data collected, and how accurate are the data?

A: Finally, the validity of any data depends on how the data are collected in the first place. And in the case of criminal justice data, race and ethnicity are not always self-reported (which would be ideal). Police officers may report an individual’s race based on their own perception – or not report it at all – and the surveys that report the number of incarcerated people on a given day rely on administrative data, which may not reflect how individuals identify their own race or ethnicity. This is why surveys of incarcerated people themselves are so important, such as the Survey of Inmates in Local Jails and the Survey of Prison Inmates, but those surveys are conducted much less frequently. In fact, it’s been 18 years since the last Survey of Inmates in Local Jails, which we use to analyze pretrial jail populations, and 16 years since the last published data from the Survey of Inmates were collected.


How to link to specific images

Because some readers might want to link to specific images in this briefing out of the context of these slideshows, we’ve created these special URLs so you can link directly to a specific image:

Black people are disproportionately stopped on the street by police, while white people are much more likely to call the police for help
https://www.prisonpolicy.org/blog/2020/07/27/disparities/#slideshows/slideshow1/1
Among individuals who have any contact with police, people of color disproportionately experience the use of force
https://www.prisonpolicy.org/blog/2020/07/27/disparities/#slideshows/slideshow1/2
Black people are disproportionately likely to be arrested, and to be arrested repeatedly in the same year
https://www.prisonpolicy.org/blog/2020/07/27/disparities/#slideshows/slideshow1/3
Black youth are arrested far out of proportion to their share of all youth in the U.S.
https://www.prisonpolicy.org/blog/2020/07/27/disparities/#slideshows/slideshow2/1
The juvenile justice system confines Black youth at over 4 times the rate of white youth
https://www.prisonpolicy.org/blog/2020/07/27/disparities/#slideshows/slideshow2/2
For the lowest level offenses, Black and American Indian youth are confined at rates over 3 times the rate of white youth
https://www.prisonpolicy.org/blog/2020/07/27/disparities/#slideshows/slideshow2/3
Racial disparities in local jail incarceration rates
https://www.prisonpolicy.org/blog/2020/07/27/disparities/#slideshows/slideshow3/1
Pretrial populations, disproportionately Black and Hispanic, have more than doubled over 15 years
https://www.prisonpolicy.org/blog/2020/07/27/disparities/#slideshows/slideshow3/2
People detained pretrial because they can’t pay bail are much poorer than their peers – and the income gaps are widest for Black people
https://www.prisonpolicy.org/blog/2020/07/27/disparities/#slideshows/slideshow3/3
Racial disparities in prison incarceration rates, by sex, 2018
https://www.prisonpolicy.org/blog/2020/07/27/disparities/#slideshows/slideshow4/1
Most people in prison are poor,
 and the poorest are women and people of color
https://www.prisonpolicy.org/blog/2020/07/27/disparities/#slideshows/slideshow4/2
Black people are disproportionately serving sentences of life, life without parole, or “virtual life”
https://www.prisonpolicy.org/blog/2020/07/27/disparities/#slideshows/slideshow4/3
Black people are overrepresented on death row, while white people are underrepresented
https://www.prisonpolicy.org/blog/2020/07/27/disparities/#slideshows/slideshow4/4
Black men and women are overrepresented in solitary confinement, when compared to total prison populations
https://www.prisonpolicy.org/blog/2020/07/27/disparities/#slideshows/slideshow4/5
The “prison penalty” in unemployment disproportionately punishes formerly incarcerated Black men and women
https://www.prisonpolicy.org/blog/2020/07/27/disparities/#slideshows/slideshow5/1
Formerly incarcerated people have very high rates of homelessness, especially women and people of color
https://www.prisonpolicy.org/blog/2020/07/27/disparities/#slideshows/slideshow5/2
Incarceration and wealth accumulation, by race and ethnicity
https://www.prisonpolicy.org/blog/2020/07/27/disparities/#slideshows/slideshow5/3

Police violence is a systemic problem in the U.S., not simply incidental, and it happens on a scale far greater than other wealthy nations.

by Alexi Jones and Wendy Sawyer, June 5, 2020

There is no question that the number of police killings of civilians in the U.S. – who are disproportionately Black and other people of color – are the result of policies and practices that enable and even encourage police violence. Compared to police in other wealthy democracies, American police kill civilians at incredibly high rates:

chart comparing the rates of police killings in the U.S. with 9 other wealthy nations. The U.S. rate of 33.5 per 10 million people is over 3 times higher than the next-highest rate, which is 9.8 per 10 million people in Canada

The chart above compares the annual rates of police killings in each country, accounting for differences in population size. This is the most apples-to-apples comparison we can make with this data.1 But the total number of deaths at the hands of police is also worth seeing in comparison with other countries:

chart comparing the total number of police killings in the U.S. with 9 other wealthy nations. U.S. police killed 1,099 people in 2019, while none of the other 9 countries compared had more than 36 police killings in the most recent year with data

The sources for these charts are listed in the table below. For more statistics on police, arrests, and incarceration in the United States, see these other pages:

Country Annual number of law enforcement killings Total population Law enforcement killings per 10 million people Source for number of law enforcement killings Data year Source for total population
United States 1,099 328,239,523 33.5 Mapping Police Violence 2019 U.S. Census Population Clock (population as of July 1, 2019)
Canada 36 36,708,083 9.8 CBC News, Deadly force:
Fatal encounters with police in Canada: 2000-2017
2017 Statistics Canada (population estimate as of July 1, 2017)
Australia 21 24,770,700 8.5 National Deaths in Custody Program, Deaths in custody in Australia 2017-18. This includes deaths that occurred in police custody and custody-related operations (i.e. motor vehicle pursuit deaths). 2017-2018 (1 year of data) Australian Demographic Statistics December 2017 (Year-end 2017 population estimate)
The Netherlands 4 17,282,163 2.3 Public Prosecution Service 2019 Statistics Netherlands (CBS) Population key figures (2019 population estimate)
New Zealand 1 4,840,600 2.1 NZ Police Tactical
Options Research Report, 2018
2018 New Zealand Government Statistics (Year-end 2018 estimate)
Germany 11 82,905,782 1.3 DPA news agency, as cited by Deutsche Welle in German police kill sword-wielding man in front of his mother (2019) 2018 The World Bank, population data (2018 population estimate)
England and Wales 3 59,439,840 0.5 INQUEST, Fatal police shootings 2019 UK Office for National Statistics, Estimates of the population for the UK, England and Wales, Scotland and Northern Ireland (see link to Excel file; we used mid-2019 population estimate for England and Wales only)
Japan 2 126,529,100 0.2 Axios, Police kill far more people in the U.S. than in most rich countries (2020) 2018 The World Bank, population data (2018 population estimate)
Iceland 0 352,721 0 NBC News, Iceland is a gun-loving country with no shooting murders since 2007 (2018) Every year except 2013, when the police shot and killed someone for the first and only time. The World Bank, population data (2018 population estimate)
Norway 0 5,311,916 0 Norwegian Bureau for the Investigation of Police Affairs, Annual Report 2018 (reporting no fatal shootings that year) 2018 The World Bank, population data (2018 population estimate)

Footnotes

  1. The data here reflect the number of police killings of civilians reported in each country. They do not account for the manner of death, as that data was not available for every country. The rates account for population only; they do not reflect differences in police-public contact rates nor the rate of gun ownership in each country, nor any other point of comparison that might partially explain these differences. The statistics presented here can only illuminate the vast differences between policing in the U.S. and in other wealthy nations, not explain them.  ↩


Police disproportionately target Black and other marginalized people in stops, arrests, and use of force; and are increasingly called upon to respond to problems, such as homelessness, that are unrelated to public safety.

by Wendy Sawyer, June 5, 2020

Many of the worst features of mass incarceration — such as racial disparities in prisons — can be traced back to policing. Our research on the policies that impact justice-involved and incarcerated people therefore often intersects with policing issues. Now, at a time when police practices, budgets, and roles in society are at the center of the national conversation about criminal justice, we have compiled our key work related to policing (and our discussions of other researchers’ work) in one briefing.


1. Nearly 1 million people in the U.S. experience the threat or use of force by police annually, and they are disproportionately Black and Latinx.

chart showing that police are twice as likely to use force against people of color. Over 5% of Black and Hispanic survey respondents reported experiencing the threat or use of force when most recently approached by police, compared to just 2% of white respondents The scale of police use of force is an important fact in and of itself, made more troubling by the racial disparities evident in police stops and use of force. In a national survey, Black respondents were more likely to be stopped by police than white or Latinx respondents, and both Black and Latinx respondents were more likely to be stopped multiple times over the course of a year than white respondents. The survey also showed that when they initiated a stop, police were twice as likely to threaten or use force against Black and Latinx respondents than whites. These disparate experiences have predictable effects on public trust in police: white respondents were more likely to view police use of force as legitimate and more likely to seek help from police than were people of color.


2. Over 4.9 million people are arrested each year.

pie chart style illustration showing that of the 4.9 million people arrested and jailed each year, 3.5 million have just one arrest, 928,000 have two arrests, and 428,000 have 3 or more arrests that year In all, there are over 10 million arrests in the U.S. each year, but many people are arrested multiple times per year. From responses to a national survey, we estimate that at least 4.9 million unique individuals are arrested and jailed each year, and at least one in four of those individuals are arrested more than once in the same year. The massive scale of these police responses means that there are millions of opportunities each year for police-civilian encounters to turn violent or fatal, and an estimated 77 million people are now saddled with a criminal record.


3. Most policing has little to do with real threats to public safety: the vast majority of arrests are for low-level offenses. Only 5% of all arrests are for serious violent offenses.

The “massive misdemeanor system” in the U.S. is an important but overlooked contributor to overcriminalization and mass incarceration. For behaviors as benign as jaywalking, sitting on a sidewalk, or petty theft, an estimated 13 million misdemeanor charges sweep droves of Americans into the criminal justice system each year (and that’s excluding civil violations and speeding). And while misdemeanor charges may sound like small potatoes, they carry serious financial, personal, and social costs, especially for defendants but also for broader society, which finances the enforcement of these minor violations, the processing of these court cases, and all of the unnecessary incarceration that comes with them.


4. Policing criminal law violations costs taxpayers over $63 billion each year.

large circle showing the relative size of police expenditures to other costs of mass incarceration from the following the money of mass incarceration report. Policing costs the public $126.4 billion per year, nationwide. In our report about the fiscal costs of mass incarceration to the government and families of justice-involved people, we used only half of that figure – $63.2 billion – because only about half of police work is devoted to criminal law enforcement. The other half is spent on things unrelated to criminal law violations, such as traffic control, responding to civil disputes, and administration. Even at half the total cost of policing, $63.2 billion represents a huge public investment in criminalization. As many Americans are questioning the role of police in society, they should know just how much money is available to redirect to more humane community-based responses to social problems.


5. People who are Black and/or poor are more likely to be arrested, and to be arrested repeatedly.

chart comparing the percentage unemployed, the percentage with no high school diploma, and the percentage with an annual income below $10,000 among people with zero, one, or two or more arrests in one year. Unemployment, lack of diploma, and poverty are all much higher among people with multiple arrests. People who are arrested and jailed are often among the most socially and economically marginalized in society. The overrepresentation of Black men and women among people who are arrested is largely reflective of persistent residential segregation and racial profiling, which subject Black individuals and communities to greater surveillance and increased likelihood of police stops and searches. Poverty, unemployment, and educational exclusion are also factors strongly correlated with likelihood of arrest.


6. People with mental illnesses or substance use disorders are also more likely to be arrested, and to be arrested repeatedly.

chart comparing health needs among people arrested and booked zero, one, or two or more times in one year. Over a quarter of people arrested multiple times had a serious or moderate mental illness, serious psychological distress, and/or no health insurance. Over half had a substance use disorder. People who are arrested often have serious health needs that cannot and should not be addressed through policing or incarceration. Even a few days in jail can be devastating for people with serious mental health and medical needs, as they are cut off from their medications, support systems, and regular healthcare providers. Even worse, many people are arrested in the midst of a health crisis, such as mental distress or substance use withdrawal. History has shown that jails are unable to provide effective mental health and medical care to incarcerated people, and too often, jailing people with serious health problems has lethal consequences.


7. Women make up a growing share of arrests and report much more use of force than they did 20 years ago, with Black women most likely to be targeted.

chart comparing the increase in police use of force reported by men and women from 1999 to 2015. The number of men experiencing use of force doubled, while the number of women experiencing use of force more than quadrupled. The experiences of women and girls – especially Black women and other women of color – are often lost in the national conversation about policing. But of course women, too, are subject to racial profiling, use of excessive force, and any number of violations of their rights and dignity by police. Our analysis of national data shows that women now make up over a quarter of all arrests, with an estimated 2.8 million arrests in 2018. At the same time, the use of force has become much more common among women: the number of women who experienced police use of force (about 250,000) was 3.5 times greater in 2015 compared to 1999.

A closer examination of the data also reveals racial disparities in police stops, arrests, and use of force involving women. Black women are more likely than white or Latina women to be stopped while driving, and Black women are arrested 3 times as often as white women and twice as often as Latinas during police stops. Black women also report experiencing police use of force at higher rates than white or Latina women. With an estimated 12 million women per year experiencing police-initiated encounters – many of which involve searches, use of force, and other traumatizing experiences – the harms of policing to women demand more attention.


8. Disabled people represent a disproportionate number of those stopped, arrested, and killed by police.

As the ACLU of Southern California and the Bazelon Center for Mental Health Law report, many criminalized behaviors targeted by law enforcement are related to disability: substance use (often used as self-medication for pain and other symptoms), homelessness (an estimated 78% of people in shelters have a disability), and atypical reactions to social cues, which may be interpreted as vaguely defined crimes such as “disorderly conduct.” The Ruderman Foundation reports that in police use-of-force incidents, the media and police often blame disabled people for their own victimization, especially by characterizing disabled people of color as “threatening” and “refusing to comply.”

The frequent use of police as first responders to individuals in crisis only compounds these problems. Too often, officers who are called to help individuals get medical treatment end up shooting them instead. Public funds should be redirected to community health providers to handle mental and physical health crises, rather than trying to meet this critical need with militarized police forces, who sometimes receive little training on crisis response or de-escalation.


9. Police treat Black Americans with less respect.

A Stanford University analysis of police bodycam footage from nearly 1,000 vehicle stops substantiates what Black Americans already know: police officers treat Black people differently than they do whites. This study, discussed in our briefing, finds that “police officers speak significantly less respectfully to black than to white community members in everyday traffic stops,” and that this happens irrespective of officer race, severity of the infraction, and outcome of the stop. These findings lend important context to the racial disparities observed in police encounters.


10. State and federal law enforcement practices target poor Black and Latinx residents.

Separate reports focusing on policing in Chicago highlighted two law enforcement strategies justified as ways to protect communities – drug stings and asset forfeiture – that facilitate widespread targeting of low-income communities of color. Federal agents from the Bureau of Alcohol, Tobacco, Firearms, and Explosives (ATF) arranged drug stings that set up fake drug stash houses and lured people into committing new crimes. But they didn’t single out just anyone: At least 91% of the time, agents targeted Black and Latinx people. Columbia professor Jeffrey Fagan’s analysis found no statistical explanation for this except disparate racial treatment. A District Court judge described these cases as “ensnaring chronically unemployed individuals from poverty-ridden areas.”

Meanwhile, Cook County police conducted 23,000 seizures of assets connected to civil and criminal cases, a practice that is supposed to disrupt major illegal drug trades. But an analysis by Reason and the Lucy Parsons Lab showed that police officers were often taking petty property and the lowest-value seizures (valued under $100) were clustered in predominantly poor and Black communities on Chicago’s South and West Sides. These examples illustrate that at every level, the “war on drugs” functions as a war on communities of color.


For more information, the reports and briefings summarized here – and more – can be found on our Policing Issue page.

Acknowledgements: This briefing was compiled by Wendy Sawyer based on previously published writing by current staffers Wanda Bertram, Alexi Jones, Wendy Sawyer, and by Policy Initiative alumns Joshua Aiken, Alex Clark, Lucius Couloute, and Elliot Oberholtzer.


We offer five areas where quick action could slow the spread of the viral pandemic in prisons and jails and in society as a whole.

by Peter Wagner and Emily Widra, March 27, 2020

The United States incarcerates a greater share of its population than any other nation in the world, so it is urgent that policymakers take the public health case for criminal justice reform seriously and make necessary changes to protect people in prisons, in jails, on probation, and on parole.

Below, we offer five far-reaching interventions that policymakers can use to slow the spread of the virus in the criminal justice system and broader society. We previously published a list of common sense reforms that could slow the spread of the virus in jails and prisons. In light of the rapid spread of COVID-19 throughout the U.S., and specifically in prisons and jails, we found it necessary to update these recommendations with more detail about who has the power and responsibility to enact policy change, and how to reform the criminal justice system in the midst of a public health crisis.

Quick action is necessary for three reasons: Correctional staff and incarcerated populations are already testing positive, the justice-involved population disproportionately has health conditions that make them more vulnerable, and the staffing resources required to make policy changes will be depleted long before the pandemic peaks.

The incarcerated and justice-involved populations contain hundreds of thousands of people who may be particularly vulnerable to COVID-19, including those with lung disease, asthma, serious heart conditions, diabetes, renal or liver disease, and with other immunocompromising conditions. Protecting vulnerable people will not only improve outcomes for them, but will also reduce the burden on the healthcare system, protect essential correctional staff from illness, and slow the spread of the virus.

Health conditions that make respiratory diseases like COVID-19 more dangerous are far more common in the incarcerated population than in the general U.S. population. Pregnancy data come from our report, Prisons neglect pregnant women in their healthcare policies, the CDC’s 2010 Pregnancy Rates Among U.S. Women, and data from the 2010 Census. Cigarette smoking data are from a 2016 study, Cigarette smoking among inmates by race/ethnicity, and all other data are from the 2015 BJS report, Medical problems of state and federal prisoners and jail inmates, 2011-12, which does not offer separate data for the federal and state prison populations. Cigarette smoking may be part of the explanation of the higher fatality rate in China among men, who are far more likely to smoke than women.
Prevalence of health condition by population
Health condition Jails State prisons Federal prisons United States
Ever tested positive for Tuberculosis 2.5% 6.0% 0.5%
Asthma 20.1% 14.9% 10.2%
Cigarette smoking n/a 64.7% 45.2% 21.2%
HIV positive 1.3% 1.3% 0.4%
High blood pressure/hypertension 30.2% 26.3% 18.1%
Diabetes/high blood sugar 7.2% 9.0% 6.5%
Heart-related problems 10.4% 9.8% 2.9%
Pregnancy 5.0% 4.0% 3.0% 3.9%

The final reason to move quickly is that, even under normal circumstances, establishing and implementing new policies and practices is something that the government finds challenging to do on top of its other duties. Now that the number of COVID-19 cases is higher in the U.S. than any other country, we know that more people will continue to be directly impacted by illness, including policymakers and government leaders. With the possibility of up to 40% of government lawyers and other policymakers getting sick or taking care of sick relatives, making policy change is going to be much harder and take far longer. If the government wants to protect both justice-involved people and their already overstretched justice system staff from getting the virus and spreading it further, they need to act now.

Here are five places to focus:


1. Reduce the number of people in local jails.

State leaders must remember that local jails are even less equipped to handle pandemics than state prisons, so it is even more important to reduce the burden of a potential pandemic on jails. Generally speaking, there are two ways to reduce jail populations: reduce admissions or release more people.

Reduce admissions. This may be the simplest strategy that would show quick results because of the high turnover in jails.1 If a typical jail stopped admitting people entirely, its population would be cut by 54% in just 7 days. More realistically, if that same jail could reduce admissions by just half, its population would be more than 25% smaller in a week.2
Different actors within the system can achieve this using their discretionary powers:

  • Police can reduce the number of arrests, particularly for what they determine to be “petty offenses.”
  • Prosecutors can refuse to prosecute certain offenses and consent to release on one’s own recognizance3 (ROR) for most or all people charged with crimes. They can defer prosecution, dismiss charges outright, or instead refer defendants to social services or other alternatives to incarceration or detention.
  • Courts can vacate “bench warrants” (warrants for unpaid court fines/fees and for failure to appear for hearings) so that law enforcement can focus on public safety concerns and so that people with active bench warrants do not avoid seeking medical attention for fear of arrest. Recognizing the extreme economic stress that most low-income people will experience during this time, courts should refuse to jail anyone for unpaid fines and fees, automatically postpone any court hearings related to fines and fees, or just proactively forgive these debts.
  • Jails can refuse to rent space to other agencies. In some states, as much as 8% of the capacity is dedicated to USMS4, 10% to ICE5, and 66% to state prisons.6 In addition, jails should refuse to admit people accused of violating technical rules of their state probation or parole. As we recently found, technical violators can make up a huge part of a jail’s population.
  • State and local legislatures can expand the list of “non-jailable” offenses, which are not subject to arrest but can only be fined or cited.

Release more people. Jail administrators can also accelerate releases of people currently in custody. In situations where administrators and sheriffs may not have the authority7 to do this on their own, they are still well positioned to suggest to courts, prosecutors and defense attorneys who could be released. Here are some suggested categories for release eligibility:

  • People nearing the end of their sentence. 35% of people in jails are serving a sentence, typically under a year. That means that nationally, roughly 75,000 people in jail today are within 3 months of their release date.
  • People who are medically fragile, including older people (there are 20,000 people over the age of 60 in jails) and people with chronic illnesses, especially those that have higher mortality risks from COVID-19, like chronic lung disease, moderate to severe asthma, serious heart conditions, diabetes, renal failure, liver disease and the immunocompromised, including those undergoing cancer treatment. Facilities should also release pregnant women.8
  • People held on low bail amounts. Sadly, bail is often used as a wealth test for freedom rather than a test of dangerousness or likelihood to show up for court. But consider this: if your facility is currently holding people who would be released if they could come up with a small 9 amount of money, why are you still holding them? Once bail has been set, the court has already concluded that the individual is not a threat to public safety, since bail is meant to incentivize court appearance, not to detain people the court considers dangerous. Prosecutors, defense attorneys, judges, and the jails — preferably in cooperation with each other — need to generate a list of people whose bail should be lowered to $0 and then make sure those people are released as soon as possible.
  • People held for offenses that would not result in detention if they were arrested today, now that some offense-based changes have already been implemented in response to the pandemic.


2. Reduce the number of people in state and federal prisons.

This can be done through some restrictions to admissions and most dramatically by increasing releases.

The simplest way to reduce admissions is to refuse admissions for technical violations of probation and parole rules. In 2016, 60,000 people were returned to state prison for behaviors that, for someone not on probation or parole, would not be a crime.

The decision to reduce admissions for technical violations can be made at the level of individual parole or probation officers, at the supervisory level, at the level of parole and probation boards, or at the level of state and county executives and legislatures. Any and all of these actors should take immediate action.

Other groups that states should immediately consider for release include:

  • People nearing the end of their sentence. Approximately 600,000 people are released from prison every year. If they are going to be released within the next few months anyway, why not release them now? 10
  • People in minimum security facilities and who are on work-release.
  • People who are medically fragile or are older. Prisons house large numbers of people with chronic illnesses and complex medical needs that make them more vulnerable to becoming seriously ill and requiring more medical care for COVID-19. (There are 132,000 people who are at least 55 years old in state prisons. The prevalence rates of chronic health conditions that put people at risk for serious complications from COVID-19 are higher in state and federal prisons than the general population.)
  • Anyone whose offense is considered “minor” or anyone who has a “low likelihood” of committing another serious offense.11

States have many options for how to release these individuals. Mechanisms for increasing releases include:

  • Parole boards can parole more people who are parole-eligible. They can also accelerate the normal review process, reduce the time between parole reviews, and eliminate the often months-long delays between parole decisions and actual release. (For instance, such delays are often the result of parole boards requiring people to complete program requirements, but under the circumstances, these requirements can and should be waived.)
  • Governors can grant partial clemency to people who are a short period away from parole eligibility so that the parole board can consider them for release now.
  • Governors, legislatures and other agencies can change good-time formulas to allow people additional credit for time served. Commonly called things like “good time,” “meritorious credit” or something similar, these systems shorten the time incarcerated people must serve before becoming parole eligible or completing their sentences. Many states give correctional agencies some discretion on awarding good time. The maximum allowed should be granted, and the formulas should be changed to make the rewards more generous.
  • Governors can explore letting some people go on temporary furloughs who already meet most other criteria for release. (This used to be common in the U.S., and in response to the pandemic, Iran temporarily released 85,000 people and Ethiopia released 4,000 people.)
  • Judges can resentence individuals to make them eligible for release on parole or on completion of the revised sentence.
  • ICE, the U.S. Marshals Service and other agencies that send detainees to local jails for confinement can order their release, just as they should do for the people confined in the facilities that they run. These systems should not think for a moment that just because they have outsourced the jailing of these detainees, they are exempt from their moral and public health duty to reduce the density of correctional facilities.

For a model plan for releasing people from prisons, see this emergency plan developed for Indiana by a coalition of formerly incarcerated people and current volunteers and employees of the Indiana correctional system. The plan answers logistical questions such as how people can be quarantined outside of prisons before reentering their communities, how the reentry system can manage the release of thousands of people on short notice, and how to protect correctional staff and their families throughout the process.


3. Eliminate unnecessary face-to-face contact for justice-involved people.

The criminal justice system makes it difficult for people on probation, parole, and registries — and the staff of those systems — to practice the social distancing necessary to prevent the spread of COVID-19. There are at least 7 strategies that probation, parole, registries and the courts can implement to promote social distancing:

  • Judges should postpone as many court sessions as possible. They should do so automatically and in advance. Courts should be reluctant to try cases or hold hearings over video monitors,12 and they should never consider detaining someone they do not feel comfortable — for public health reasons — having in their court room.
  • Reduce the number of people on the probation and parole rolls. This would reduce the number of people subject to the conditions of probation and parole, which often contradict social distancing guidelines (i.e. required in-person meetings with parole or probation officers), and would free up probation and parole staff to focus limited resources on the higher-need people who remain under their supervision. This may require help from the governor via mass clemency, the legislature, or the courts, and could also involve strategies like applying time-served credits for successful past compliance with probation or parole restrictions.
  • Reduce, rather than expand, use of GPS/electronic monitoring. Electronic monitoring requires correctional staff to install (and maintain) the devices and thus to violate social distancing guidelines. Because these devices require monitored people to request permission to leave their designated areas — a process which can take days — electronic monitoring will restrict people from seeking appropriate medical treatment, not to mention imposing additional user fees payable to the monitoring companies that low income people struggle to pay during the best of times.
  • Minimize in-person requirements. Parole and probation offices should limit face-to-face meetings (especially in crowded offices), suspend on-site drug testing, and limit home visits.
  • Courts should cancel pretrial meetings, court-ordered classes, collection of court debt, and all collateral consequences for failure to pay fines and fees.
  • Courts, probation offices, and parole offices should eliminate supervision fees, including those that are paid to third-party monitoring services. Under the additional financial pressure created by the pandemic, many more people under supervision will be unable to afford fees, which will put them at risk of arrest and incarceration. This isn’t a good use of criminal justice resources right now.
  • When faced with technical violations of parole or probation rules — behaviors that, for people not on parole or probation, would not warrant incarceration — police should refuse to arrest, jails should refuse to admit, and parole/probation boards should not consider revocation. If necessary, alternative sanctions should be imposed that can be complied with from home, such as completion of an online course or more frequent phone/video check-ins.


4. Make correctional healthcare humane (and efficient) in a way that protects both health and human dignity.

Both incarcerated people and staff would benefit from a health care system that prioritizes human life and dignity over money. Here are some ideas:

  • Eliminate medical copays that deter people from seeking healthcare in prison and jail. As of March 27, Hawaii, Kansas, and Nevada state prisons are still charging copays, and Delaware, Maryland, Oklahoma, and Utah have at least twice failed to respond to our inquiries about their copay policy during the pandemic. (For the current status of all states see the copays section of our virus response page.)
  • Ensure that staff have sufficient paid sick leave and encourage staff to stay home if they or anyone in their family shows symptoms. Making the necessary changes to reduce overcrowding (and confinement overall) will greatly reduce the need for over-burdened administrators to ask staff to work when sick.
  • Provide for basic healthcare needs behind bars, starting with the basic requisites for effective hand-washing. Stop charging incarcerated people for basic products that can protect them from illness. People in prison should not be reliant on COVID-19 fundraisers for necessities such as soap.
  • Ensure that facility overcrowding never reduces the quality of the health care provided. When overcrowding or budget concerns impact health care, the first response should always be to reduce the facility population until health care can meet constitutional standards.
  • Staff in courts, prisons, and jails should ensure that incarcerated people’s health concerns are taken seriously.
  • Ensure that the physical and mental health–and human dignity–of people who remain in prison is protected. Particularly helpful is the 40 point checklist prepared by the Washington State Office of Corrections Ombuds, based on the CDC’s guidance to correctional facilities.


5. Don’t make this time more stressful for families (or more profitable for prison telephone providers) than absolutely necessary.

For people in the free world, communication is almost free, but for the families of incarcerated people, phone calls, video calls and emails are quite expensive. At this time of great stress for everyone, the facilities need to do better:

  • Provide unlimited, free phone calls so that families can maintain contact throughout the pandemic when visitation is suspended. Allowing people to assure themselves that their families are safe will greatly reduce stress and anxiety, which, due to the pandemic, are sky-high inside prisons and jails.
  • Facilities that do not have video calling systems already in place should temporarily refit the now-empty visiting rooms to support free video calling options with publicly available services like Zoom and Skype. These services can often be installed quickly without the involvement and costs of the prison telephone industry giants.

~

Since our first coronavirus briefing at the beginning of March, we have been tracking how federal, state, and local officials have responded to the threat of COVID-19 in the criminal justice system. A number of jurisdictions have taken quick and laudable actions to protect the most vulnerable justice-involved people, including reducing the number of arrests and bookings, releasing people held pretrial, reducing admissions to state prisons, and suspending medical copays in most states. Given the toll COVID-19 has already taken on our jails and prisons, as well as our society at large, the time is now for federal, state, and local officials to put public health before punishment.


Footnotes

  1. Although national numbers of jail releases per day are not available, the number of jail admissions — 10.6 million annually — is relatively stable, with the jail population turning over quickly, at an average rate of 54% each week. Assuming, then, that the number of admissions is about the same as the number of releases, we estimate that about 29,000 people are released from jails in the U.S. every day (10.6 million divided by 365 days per year). In comparison, in 2017, state and federal prisons admitted and released over 600,000 people, averaging about 12,000 releases a week or 1,700 per day. For state-by-state data, we estimated the number of releases in a similar fashion — we divided the number of annual admissions and releases, obtained from the Census of Jails, 2013, by 365 days. Governors of other states may want to see this table based on data from the Census of Jails, 2013:

    State Jail Admissions Jail Releases
    Alabama 286,843 249,418
    Alaska 5,392 3,686
    Arizona 210,399 202,484
    Arkansas 258,321 232,255
    California 1,102,972 995,338
    Colorado 211,397 197,866
    District of Columbia 12,008 12,238
    Florida 732,602 680,801
    Georgia 602,648 537,857
    Idaho 104,539 50,384
    Illinois 315,553 290,264
    Indiana 270,415 277,994
    Iowa 127,179 123,693
    Kansas 153,914 142,759
    Kentucky 548,733 509,413
    Louisiana 317,091 334,730
    Maine 37,995 33,934
    Maryland 156,659 164,736
    Massachusetts 58,115 76,253
    Michigan 359,631 348,584
    Minnesota 188,662 180,393
    Mississippi 125,961 119,682
    Missouri 252,131 239,562
    Montana 48,418 39,179
    Nebraska 72,616 72,687
    Nevada 144,256 146,657
    New Hampshire 20,841 22,187
    New Jersey 147,088 134,407
    New Mexico 150,488 142,035
    New York 219,320 201,939
    North Carolina 417,199 433,700
    North Dakota 39,367 35,979
    Ohio 405,313 395,648
    Oklahoma 409,293 261,454
    Oregon 176,549 172,476
    Pennsylvania 209,732 213,319
    South Carolina 301,594 325,976
    South Dakota 56,477 56,851
    Tennessee 461,375 439,364
    Texas 1,144,687 1,083,223
    Utah 97,509 98,651
    Virginia 355,549 304,466
    Washington 283,627 305,963
    West Virginia 47,439 46,210
    Wisconsin 227,243 208,406
    Wyoming 29,384 30,803

     ↩

  2. In Florida alone, more than 2,000 people are admitted and nearly as many are released from county jails each day.
     ↩

  3. Release on own recognizance, or ROR, is essentially when someone charged with a crime is not required to pay any money for pretrial release or comply with other conditions such as pretrial supervision. For example, a prosecutor may consent to ROR when it is someone’s first arrest and there is no reason to think that the person would not show up for future court dates.
     ↩

  4. In 2013, 8% of Texas jail capacity went to U.S. Marshalls Service detainees. The figure was 7% in New Hampshire, 6% in Missouri, and 5% in Arkansas, Illinois, Kentucky, Maine, Montana, and North Carolina. For the data for all states, see Table 2 to our report Era of Mass Expansion:
    Why State Officials Should Fight Jail Growth
    .
     ↩

  5. In 2013, 10% of New Jersey jail capacity went to immigration detainees. The figure was 5% in Wisconsin, Massachusetts and Arizona, and 4% in Utah, Nevada, New York and Colorado. For the data for all states, see Table 2 to our report Era of Mass Expansion:
    Why State Officials Should Fight Jail Growth
    .
     ↩

  6. In 2013, 68% of Louisiana jail capacity went to housing people for the state prison system. The figure was 51% in Kentucky, 50% in Mississippi, 39% in Arkansas, 36% in Tennessee, and 32% in West Virginia. For the data for all states, see Table 2 to our report Era of Mass Expansion:
    Why State Officials Should Fight Jail Growth
    .
     ↩

  7. Professor Aaron Littman at the UCLA School of Law has compiled a spreadsheet [.pdf download] to help readers understand which local officials have the power to release people from jails. The information in the spreadsheet is state-specific.  ↩

  8. Policymakers should also double their efforts — without slowing down actual releases — to plan for a continuity of health care after release, including getting people signed up for Affordable Care Act coverage and giving them referrals for other treatment as needed.  ↩

  9. One way the Los Angeles County Sheriff’s Department is reducing its jail population is by allowing deputies to cite and release anyone whose total bail would amount to less than $50,000.  ↩

  10. We know that some will ask about where these people will go. As is always the case, some have a home and support system waiting for them. Others will experience homelessness or housing instability. Unfortunately, the current struggle of formerly incarcerated people to secure housing is still likely safer than a possible death sentence from forced confinement in one of the densest housing situations on the planet.  ↩

  11. Note that people convicted of violent crimes and sex offenses are the least likely to commit a similar offense in the future.  ↩

  12. Holding court hearings via video may violate due process rights and other rights afforded under the federal and state constitutions, and it has been proven to change the outcomes of judicial decisions for the worse. For example, using video to set bail has been shown to increase bail amounts by 65%. Policy makers considering video should also consider the chilling findings from 2015 study by Ingrid Eagly of the impact of using video during federal immigration proceedings:

    “Comparing the outcomes of televideo and in-person cases in federal immigration courts, it reveals an outcome paradox: detained televideo litigants were more likely than detained in-person litigants to be deported, but judges did not deny respondents’ claims in televideo cases at higher rates. Instead, these inferior results were associated with the fact that detained litigants assigned to televideo courtrooms exhibited depressed engagement with the adversarial process — they were less likely to retain counsel, apply to remain lawfully in the United States, or seek an immigration benefit known as voluntary departure.”
     ↩


Nearly one out of every 100 people in the United States is in a prison or jail.

by Peter Wagner and Wanda Bertram, January 16, 2020

We’re often asked what percent of the U.S. population is behind bars. The answer: About 0.7% of the United States is currently in a federal or state prison or local jail. If this number seems unworthy of the term “mass incarceration,” consider that 0.7% is just shy of 1%, or one out of a hundred. And a little more context shows that this fraction is actually incredibly high.

Because talking about portions of a percentage can be confusing, this concept is more often expressed as a rate: The United States currently incarcerates 698 per 100,000 people. (The rate is out of 100,000, rather than 1,000 or 10,000, because back when incarceration was much rarer you needed a larger denominator to express the rate in whole numbers. But either way, these are all different ways of expressing the same percentage.)

In some ways, though, looking at the portion of a country that is incarcerated understates the sheer size of mass incarceration, because the denominator includes many groups that are infrequently incarcerated. For example, no toddlers, few adolescents, and not very many teenagers are incarcerated.

Age curve of youth in the juvenile justice system.

Rather than calculating how many people in the U.S. are incarcerated, you could calculate how many adults are incarcerated (0.88%), or how many working-age adults are incarcerated (1.07%). These statistics are rhetorically useful, but are often difficult to pair with compatible data from other countries, states or topics, so they’re not used very often.

There is another way to look at the scale and uniqueness of the U.S mass incarceration experiment: Less than 5% of the world’s population is in the United States, but 20% of the world’s incarcerated people are right here:

Graph showing that 1 out of 5 prisoners in the world is incarcerated in the U.S.

For more perspectives on the scale of mass incarceration, see:


As of August 2021, the newest available data on incarceration in both the U.S. and globally does not change any of the statistics or percentages referenced in this article.


The government hasn’t collected national data on the race or ethnicity of people awaiting trial in jail since 2002. We review the academic literature published since then to offer a more current assessment of racial disparities in pretrial detention.

by Wendy Sawyer, October 9, 2019

Being jailed before trial is no small matter: It can throw a defendant’s life into disarray and make it more likely that they will plead guilty just to get out of jail.1 As advocates bring national attention to these harms of pretrial detention, many places – most recently New Jersey, California, New York, and Colorado – have passed reforms intended to dramatically reduce pretrial populations.

But it’s not enough to simply bring pretrial populations down: Another central goal of pretrial reform must be to eliminate racial bias in decisions about who is detained pretrial and who is allowed to go free. Historically, Black and brown2 defendants have been more likely to be jailed before trial than white defendants. And recent evidence from New Jersey and Kentucky shows that while some reforms have helped reduce pretrial populations, they’ve had little or no impact on reducing racial disparities.

As of 2002 (the last time the government collected this data nationally), about 29% of people in local jails were unconvicted – that is, locked up while awaiting trial or another hearing. Nearly 7 in 10 (69%) of these detainees were people of color, with Black (43%) and Hispanic (19.6%) defendants especially overrepresented compared to their share of the total U.S. population. Since then, pretrial populations have more than doubled in size, and unconvicted defendants now make up about two-thirds (65%) of jail populations nationally. With far more people exposed to the harms of pretrial detention than before, the question of racial justice in the pretrial process is an urgent one – but the lack of national data has made it hard to answer.

Side by side bar graphs show that pretrial jail populations have more than doubled from 182,754 in 2002 to 482,000 in 2017, and that as of the last national data collection in 2002, the pretrial population nationwide was 43 percent Black, 19.6 percent Hispanic, 31 percent white, and 6.4 percent other or two or more races.While pretrial jail populations have grown to make up almost two-thirds of jail populations nationally, and Black and Hispanic defendants were overrepresented in the 2002 population, no national data have been collected since then to assess how racial disparities may have changed.

So what, exactly, is the state of racial justice in pretrial detention? And how can advocates assess racial justice in their county or state? What data do they need, and where can they find it? This briefing reviews findings from recent studies of racial disparities in pretrial decisions – including both national and more geographically-limited analyses – and then suggests sources for further research to understand and address the problem.

To assess the state of racial justice in pretrial detention since the last national survey was conducted nearly 20 years ago, I reviewed more recent academic literature – studies that utilize other data sources and offer more nuanced analysis.

Overall, the available research suggests that:

  • In large urban areas, Black felony defendants are over 25% more likely than white defendants to be held pretrial.
  • Across the country, Black and brown defendants are at least 10-25% more likely than white defendants to be detained pretrial or to have to pay money bail.
  • Young Black men are about 50% more likely to be detained pretrial than white defendants.
  • Black and brown defendants receive bail amounts that are twice as high as bail set for white defendants – and they are less likely to be able to afford it.
  • Even in states that have implemented pretrial reforms, racial disparities persist in pretrial detention.

National data is limited and outdated

Only one publicly-accessible study uses a nationally representative sample to measure pretrial detention status by race: the Survey of Inmates in Local Jails (SILJ), which was last conducted in 2002. Considering that jails and policing practices have changed significantly since 2002, an update to this dataset – now slated for 2021 – is long overdue.

Since 2002, national studies have been limited to felony cases in large urban counties. These studies are based on the Bureau of Justice Statistics’ (BJS) State Court Processing Statistics (SCPS), data which were last collected in 2009. The data include both demographic and case characteristics for each defendant, allowing researchers to control for legally-relevant factors like offense type, number of arrest charges filed, prior criminal record, and whether the defendant had failed to appear in court before. While BJS’ own publications based on this dataset (the Felony Defendants in Large Urban Counties series) do not provide a breakdown of pretrial detention by race or ethnicity, some academic researchers have used it for that purpose. (For a full list of their studies, see the appendix to this article.)

These national studies of felony cases in large counties generally conclude that the direct impact of race on pretrial decisions is weak, but that racial bias acts cumulatively to affect outcomes, and indirectly via factors like ability to pay for bond or a private attorney. McIntyre & Baradaran’s analysis of 1990-2006 SCPS data concludes that Black defendants are over 25% more likely to be held pretrial than white defendants. The most recent SCPS data, from 2009, supports that finding: Even after controlling for age, gender, and a number of conceivably legally-relevant factors (most serious charge, prior arrests, etc.), Dobbie & Yang (2019) find that over half (58%) of the 39 sampled counties had higher rates of pretrial detention for Black defendants than for white defendants. In 5 counties, the unexplained racial gap was over 20%.

More recent, but geographically-limited, studies help fill in the gaps

More recent analyses shed further light on racial justice in pretrial decision-making, even though their samples are not nationally representative. I looked at 16 of these more geographically-limited studies, with subjects ranging from federal drug cases in the Midwest to misdemeanor cases in Harris County (Houston), Texas. In all, they include samples from 11 states spread across the U.S., and major cities including New York City, San Francisco, Philadelphia, and Miami.

Of course, no single estimate of racial disparity in pretrial detention will apply to all counties nationwide. In the studies I reviewed, the racial gap in pretrial detention between Black and white defendants ranges widely, from about 10% to 80% depending on the study and jurisdiction (that is, the county or city).

However, these studies most frequently confirm that unexplained racial disparities continue to plague the pretrial process.3 Throughout the literature, researchers report that rates of pretrial detention and receiving financial conditions of release (i.e. money bail) are consistently higher for Black and Latinx defendants (and often Native American defendants, when they are included in the analysis). Bail bond amounts, too, are consistently higher for Black and brown defendants, even though they are less able to afford money bail. Rates of release on recognizance or other nonfinancial conditions of release, such as pretrial supervision, are likewise lower for Black and brown – versus white – defendants. Furthermore, the studies that included sex and age in their analysis found that young Black males face the greatest disadvantages.

Specifically, these studies report significant racial disparities, such as:

  • Most of these studies find that Black and brown defendants are 10-25% more likely to be detained pretrial or to receive financial conditions of release.
  • Median bond amounts, when compared, are often about $10,000 higher for Black defendants compared to white defendants. In at least one study, the median bond set for Black defendants was double the median bond set for white defendants.
  • The most recent analyses of racial disparities in pretrial detention – assessing the effects of reforms in New Jersey and Kentucky – show that pretrial assessment tools have not reduced these disparities as much as advocates hoped. After New Jersey essentially ended the use of money bail for most defendants in 2017, the total pretrial population dropped significantly, but the racial composition of the pretrial jail population changed very little. And in Kentucky, the racial disparity in pretrial release rates actually worsened after the state enacted a law requiring the use of a pretrial assessment tool.

Advocates may be able to find data about their local jails

Of course, county or city jail administrators may collect and maintain data on the racial/ethnic composition of their pretrial populations. Advocates in some jurisdictions may be able to request data about their own local pretrial jail populations, which they can compare with the overall local population for a simple measure of racial disparity. Such a comparison, however, will exclude other relevant characteristics (such as seriousness of offense or past failures to appear in court) and won’t identify what stage(s) of pretrial decision-making are affected by race (such as the decision to set a money bail amount, or how high bail was set). Nevertheless, even a crude estimate of racial disparity in local pretrial detention can help advocates draw attention to the issue and raise important questions with decisionmakers.

Where to look next for more data

Jailing Black and brown pretrial defendants more often than white defendants isn’t just unfair; it also contributes to racial disparities later in the justice process. But in order to solve this problem, local advocates and policymakers need current data about who is held pretrial in their counties and states. And in order to identify broader patterns in pretrial decision-making, we need more data at the national level as well.

Until the Bureau of Justice Statistics updates its Survey of Inmates in Local Jails – which, unfortunately, is not guaranteed to happen on schedule in 2021 due to chronic underfunding – advocates and policymakers must rely on independently-produced local studies. Academic researchers (including those referenced in this briefing) have already developed models for these local studies.

In places where there appears to be little or no data published about racial disparities in the pretrial process, advocates can partner with local academic institutions or ask state Statistical Analysis Centers for assistance. Several large-scale projects led by non-governmental organizations are also actively working to assist local jurisdictions in using their data to inform policy changes that will reduce unnecessary incarceration. For example, the MacArthur Foundation’s national Safety and Justice Challenge supports initiatives in 52 jurisdictions across the U.S. to reduce the misuse and overuse of jails. And Arnold Ventures recently launched the National Partnership for Pretrial Justice, advancing a variety of pretrial justice projects across 35 states. Measures for Justice is developing a broad, publicly-accessible database of county criminal justice data; currently it offers data from 6 states, with data from 14 more states expected in 2020. And of course, community bail funds across the country have been collecting data as they bail low-income defendants out of jail – no strings attached – and reporting high success rates that underscore just how unnecessary money bail is. These kinds of resources can help local advocates and future researchers find the data they need to measure racial disparities in pretrial justice processes, and work to eliminate them.

See the Appendix for a list of all of the sources reviewed for this briefing, with links and summaries of their findings related to racial disparities in pretrial detention.

Footnotes

  1. For more on the negative outcomes related to pretrial detention, see Dobbie, Goldin & Yang (2018) and research from the Pretrial Justice Institute and George Mason University (2016)  ↩

  2. Throughout this briefing, I use various terms to refer to different racial and ethnic groups. Where there are inconsistencies, it is because I have attempted to use the same terms as the original source, and these terms vary in the literature. For example, the Bureau of Justice Statistics and the U.S. Census use the term “Hispanic,” and when referencing their data, I use that term instead of the more inclusive “Latinx” that I use elsewhere. I also use the phrase “Black and brown people” to refer Black and any other people of color, rather than using the blanket “people of color” which can unhelpfully obscure the unique experiences of Black people in the U.S., especially in relation to the criminal justice system.  ↩

  3. There are several decision points within the pretrial process that are discretionary, and therefore subject to racial bias. The studies I reviewed examined outcomes at several of these stages: (1) the initial release decision; (2) the decision to set financial or non-financial conditions of release; and (3) when financial conditions are set, the bail bond amount. And because racial bias can affect each of these stages, several studies have looked at each stage separately in addition to measuring the cumulative effect of race on the ultimate outcome: whether or not the defendant is detained in jail pretrial. See the Appendix for details.  ↩


13 states in the hottest parts of the country lack universal A/C in their prisons. We explain the consequences.

by Alexi Jones, June 18, 2019

Air conditioning has become nearly universal across the South over the last 30 years, with one exception: in prisons. Although 95% of households in the South use air conditioning, including 90% of households that make below $20,000 per year,1 states around the South have refused to install air conditioning in their prisons, creating unbearable and dangerous conditions for incarcerated people.

13 famously hot states lack universal A/C in their prisons

While there are no national statistics on air conditioning in prison, we found that at least 13 states in the hottest regions of the country lack universal air conditioning in their prisons:

  • Alabama
  • Arizona
  • Florida
  • Georgia
  • Kansas
  • Kentucky
  • Louisiana
  • Mississippi
  • Missouri
  • North Carolina
  • South Carolina
  • Texas
  • Virginia

For more information on these states, see the appendix.

The lack of air conditioning in Southern prisons creates unsafe—even lethal—conditions. Prolonged exposure to extreme heat can cause dehydration and heat stroke, both of which can be fatal. It can also affect people’s kidneys, liver, heart, brain, and lungs, which can lead to renal failure, heart attack, and stroke.

Many people in prison are especially susceptible to heat-related illness, as they have certain health conditions or medications that make them especially vulnerable to the heat. Conditions such as diabetes and obesity can limit people’s ability to regulate their body heat, as can high blood pressure medications and most psychotropic medications (including Zoloft, Lexapro, Prozac, Cymbalta, and more but excluding the benzodiazepines). Old age also increases risk of heat-related illness, and respiratory and cardiovascular illnesses, such as asthma, are exacerbated by heat.

In Texas, a state that has air conditioning in all inmate housing areas in only 30 of its 109 prisons, a high percentage of incarcerated people are particularly vulnerable to heat:

A chart showing the percentage of people incarcerated in Texas with taking high blood pressure medication, psychiatric medication, asthma, and diabetes

The structure of prisons and prison life can also make incarcerated people more vulnerable to heat. Prisons are mostly built from heat-retaining materials which can increase internal prison temperatures. Because of this, the temperatures inside prisons can often exceed outdoor temperatures. Moreover, people in prison do not have the same cooling options that people on the outside do. As Prison Legal News explains in a 2018 article on prison air conditioning litigation, “people outside of prison who experience extreme heat have options that prisoners often lack – they can take a cool shower, drink cold water, move into the shade or go to a place that is air conditioned. For prisoners, those options are generally unavailable.” Even fans can even be inaccessible. For example, despite the fact that incarcerated people in Texas are not paid for their labor, purchasing a fan from the Texas prison commissary costs an unaffordable $20.

The lack of air conditioning in prisons has already had fatal consequences. In 2011, an exceptionally hot summer in Texas, 10 incarcerated people died from heat-related illnesses during a month-long heat wave. (It’s just not incarcerated people who get sick from the heat in the state’s prisons. In August 2018, 19 prison staff and incarcerated people had to be treated for heat-related illnesses.) As David Fathi, director of the American Civil Liberties Union National Prison Project, explained to The Intercept, “Everyone understands that if you leave a child in a car on a hot day, there’s a serious risk this child could be injured or die. And that’s exactly what we’re doing when we leave prisoners locked in cells when the heat and humidity climb beyond a certain level.”

Courts in Wisconsin, Arizona, and Mississippi have ruled that incarceration in extremely hot or cold temperatures violates the Eighth Amendment. But these court cases have not had a national impact on air conditioning in prisons. As Alice Speri of The Intercept explains, “There’s no national standard for temperatures in prisons and jails, and as jurisdiction over prisons is decentralized among states and the federal system, and jurisdiction over jails is even more fragmented among thousands of local authorities across the country, fights over excessive heat in detention can only be waged facility by facility.” As a result, incarcerated people in the South are subjected to unbearable conditions that violate their basic human and constitutional rights. Benny Hernandez, an incarcerated man in Texas, describes how torturous heat gets in prisons: “It routinely feels as if one’s sitting in a convection oven being slowly cooked alive. There is no respite from the agony that the heat in Texas prisons inflicts.”

Refusing to install air conditioning is a matter not just of short-term cost savings, but of appearing tough on crime. State and local governments go to astonishing lengths to avoid installing air conditioning in prisons. In 2016, Louisiana spent over $1 million in legal bills in an attempt to avoid installing air conditioning on death row, an amount four times higher than the actual cost of installing air conditioning, according to an expert witness. Similarly, in 2014, the people of Jefferson Parish, LA only voted to build a new jail after local leaders promised there would be no air conditioning.

With air conditioning nearly universal in the South, air conditioning should not be considered a privilege or amenity, but rather a human right. States and counties that deny air conditioning to incarcerated people should understand that, far from withholding a “luxury,” they are subjecting people to cruel and unusual punishments, and even handing out death sentences.

Footnotes

  1. The U.S. Energy Information Administration’s 2015 Residential Energy Consumption Survey has data on air conditioning use by income and geographical region. This Agency uses the Census Bureau’s definition of the South: Delaware, Maryland, Virginia, West Virginia, Kentucky, North Carolina, South Carolina, Tennessee, Georgia, Florida, Alabama, Mississippi, Arkansas, Louisiana, Texas, and Oklahoma plus Washington D.C. Nationwide, air conditioning usage is slightly lower than in just the South, with 87% of households (and 80% of people making below $20,000 per year) using air conditioning nationwide. .  ↩


Appendix

Examining local and national news stories, we identified 12 states in the South and Midwest that lack universal air conditioning and identified only Arkansas as having universal air conditioning.

State Air Conditioning?
Alabama Prisons in Alabama do not have air conditioning. (Source)
Arizona Many prisons in Arizona lack air conditioning. (Source)
Arkansas Prisons have had air conditioning since the 1970s. (Source)
Florida State run prisons do not have air conditioning, but private prisons in the state do have air conditioning. (Source)
Georgia Most prisons have air conditioning, but some do not. (Source)
Kansas Most prisons do not have air conditioning. 70 percent of incarcerated people are in buildings without air conditioning. (Source)
Kentucky Most prisons do not have air conditioning. (Source)
Louisiana Most prisons do not have air conditioning. (Source)
Mississippi Most inmate housing in Mississippi has no air conditioning. (Source)
Missouri Some prisons lack universal air conditioning. (Source)
North Carolina Most prisons have air conditioning, but 10 facilities do not. (Source)
South Carolina Most prisons have air conditioning, but some facilities do not. (Source)
Texas 30 of the 109 state prisons in Texas have air conditioning in all housing areas. (This is despite the fact county jails in the state are statutorily required keep their temperatures between 65 and 85 degrees). (Source)
Virginia Half of prisons have no air conditioning. (Source)


Stay Informed


Get the latest updates:


Share on 𝕏 Donate


Events

Not near you?
Invite us to your city, college or organization.