HELP US END MASS INCARCERATION The Prison Policy Initiative uses research, advocacy, and organizing to dismantle mass incarceration. We’ve been in this movement for 22 years, thanks to individual donors like you.

Can you help us sustain this work?

Thank you,
Peter Wagner, Executive Director
Donate

Press Releases archives

The report examines the unique challenges women in the criminal legal system face and provides the clearest look at how the pandemic impacted women's incarceration in the U.S.

March 1, 2023

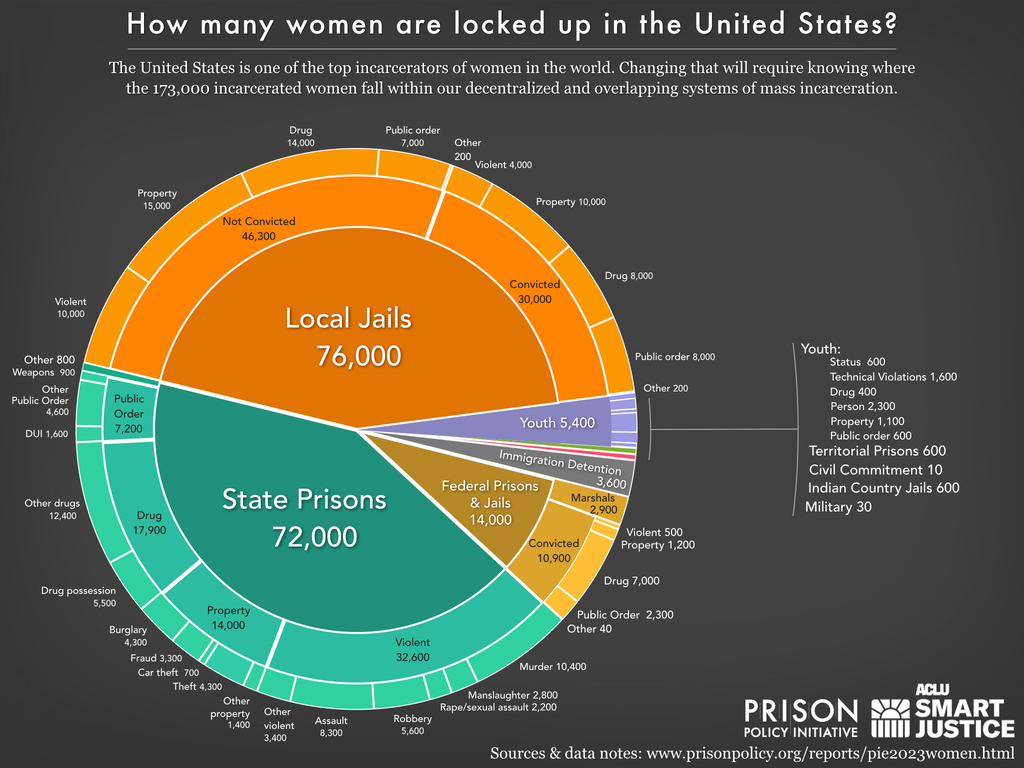
A report released today by the Prison Policy Initiative and the ACLU Campaign for Smart Justice presents the most recent and comprehensive data on how many women are locked up in the U.S., in what kinds of facilities, and why; as well as detailed data on incarcerated women’s demographic makeup and health.

Women in the U.S. experience a dramatically different criminal legal system than men do, but data on their experiences is difficult to find and put into context. The new edition of Women’s Mass Incarceration: The Whole Pie, which the Prison Policy Initiative and ACLU have published since 2017, fills this gap with richly-annotated data visualizations about women behind bars.

pie chart showing the number of women locked up on a given day in the United States by facility type and the underlying offense using the newest data available in 2023

The report reveals that the number of women behind bars fell significantly as a result of the COVID-19 pandemic, but is already rapidly returning to pre-pandemic levels. “The drop in women’s incarceration that we saw in 2020 was the kind of change needed to actually start ending the mass incarceration of women,” said report co-author Aleks Kajstura. “Unfortunately, because the changes during the first year of COVID-19 were due more to systemic slowdowns than policy changes, we’re already seeing the downward trend being reversed and more vulnerable women ending up in prison.”

The report highlights the importance of jails — an under-discussed part of the criminal legal system — to the story of women’s incarceration. Approximately the same number of women are locked up in jails as in state prisons. Jails are built for short stays, meaning that the disproportionate number of women locked up in jails (compared to incarcerated men) are stuck in facilities with worse healthcare and less programming.

Women’s Mass Incarceration: The Whole Pie 2023 also includes a section offering insights about the backgrounds and experiences of women in state prisons. Key takeaways include:

  • Significant numbers of women in prison end up there after being disadvantaged as children: 12% report homelessness before they turned 18; 19% were in foster care at some point; and 43% came from families that received welfare or other public assistance.
  • 53% of women were jobless in the month before the arrest that led to their incarceration, suggesting that unemployment is a major factor in leading women to interactions with the criminal legal system.
  • Most women in prison have physical/cognitive disabilities (50%) and/or mental illnesses (76%), showing the punitive approach state and local criminal legal systems have taken to people struggling with these serious health issues.
  • 58% of women in state prisons are parents to minor children, and of those, most are single mothers who were living with their children prior to imprisonment — making it likely that incarceration uprooted their children and led to the termination of their parental rights, permanently breaking up their families.

Finally, the report breaks down the racial demographics of women in prison and jail, details the number of women on probation and parole, and provides key statistics on the incarceration of girls in juvenile facilities.

“Too often, low-income women are punished by laws criminalizing poverty and caught in the wide net of Broken Windows policing that harms families and communities,” said Kajstura. “Both criminal justice reform and broader efforts to expand welfare and healthcare in this country will be necessary to end our nation’s tenure as the world’s leading incarcerator of women.

The new report is available here: https://www.prisonpolicy.org/reports/pie2023women.html


Report shows every community is harmed by mass incarceration

October 17, 2022

Today Western Native Voice and the Prison Policy Initiative released a new report, Where people in prison come from: The geography of mass incarceration in Montana, that provides an in-depth look at where people incarcerated in Montana state prisons come from. The report also provides 18 detailed data tables — including localized data for Yellowstone, Gallatin, and Butte-Silver Bow Counties, as well as Billings, Missoula, and Great Falls — that serve as a foundation for advocates, organizers, policymakers, data journalists, academics and others to analyze how incarceration relates to other factors of community well-being.

The data and report are made possible by the state Redistricting and Apportionment Commission’s decision to count people in prison as residents of their hometown rather than in prison cells when redistricting. Not everyone in state prison should or could be reallocated to their home address. The report and data reflect the individuals that could successfully be reallocated. The decision to change how incarcerated people are counted was made on a unanimous, bipartisan basis.

The report shows:

  • Nearly every county is missing a portion of its population to incarceration in state prison.
  • While Yellowstone County sends the most people to prison, the much smaller Silver Bow and Custer counties send people to prison at the highest rates in the state.
  • There are dramatic differences in incarceration rates within communities. For example, in Billings, residents of the South Side neighborhood are 15 times more likely to be imprisoned than residents of nearby Highlands neighborhood.

Data tables included in the report provide residence information for people in Montana state prisons at the time of the 2020 Census, offering the clearest look ever at which communities are most impacted by mass incarceration. They break down the number of people locked up by county, city, town, zip code, legislative district, census tract and other areas.

The data show the cities with the highest state prison incarceration rates are Hobson (556 per 100,000 residents), East Helena (410 per 100,000 residents) and Walkerville (312 per 100,000 residents). For comparison, the state imprisonment rate is 123 people in state prison per 100,000 residents.

Map of Montana incarceration rates by census tract

“The nation’s 40-year failed experiment with mass incarceration harms each and every one of us. This analysis shows that while some communities are disproportionately impacted by this failed policy, nobody escapes the damage it causes,” said Emily Widra, Senior Research Analyst at the Prison Policy Initiative. “Our report is just the beginning. We’re making this data available so others can further examine how geographic incarceration trends correlate with other problems communities face.”

The report cites studies that show that incarceration rates correlate with a variety of negative outcomes, including higher rates of asthma, depression, lower standardized test scores, reduced life expectancy and more. The data included in this report gives researchers the tools they need to better understand how these correlations play out in Montana.

“This report and data make clear that the pain of mass incarceration is not felt equally across the state. Native communities and low-income neighborhoods bear an undue burden of these failed policies,” said Ta’jin Perez, of Western Native Voice and co-author of the report. “More importantly, though, this should guide state and local policymakers as they make investments in education, housing, health care and economic opportunities that will strengthen families and communities.”

The report is part of a series of reports examining the geography of mass incarceration in America.

Montana is one of more than a dozen states and 200 local governments that have addressed the practice of “prison gerrymandering”, which gives disproportional political clout to state and local districts that contain prisons at the expense of all of the other areas of the state. In total, roughly half the country now lives in a place that has taken action to address prison gerrymandering.


Report shows every community is harmed by mass incarceration

October 5, 2022

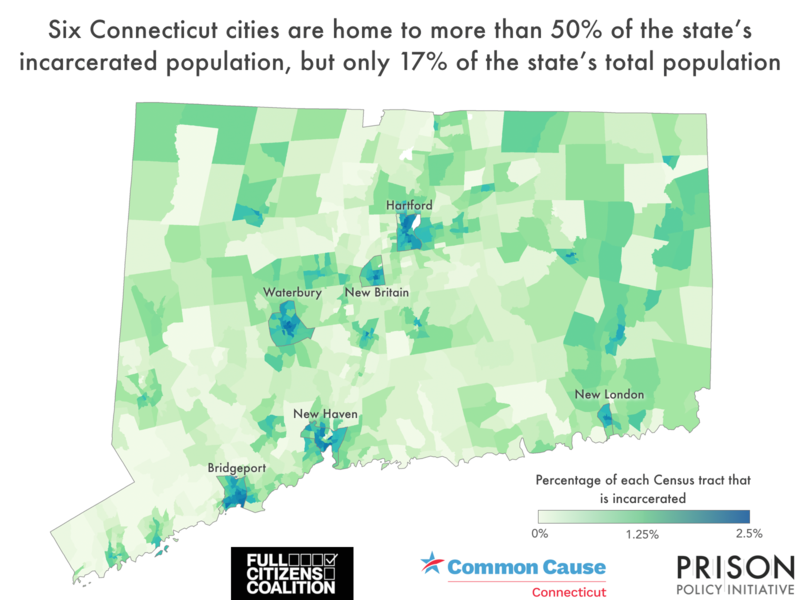
Today, Full Citizens Coalition, Common Cause in Connecticut, and the Prison Policy Initiative released a new report, Where people in prison come from: The geography of mass incarceration in Connecticut, that provides an in-depth look at where people incarcerated in Connecticut state prisons come from. The report also provides eleven detailed data tables — including neighborhood-specific data for Bridgeport, Hartford, Stamford, and Waterbury — that serve as a foundation for advocates, organizers, policymakers, data journalists, academics and others to analyze how incarceration relates to other factors of community well-being.

The data and report are made possible by the state’s historic 2021 law that requires that people in prison be counted as residents of their hometown rather than in prison cells when state and local governments redistrict every ten years.

The report shows:

  • Almost every single city — and every state legislative district — is missing a portion of its population to incarceration in state prison.
  • New Haven County, the third largest county in the state by population, sends the most people to prison and has the highest incarceration rate of all of the counties in the state.
  • There are dramatic differences in incarceration rates within communities. For example, in Hartford, a city that is one of the starkest examples of redlining in the country, residents of the Upper Albany neighborhood are four times as likely to be imprisoned than residents of the nearby West End neighborhood.

Data tables included in the report provide residence information for people in Connecticut state prisons at the time of the 2020 Census, offering the clearest look ever at which communities are most impacted by mass incarceration. They break down the number of people locked up by county, city, town, zip code, legislative district, census tract and other areas.

The data show the cities with the highest state prison incarceration rates are Hartford (1,065 per 100,000 residents), Waterbury (931 per 100,000 residents) and Bridgeport (903 per 100,000 residents). For comparison, Shelton has the lowest prison incarceration rate of any city, at 102 people in state prison per 100,000 residents. The statewide incarceration rate is 288 per 100,000 residents.

Map of incarceration rates in CT by census tract

“The nation’s 40-year failed experiment with mass incarceration harms each and every one of us. This analysis shows that while some communities are disproportionately impacted by this failed policy, nobody escapes the damage it causes,” said Emily Widra, Senior Research Analyst at the Prison Policy Initiative. “Our report is just the beginning. We’re making this data available so others can further examine how geographic incarceration trends correlate with other problems communities face.”

“This data and report put a spotlight on the deep and enduring wounds caused by mass incarceration in Connecticut,” said James Jeter of The Full Citizens Coalition. “As Connecticut looks to turn the page on the era of mass incarceration, it should make direct investments into the people, housing, education, and economic opportunities in those communities that have experienced the most pain.”

The report cites studies that show that incarceration rates correlate with a variety of negative outcomes, including higher rates of asthma, depression, lower standardized test scores, reduced life expectancy and more. The data included in this report gives researchers the tools they need to better understand how these correlations play out in Connecticut.

“Every person locked behind bars in Connecticut represents a piece of the fabric of a community that is missing,” said Keshia Morris Desir, of Common Cause. “This report and its data help to show the deep damage that is done to communities large and small by mass incarceration, and more importantly, provides guidance on where and how resources and support should be allocated to end this devastation.”

The report is part of a series of reports examining the geography of mass incarceration in America.

Connecticut is one of more than a dozen states and 200 local governments that have addressed the practice of “prison gerrymandering,” which gives disproportional political clout to state and local districts that contain prisons at the expense of all of the other areas of the state. In total, roughly half the country now lives in a place that has taken action to address prison gerrymandering.


On top of a bail system that is set up to favor companies over courts, the bail industry has lobbied for several loopholes that make their business virtually risk-free - and highly lucrative.

October 4, 2022

Easthampton, Mass. This morning, the Prison Policy Initiative published All Profit, No Risk: How the bail industry exploits the legal system, a report exposing how commercial bail companies and their deep-pocketed insurance underwriters almost always avoid accountability when they fail to do their one job: ensure their clients’ appearance in court. The report shows that the espoused purpose of the bail industry — that “it provides a public service at no cost to the taxpayer” — is a lie.

Piecing together evidence from 28 states where bail companies have routinely avoided paying bonds “forfeited” to courts due to their clients’ non-appearance, the report shows that these incidents are not isolated local scandals. Instead, they are part of a systematic problem with commercial money bail, a problem that has been intentionally created by the industry to protect its profits.

The report explains how the bail industry exploits — and works to expand — six loopholes in the system that allow it to avoid paying up when defendants don’t appear in court. For example, bail companies have carved out months-long “grace periods” during which they do not have to pay a forfeiture as long as their client returns to court during that time. These loopholes, combined with aggressive strategies employed by the industry, have helped it reap profits while taking little risk.

These “cracks” exist on top of a bail system that is already set up to favor companies over courts (and defendants) in several ways:

  • Bail companies do not pay any actual cash or property to the court up front, meaning that the onus is on the court to get the money it is owed if a defendant does not appear.
  • The bail system allows companies to select clients based on financial risk (i.e., their ability to cover the entire cost of their bail bond) rather than their risk of flight.
  • Companies can pass along their financial risk to defendants and their loved ones by collecting collateral.
  • Bail companies are backed by deep-pocketed insurance agencies that can (and do) aggressively fight forfeitures in court.

Rather than attempting to “fix” the money bail system, the Prison Policy Initiative calls for the end of the money bail system entirely (a system that has already received due criticism for penalizing people based on their personal financial resources). The organization notes that unwinding the deeply-ingrained loopholes carved out by the industry one by one is not realistic due to the powerful political influence of bail companies.

“The money bail system is dysfunctional and broken by design, and the bail bond industry helped make it that way,” said report author Wendy Sawyer. “Governments should replace money bail with non-commercial systems that ensure court appearance while removing the profit motive.”

The report also highlights three strategies state and local governments can adopt, short of ending money bail entirely, to reign in this industry:

  • Release most defendants pretrial without monetary conditions, and adopt services that support attendance;
  • When monetary conditions are necessary, rely on other forms of money bail that don’t involve profit motives, such as unsecured bonds; and
  • When commercial bonds are used, require bond agents to operate in cash to ensure they have a financial stake in the outcome.

The Prison Policy Initiative’s new report also includes a detailed description of the bail forfeiture process, an appendix of relevant legal statutes for all 50 states, and an appendix of evidence the organization gathered from 28 states.

The full report is available at https://www.prisonpolicy.org/reports/bail.html.


Report shows every community is harmed by mass incarceration

September 28, 2022

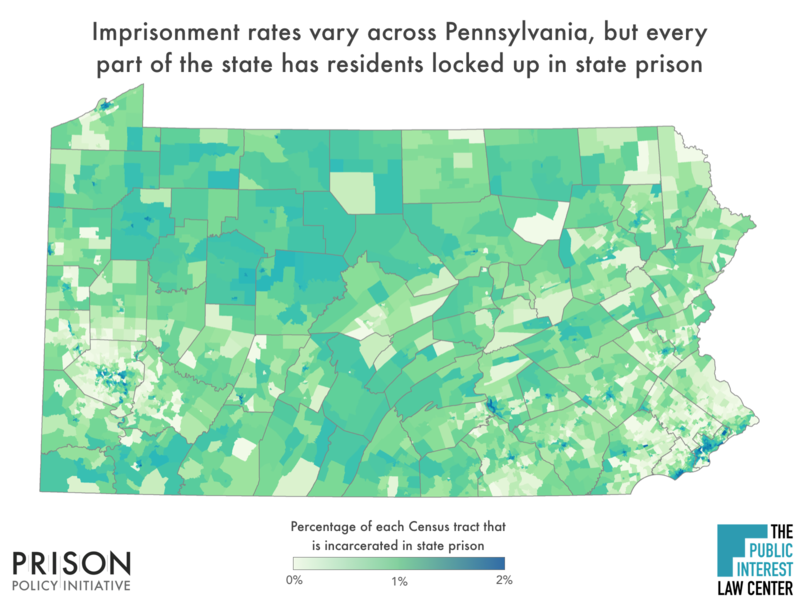
Today the Public Interest Law Center and the Prison Policy Initiative released a new report, Where people in prison come from: The geography of mass incarceration in Pennsylvania, that provides an in-depth look at where people incarcerated in Pennsylvania state prisons come from. The report also provides 10 detailed data tables — including neighborhood-specific data for Philadelphia, Pittsburgh, and Allentown — that serve as a foundation for advocates, organizers, policymakers, data journalists, academics, and others to analyze how incarceration relates to other factors of community well-being.

The data and report are made possible by the 2021 Legislative Reapportionment Commission’s decision to address the practice of prison gerrymandering. Pennsylvania was the first state to address this problem through its redistricting commission. With this change, the Commonwealth — for the first time ever — counted most incarcerated people at their homes instead of in prison cells when drawing new legislative district lines.

The report shows:

  • Every single county — and every state legislative district — is missing a portion of its population to incarceration in state prison.
  • While Philadelphia County sends the most people to prison, the much smaller Venango County has the highest imprisonment rate of any county, at 452 per 100,000 residents.
  • There are dramatic differences in imprisonment rates within communities. For example, in Philadelphia, one of the most racially segregated cities in the nation, residents of the Nicetown neighborhood are more than fifty times as likely to be imprisoned than residents of the Center City-West neighborhood.

Data tables included in the report provide residence information for people in Pennsylvania state prisons at the time of the 2020 Census, offering the clearest look ever at which communities are most impacted by mass incarceration. They break down the number of people locked up by county, city, town, zip code, legislative district, census tract, and other areas.

The data show the cities with the highest state prison imprisonment rates are Chester (1,191 per 100,000 residents), Harrisburg (1,144 per 100,000 residents) and Uniontown (972 per 100,000 residents). For comparison, Bethel Park has the lowest imprisonment rate, at 21 people in state prison per 100,000 residents. Philadelphia and Pittsburgh have imprisonment rates of 463 per 100,000 residents and 276 per 100,000 residents, respectively.

Map of incarceration by census tract in Pennsylvania

“The nation’s 40-year failed experiment with mass incarceration harms each and every one of us. This analysis shows that while some communities are disproportionately impacted by this failed policy, nobody escapes the damage it causes,” said Emily Widra, Senior Research Analyst at the Prison Policy Initiative. “Our report is just the beginning. We’re making this data available so others can further examine how geographic incarceration trends correlate with other problems communities face.”

The report cites studies that show that incarceration rates correlate with a variety of negative outcomes, including higher rates of asthma, depression, lower standardized test scores, reduced life expectancy, and more. The data included in this report gives researchers the tools they need to better understand how these correlations play out in Pennsylvania.

“Mass incarceration hurts every community in Pennsylvania, but hurts some communities more than others,” said Benjamin Geffen of the Public Interest Law Center and co-author of the report. “As state and local leaders rethink our approaches to criminal justice, they should use data about who is in state prisons to target investments in jobs, housing, education, and healthcare that will strengthen families and communities.”

The report is part of a series of reports examining the geography of mass incarceration in America.

Pennsylvania is one of more than a dozen states and 200 local governments that have addressed the practice of “prison gerrymandering,” which gives disproportional political clout to state and local districts that contain prisons at the expense of all of the other areas of the state. In total, roughly half the country now lives in a place that has taken action to address prison gerrymandering.


Report shows every community is harmed by mass incarceration

September 15, 2022

Today the Prison Policy Initiative, along with Delaware advocates Kyra Hoffner and Jack Young released a new report, Where people in prison come from: The geography of mass incarceration in Delaware, that provides an in-depth look at where people incarcerated in Delaware state prisons come from. The report also provides six detailed data tables that serve as a foundation for advocates, organizers, policymakers, data journalists, academics and others to analyze how incarceration relates to other factors of community well-being.

The data and report are made possible by the state’s landmark 2010 law that requires that people in state prisons be counted as residents of their hometown rather than in cells when state and local governments redistrict every ten years.

The report shows:

  • All three counties — and every state legislative district — are missing a portion of their population to incarceration in state prison.
  • Wilmington has the dubious distinction of having both the highest number of city residents incarcerated as well as the highest incarceration rate of any city in the state.
  • Mass incarceration is not just a problem impacting large cities. Many smaller towns are also hit hard. Laurel, for example, has an incarceration rate of 1,227 per 100,000 residents, while Blades has a rate of 924 per 100,000 residents.

Data tables included in the report provide residence information for people in Delaware state prisons at the time of the 2020 Census, offering the clearest look ever at which communities are most impacted by mass incarceration. They break down the number of people locked up by county, city, zip code, legislative district, and census tract.

The data show the cities with the highest incarceration rates are Wilmington (1,299 per 100,000 residents), Seaford (748 per 100,000 residents) and Dover (680 per 100,000 residents). For comparison, Newark has the lowest incarceration rate of any city, at 131 per 100,000 residents, nearly ten times lower than Wilmington, and nearly three times lower than the state rate of 380 per 100,000 residents.

Map showing incarceration rates by census tract in Delaware

“The nation’s 40-year failed experiment with mass incarceration harms each and every one of us. This analysis shows that while some communities are disproportionately impacted by this failed policy, nobody escapes the damage it causes,” said Emily Widra, Senior Research Analyst at the Prison Policy Initiative and co-author of the report. “Our report is just the beginning. We’re making this data available so others can further examine how geographic incarceration trends correlate with other problems communities face.”

The report cites studies that show that incarceration rates correlate with a variety of negative outcomes, including higher rates of asthma, depression, lower standardized test scores, reduced life expectancy and more. The data included in this report gives researchers the tools they need to better understand how these correlations play out in Delaware.

“This report provides the most precise picture ever of which communities are most impacted, and just as importantly, it shows where support and resources should be deployed to repair that harm,” said Kyra Hoffner, co-author of the report.

“Every person locked behind bars in Delaware represents a piece of the fabric of a community that is missing,” said Jack Young, co-author of the report. “This report and data provide critical guidance on where and how resources and support should be allocated.”

The report is part of a series of reports examining the geography of mass incarceration in America.

Delaware is one of more than a dozen states and 200 local governments that have addressed the practice of “prison gerrymandering,” which gives disproportional political clout to state and local districts that contain prisons at the expense of all of the other areas of the state. In total, roughly half the country now lives in a place that has taken action to address prison gerrymandering.


Report shows every community in California is harmed by mass incarceration

August 31, 2022

Today the Essie Justice Group and the Prison Policy Initiative released a new report, Where people in prison come from: The geography of mass incarceration in California, that provides an in-depth look at where people incarcerated in California state prisons come from. The report also provides 20 detailed data tables — including localized data for Los Angeles, San Diego, San Jose, San Francisco, Fresno and Santa Clara County — that serve as a foundation for advocates, organizers, policymakers, data journalists, academics and others to analyze how incarceration relates to other factors of community well-being.

The data and report are made possible by the state’s landmark 2011 law that requires that people in prison be counted as residents of their hometown rather than in prison cells when state and local governments redistrict every ten years.

The report shows:

  • Every single county — and every state legislative district — is missing a portion of its population to incarceration in state prison.
  • While no county sends as many people to prison as Los Angeles County, many of the state’s smaller counties, including Kings, Shasta, Tehama, and Yuba, have a far larger portion of their residents imprisoned.
  • Native reservation and trust land in California has an imprisonment rate of 534 per 100,000 people, nearly double the state average of 310 per 100,000.
  • There are dramatic differences in incarceration rates within communities, often along racial and economic lines. For example, in Los Angeles the 14 neighborhoods with the highest imprisonment rates are clustered in South Central Los Angeles, where 57% of residents are Latino, 38% are Black, and 2% are white. Meanwhile, the LA neighborhoods with the lowest imprisonment rates are mostly in the predominately white and wealthier Westside region.
  • The large number of adults extracted from a relatively small number of geographical areas seriously impacts the health and stability of the families and communities left behind. It specifically impacts women and gender non-conforming people, where 1 in 4 women and 1 in 2 Black women have an incarcerated loved one.

Data tables included in the report provide residence information for people in California state prisons at the time of the 2020 Census, offering the clearest look ever at which communities are most impacted by mass incarceration. They break down the number of people locked up by county, city, town, zip code, legislative district, census tract and other areas.

The data show the counties with the highest state prison incarceration rates are Kings (666 per 100,000 residents), Shasta (663 per 100,000 residents) and Tehama (556 per 100,000 residents). For comparison, Marin County has the lowest prison incarceration rate, at 80 people in state prison per 100,000 residents, more than 8 times lower than Kings County.

Map showing incarceration rates by census tract in California

“The nation’s 40-year failed experiment with mass incarceration harms each and every one of us. This analysis shows that while some communities are disproportionately impacted by this failed policy, nobody escapes the damage it causes,” said Emily Widra, Senior Research Analyst at the Prison Policy Initiative. “Our report is just the beginning. We’re making this data available so others can further examine how geographic incarceration trends correlate with other problems communities face.”

The report cites studies that show that incarceration rates correlate with a variety of negative outcomes, including higher rates of asthma, depression, lower standardized test scores, reduced life expectancy and more. The data included in this report gives researchers the tools they need to better understand how these correlations play out in California.

“When someone is incarcerated, families and communities are destabilized and women-especially Black women, bear the burdens of mass incarceration through financial devastation and profound health implications. This report provides the most cutting-edge data we have to date to help us better understand how specific regions of the state are experiencing incarceration,” said Felicia Gomez, Senior Policy Associate at Essie Justice Group. “We now have an additional layer of analysis, that connected to the lived experiences of women with incarcerated loved ones, sheds light on which regions in California are sending the most people to prison and how that is impacting communities and their constituents. And just as importantly, it uplifts the urgent need for the state to close more prisons and make full investments into care and community safety.”

The report is part of a series of reports examining the geography of mass incarceration in America.

California is one of more than a dozen states and 200 local governments that have addressed the practice of “prison gerrymandering,” which gives disproportional political clout to state and local districts that contain prisons at the expense of all of the other areas of the state. In total, roughly half the country now lives in a place that has taken action to address prison gerrymandering.


Report shows communities in all corners of the state are harmed by mass incarceration

August 9, 2022

Today Silver State Voices, the ACLU of Nevada, and the Prison Policy Initiative released a new report, Where people in prison come from: The geography of mass incarceration in Nevada, that provides an in-depth look at where people incarcerated in Nevada state prisons come from. The report also provides fourteen detailed data tables — including data for city council wards in Las Vegas, North Las Vegas, Sparks, Henderson, and Reno, as well Native lands — that serve as a foundation for advocates, organizers, policymakers, journalists, academics and others to analyze how incarceration relates to other factors of community well-being.

The data and report are made possible by the state’s landmark 2019 law that requires that people in prison be counted as residents of their hometown rather than in prison cells when state and local governments redistrict every ten years.

The report shows:

  • Mass incarceration is a problem harming all corners of the state, with 99.9% of the state’s residents living in a county that is missing a portion of its population to imprisonment. Only Esmeralda County, with a population of 729 people, did not have any residents in state prison at the time the data was collected.
  • While Clark County sends the most people to prison — 5,957 for an imprisonment rate of 263 per 100,000 residents — the smaller Nye and White Pine Counties have significantly higher imprisonment rates; both are at 365 per 100,000 residents.
  • There are dramatic differences in incarceration rates within communities, often along racial and economic lines. For example, in Las Vegas, city council wards 3 and 5 have the highest imprisonment rates in the city, (553 per 100,000 residents and 685 per 100,000 residents, respectively) and highest poverty rates.
  • Some Native communities are hit particularly hard by mass incarceration, with South Fork Reservation, Ely Reservation, Carson Colony, and Battle Mountain Reservation reporting imprisonment rates that are more than four times higher than the state average.

Data tables included in the report provide residence information for people in Nevada state prisons at the time of the 2020 Census, offering the clearest look ever at which communities are most impacted by mass incarceration. They break down the number of people locked up by county, city, town, zip code, legislative district, census tract, and other areas.

The data show the cities with the highest state prison incarceration rates are Ely (482 per 100,000 residents), Las Vegas (330 per 100,000 residents) and Reno (316 per 100,000 residents). For comparison, Lovelock has the lowest imprisonment rate at 55 residents per 100,000 residents. The state imprisonment rate is 252 residents per 100,000 residents.

Map showing most people in Nevada state prisons are from Las Vegas, Reno, and North Las Vegas.

“The nation’s 40-year failed experiment with mass incarceration harms each and every one of us. This analysis shows that while some communities are disproportionately impacted by this failed policy, nobody escapes the damage it causes,” said Emily Widra, Senior Research Analyst at the Prison Policy Initiative. “Our report is just the beginning. We’re making this data available so others can further examine how geographic incarceration trends correlate with other problems communities face.”

The report cites studies that show that incarceration rates correlate with a variety of negative outcomes, including higher rates of asthma, depression, lower standardized test scores, reduced life expectancy and more. The data included in this report gives researchers the tools they need to better understand how these correlations play out in Nevada.

“The work of our Nevadans Count coalition during the census and redistricting process was the precursor to this report,” said Emily Persaud-Zamora, Executive Director at Silver State Voices. “Our report provides a more precise picture of the nexus of systemic oppression and mass incarceration. Compounded with the other health disparities in the report, it shows our communities have never been voiceless; they have been muted. Through our rights restoration work, Silver State Voices is committed to amplifying and sustaining the message that BIPOC communities and those impacted by the criminal legal system can reclaim their political power.”

“Through the dissemination of this report, we hope to continue to bring light to the pervasiveness of inequity within the criminal legal system,” said ACLU of Nevada Policy Manager Lilith Baran. “Mass incarceration continues to undermine our democracy and the impact is far and wide.”

The report is part of a series of reports examining the geography of mass incarceration in America.

Nevada is one of more than a dozen states and 200 local governments that have addressed the practice of “prison gerrymandering,” which gives disproportional political clout to state and local districts that contain prisons at the expense of all of the other areas of the state. In total, roughly half the country now lives in a place that has taken action to address prison gerrymandering.


Report shows every community is harmed by mass incarceration

August 3, 2022

Today, More Equitable Democracy and the Prison Policy Initiative released a new report, Where people in prison come from: The geography of mass incarceration in Washington, that provides an in-depth look at where people incarcerated in Washington state prisons come from. The report also provides eleven detailed data tables — including neighborhood-specific data for Seattle, Vancouver, Tacoma and Spokane — that serve as a foundation for advocates, organizers, policymakers, data journalists, academics and others to analyze how incarceration relates to other factors of community well-being.

The data and report are made possible by the state’s landmark 2019 law that requires that people in prison be counted as residents of their hometown rather than in prison cells when state and local governments redistrict every ten years.

The report shows:

  • Every single county — and every state legislative district — is missing a portion of its population to incarceration in state prison.
  • Many of the state’s smaller and midsized counties, including Grays Harbor, Cowlitz, Lewis, Yakima, and Asotin have some of the highest incarceration rates in the state, making clear that the notion that mass incarceration is a problem just impacting large urban areas is a myth.
  • There are dramatic differences in incarceration rates within communities. For example, in Spokane, residents of the West Central neighborhood are more than forty times as likely to be imprisoned than residents of nearby Balboa-South Indian Trail.
  • Some Native communities are hit particularly hard by mass incarceration, with Skokomish, and Squaxin Island Reservations reporting imprisonment rates over 1,000 per 100,000 residents, more than five times the state average.

Data tables included in the report provide residence information for people in Washington state prisons at the time of the 2020 Census, offering the clearest look ever at which communities are most impacted by mass incarceration. They break down the number of people locked up by county, city, town, zip code, legislative district, census tract and other areas.

The data show that while King County has the most imprisoned residents (3,072), it has one of the lowest county imprisonment rates in the state, with 135 imprisoned people per 100,000 residents. On the other hand, Grays Harbor County has the highest county rate in the state, with 470 people imprisoned per 100,000 residents. For context, the statewide imprisonment rate for Washington is 197 per 100,000 residents.

Map of incarceration rates by census tract.

“The nation’s 40-year failed experiment with mass incarceration harms each and every one of us. This analysis shows that while some communities are disproportionately impacted by this failed policy, nobody escapes the damage it causes,” said Emily Widra, Senior Research Analyst at the Prison Policy Initiative. “Our report is just the beginning. We’re making this data available so others can further examine how geographic incarceration trends correlate with other problems communities face.”

The report cites studies that show that incarceration rates correlate with a variety of negative outcomes, including higher rates of asthma, depression, lower standardized test scores, reduced life expectancy and more. The data included in this report gives researchers the tools they need to better understand how these correlations play out in Washington.

“Mass incarceration harms each of us, but it doesn’t harm each of us equally. We’ve known for too long that poorer communities and communities of color are over-policed, over-incarcerated, and under-resourced,” said Colin Cole of More Equitable Democracy. “This data is a tool to help policymakers, advocates, and service providers address the damage that has been done and build stronger, healthier, and more secure communities.”

The report is part of a series of reports examining the geography of mass incarceration in America.

Washington is one of more than a dozen states and 200 local governments that have addressed the practice of “prison gerrymandering,” which gives disproportional political clout to state and local districts that contain prisons at the expense of all of the other areas of the state. In total, roughly half the country now lives in a place that has taken action to address prison gerrymandering.


Report shows every community is harmed by mass incarceration

July 14, 2022

Today the New Virginia Majority and the Prison Policy Initiative released a new report, Where people in prison come from: The geography of mass incarceration in Virginia, that provides an in-depth look at where people incarcerated in Virginia state prisons and local jails come from. The report also provides ten detailed data tables — including neighborhood-specific data for Arlington, Norfolk and Richmond — that serve as a foundation for advocates, organizers, policymakers, data journalists, academics and others to analyze how incarceration relates to other factors of community well-being.

The data and report are made possible by the state’s landmark 2020 law that requires that people in prison and jail be counted as residents of their hometown rather than in prison cells when state and local governments redistrict every ten years.

The report shows:

  • Every single county — and every state legislative district — is missing a portion of its population to incarceration.
  • Many of the state’s least populous counties, including Buchanan, Brunswick, Lee, and Dickinson, have among the highest incarceration rates.
  • There are dramatic differences in incarceration rates within communities. For example, more than half of the people in prison or jail from Richmond come from just 22 of the city’s more than 140 neighborhoods. These neighborhoods have historically been victims of dramatic “redlining”.

Data tables included in the report provide residence information for people in Virginia state prisons and jails at the time of the 2020 Census, offering the clearest look ever at which communities are most impacted by mass incarceration. They break down the number of people locked up by county, city, town, zip code, legislative district, census tract and other areas.

The data show the counties with the highest state prison and local jail incarceration rates are Buchanan (1,246 per 100,000 residents), Brunswick (1,167 per 100,000 residents), Lee (1,155 per 100,000 residents), Dickenson (1,132 per 100,000 residents), and Tazewell (1,105 per 100,000 residents); more than 1% of the residents of each of these counties is behind bars. For comparison, Arlington County has the lowest prison incarceration rate, at 70 people in state prison per 100,000 residents.

Map of incarceration in Colorado census tracts

“The nation’s 40-year failed experiment with mass incarceration harms each and every one of us. This analysis shows that while some communities are disproportionately impacted by this failed policy, nobody escapes the damage it causes,” said Emily Widra, Senior Research Analyst at the Prison Policy Initiative. “Our report is just the beginning. We’re making this data available so others can further examine how geographic incarceration trends correlate with other problems communities face.”

The report cites studies that show that incarceration rates correlate with a variety of negative outcomes, including higher rates of asthma, depression, lower standardized test scores, reduced life expectancy and more. The data included in this report gives researchers the tools they need to better understand how these correlations play out in Virginia.

“The damage caused by redlining in Richmond and throughout Virginia continues to reverberate to this very day,” said Kenneth Gilliam of the New Virginia Majority. “Considerable work remains to address the inequities that result in people of color disproportionately being locked behind bars. This report and data, though, offer a roadmap for where and how these investments should be made.”

The report is part of a series of reports examining the geography of mass incarceration in America.

Virginia is one of more than a dozen states and 200 local governments that have addressed the practice of “prison gerrymandering,” which gives disproportional political clout to state and local districts that contain prisons at the expense of all other districts. In total, roughly half the country now lives in a place that has taken action to address prison gerrymandering.


Stay Informed


Get the latest updates:


Share on 𝕏 Donate