Getting Back on Course:
Educational exclusion and attainment among formerly incarcerated people
By Lucius Couloute
October 2018
Press release
Throughout their lives, people who serve time in prison are held back from educational opportunities, making it nearly impossible to earn the credentials they need to succeed after release. Using data from the National Former Prisoner Survey, this report reveals that formerly incarcerated people are often relegated to the lowest rungs of the educational ladder; more than half hold only a high school diploma or GED, and a quarter hold no credential at all. While incarcerated, and even after release from prison, we find that people rarely get the chance to make up for the educational opportunities from which they’ve been excluded — opportunities that impact their chances of reentry success.
Education is especially critical for people seeking employment after release from prison. Building on our previous research, which revealed a staggering 27% unemployment rate among formerly incarcerated people, we find that those with low levels of formal education face even higher unemployment rates. In particular, formerly incarcerated people without a high school credential report extreme unemployment rates, and the outlook is particularly bleak for people of color. These alarming results call for immediate transformations of our educational and criminal justice systems. To that end, we conclude with a series of fundamental policy recommendations necessary to reduce current inequalities faced by criminalized people across the United States.
Overview: Educational attainment of formerly incarcerated people
Most broadly, we find that inequalities between the general public and formerly incarcerated people begin early and accumulate at each level of education:
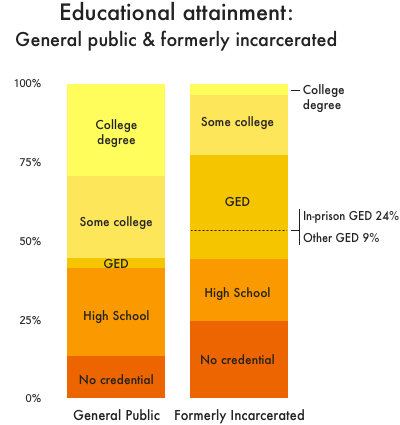
Figure 1. Comparing the highest level of educational attainment for formerly incarcerated people (age 25+) to the general public (age 25+). See the appendix for the data.
- Formerly incarcerated people are nearly twice as likely to have no high school credential at all.1
- More than half of formerly incarcerated people hold only a high school diploma or GED — credentials which have diminishing value in today’s job market.
- Unlike the general public, people who have been to prison are more likely to have GEDs than they are to have traditional high school diplomas.2 And three-quarters of those GED certificates are earned in prison.
- Formerly incarcerated people are 8 times less likely to complete college than the general public.
The school-to-prison pipeline
Before going to prison, many formerly incarcerated people are subject to punitive practices in schools and neighborhoods that funnel them out of school and into juvenile and criminal justice system involvement;3 this process has been characterized as a “school-to-prison pipeline.” But the problem doesn’t end there. As our analysis shows, their educational exclusion persists during and after incarceration.
We find that a quarter of formerly incarcerated people do not have a basic high school diploma or GED. And at least an additional third (33%) obtain GEDs as their highest level of education in lieu of traditional diplomas.4 Together, these two groups make up the 58% of all formerly incarcerated people whose traditional high school educations were cut short.
Of course, an interruption in high school education does not necessarily lead to incarceration, and conversely, many incarcerated people have graduated from high school. But such a low rate of high school completion among formerly incarcerated people adds to the body of evidence that overly punitive disciplinary policies and practices contribute to the criminalization — and ultimately, incarceration — of large numbers of youth.5
Excluding youth from a traditional high school education denies them not just an important credential, but also qualitatively different educational experiences,6 valuable networking opportunities,7 and career guidance.8 To achieve social and economic success, people who are incarcerated must find ways to make up for these lost experiences in prison or upon reentry. Unfortunately, as we’ll discuss, the U.S. fails to provide effective remedies for people who have been pushed out of traditional schooling and into prisons and jails.
The link between education and employment
At the same time that criminalized youth are pushed out of traditional schooling, high school (and increasingly college) credentials are becoming essential for employment. The last time 25% of adults in the U.S. did not have a high school credential was 1986,9 when low-skill jobs were still widely available. Decades later, 25% of formerly incarcerated people still don’t have high school credentials, and low-skill jobs have largely disappeared.
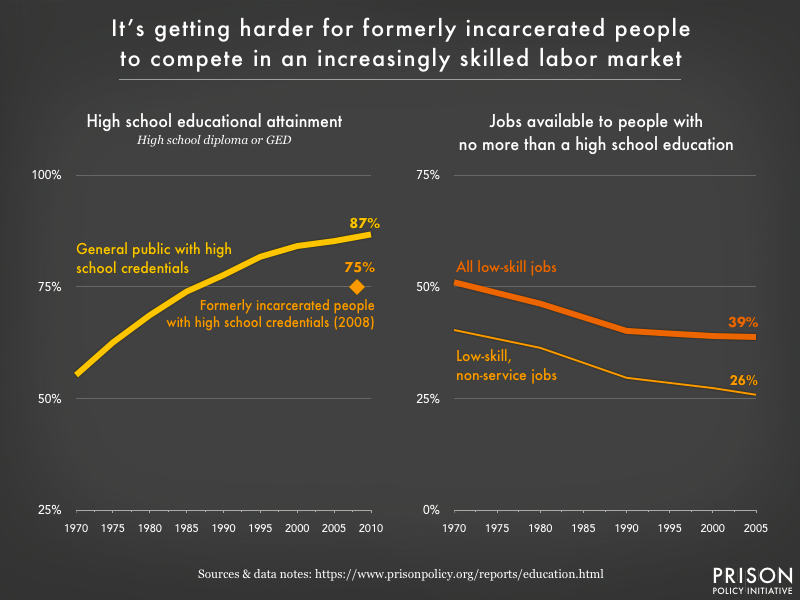 Figure 2. Since 1970, the share of U.S. residents (age 25+) who hold a high school diploma or GED has increased steadily (left, in yellow); by 2010, it well exceeded the rate of high school/GED attainment among formerly incarcerated people in 2008 (left, in orange). Meanwhile, the share of low-skill jobs in the U.S. labor market has declined (right, top line); these are the jobs available to most formerly incarcerated people who don’t hold a college degree.10
It is nearly impossible for formerly incarcerated job seekers to compete in an economy that increasingly demands highly skilled, credentialed workers.
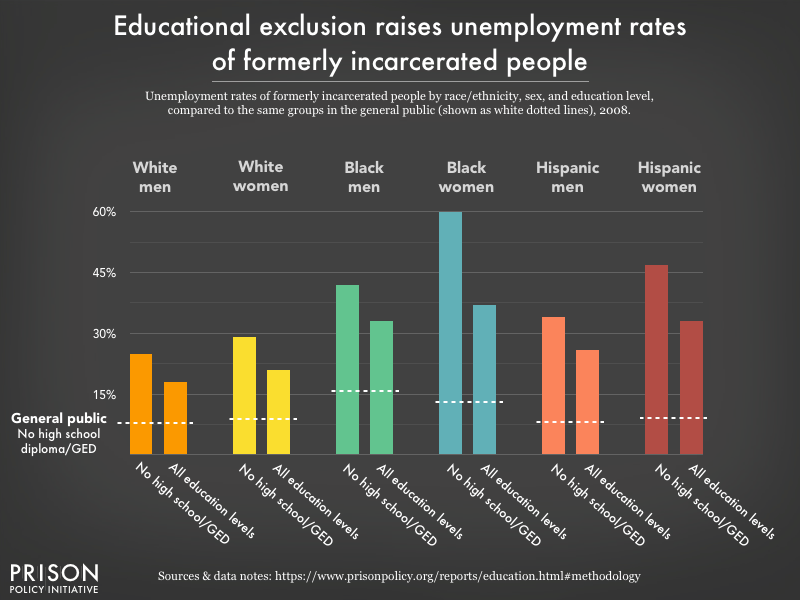 Figure 3. The combination of educational exclusion, history of incarceration, race, and gender contributes to much higher rates of unemployment for formerly incarcerated people of color (age 25+) without high school credentials. Women of color face the highest unemployment rates: 60% of Black women who don’t have a high school diploma or GED, and nearly half of Hispanic women, are unemployed. For the data, see the appendix.
Our analysis finds wide variation in employment outcomes by educational attainment, underscoring the importance of education for people seeking work after release. Previously, we found that the overall unemployment rate for formerly incarcerated people stands at a staggering 27% — higher than peak unemployment during the Great Depression.11 But unemployment among those without a high school credential is much worse, ranging from 25% among white men to 60% among Black women. These results indicate that the one-two punch of being criminalized and excluded from high school puts large numbers of people out of work.12
Can GED programs make up for lost educational opportunities?
For those who enter prison without a high school diploma, GED programs are frequently offered to help bridge the educational gap. Accordingly, we find that compared to the general public, formerly incarcerated people are much more likely to attain the high school credential through GED programs. Only 7-10% of the general public with a high school credential achieved that credential via a GED.13 In contrast, we find that over 60% of formerly incarcerated people whose highest level of education is a high school credential have a GED certificate rather than a traditional high school diploma.
But although a GED can be an important corrective for those who have been pushed out of traditional high schools, there are clear income differences in the general public between those who get GEDs and those who get traditional diplomas.14 On average, people with high school diplomas earn 33% more than those with GEDs:
| Educational attainment | Average monthly income |
|---|---|
| GED | $3,149 |
| High school diploma | $4,690 |
In terms of employment outcomes, a GED is undoubtedly better than no high school credential at all, but this difference in earnings demonstrates that a GED and a diploma may not provide the same economic rewards.
GEDs in prison
Prior research has identified some important benefits of in-prison GED programs, including higher post-prison earnings and reduced recidivism.15 But our analysis shows that GEDs earned in prison may not lead to the same opportunities as GEDs earned outside of prison.
Our analysis allows us to distinguish between formerly incarcerated people who received GEDs in prison and those who received them on the outside. We found that of the 33% of all formerly incarcerated people (age 25+) who hold GEDs as their highest degrees, the vast majority (73%) received them in prison. In total, we find that almost 27% of formerly incarcerated people attained a GED while incarcerated.
While data retrieval limitations made it impossible to analyze economic outcomes related to where people received GEDs, we found that GEDs earned in prison rarely provide pathways to further educational achievement:
| Formerly incarceratedwith GED earned in prison (age 18+) | General publicwith GED (age 18+) | |
|---|---|---|
| At least some college | 9.6% | 42.8% |
| College graduate | 0.7% | 4.8% |
For formerly incarcerated people, a GED earned in prison is almost never a stepping-stone to higher education. Of all formerly incarcerated people with in-prison GEDs, less than 10% go on to take any college coursework, and less than 1% attain college degrees. In contrast, nearly half of GED holders in the general public go on to complete at least some college. These results point to a vast system of barriers to entry into higher education (as we discuss below), including in-prison GED programs that, without supplemental educational experiences, are insufficient to prepare students for further education.17
College among formerly incarcerated people
Unsurprisingly, we also find large educational inequalities between the general public and formerly incarcerated people at the top of the educational ladder: college. For example, among people 25 and older, 55.4% of the general public in 2008 had taken at least one college course, but only 23% of formerly incarcerated people had done so.18
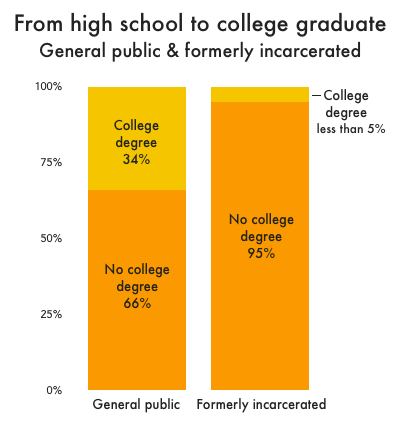
Figure 4. Percentage of people 25 or older with a high school diploma or GED who also attained a Bachelor’s degree or higher. For the data, see the appendix.
When it comes to completing college, the gap widens further: 29% of the U.S. population in 2008, compared to less than 4% of formerly incarcerated people, held a college degree.19 The difference is even more pronounced among those who hold a high school diploma or GED: While those in the general public have a 1 in 3 chance of attaining a college degree, a formerly incarcerated person’s chances are less than 1 in 20.
Although our data did not allow us to track whether people went to college before, during, or after incarceration, such low rates of postsecondary education among formerly incarcerated people suggests that people who have access to college rarely go to prison and criminalized people rarely have the opportunity to get a college degree.
Part of the problem is the limited number of in-prison college programs, which are available in only a fraction of the number of facilities that offered them 25 years ago. But even after release, formerly incarcerated people face barriers to enrolling in college programs. They continue to face punishment in the form of federal financial aid restrictions, discriminatory college admissions practices, and occupational licensing restrictions that can negate educational achievements. Some of the greatest barriers to accessing higher education while incarcerated or after release from prison include:
- In-prison college degree granting programs are still inaccessible for most incarcerated people. After federal grant eligibility was cut off through the 1994 crime bill, the number of in-prison college programs dropped to about 12 in 2005; today, the number of programs is still far short of the estimated 350 programs active in the early 1990s.20
- People incarcerated in state and federal prisons, with limited exceptions, are ineligible for federal Pell Grants and federal student loans. Students who have been convicted of a drug offense while previously receiving federal aid, or who have been involuntarily civilly committed for a sex offense, are ineligible for federal aid even after serving their sentences.21
- Many colleges and universities continue to include questions about criminal history on their applications. Research has shown that the inclusion of criminal history questions on college applications deters would-be students from even completing the application process, and that applicants face discrimination based on criminal history.22
- Even when incarcerated people learn skills relevant to further education or occupational licenses in prison, license restrictions based on criminal history can invalidate their training. For example, people who learn legal skills as jailhouse lawyers may be ineligible to practice law in at least 11 states.23
These barriers signal to formerly incarcerated people that they are unwelcome in institutions of higher learning, prevent their economic integration, and contribute to the revolving door of release and re-incarceration.
Differences in education by race, gender, and time since release
Race & gender
Our analysis uncovers how some racial and gender groups face larger educational disadvantages than others. In particular, 40% of formerly incarcerated Hispanic women over the age of 25 must navigate their communities with neither a high school diploma nor GED, but with the stigma of a criminal record instead.24 Again, nearly half of these women are unemployed.
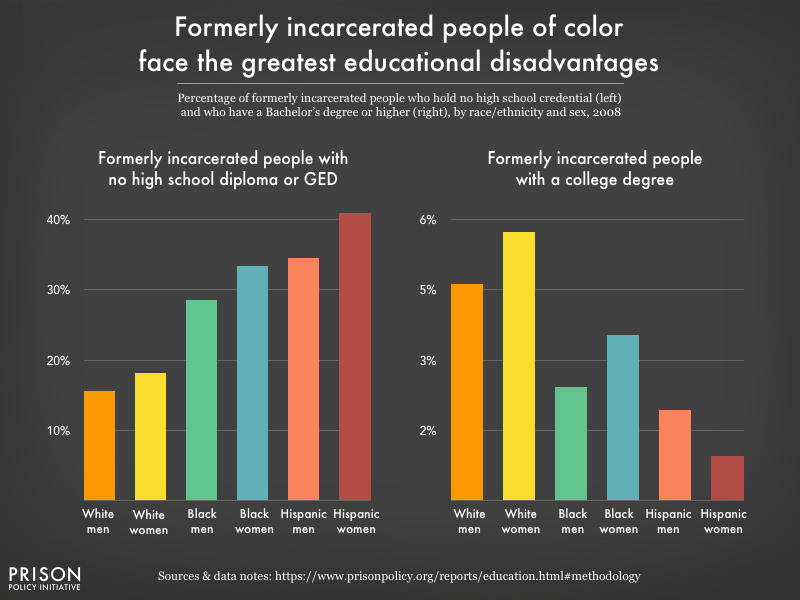 Figure 4. Formerly incarcerated Black and Hispanic people over age 25 are more likely to hold no high school credential upon release from prison (left), and less likely to hold a college degree (right), compared to formerly incarcerated white people.
Even more unsettling is the fact that no more than 6% of any demographic group surveyed had completed college. These outcomes mirror educational attainment rates in the general population from 40-50 years ago and undoubtedly contribute to labor market difficulties in an increasingly demanding economy.25
Time since release
Because our analysis focuses on formerly incarcerated people, we also considered the question of whether these educational disadvantages would eventually disappear — for example, as a result of comprehensive reentry programming. Unfortunately, it appears that even four or more years after release, the educational attainment of formerly incarcerated people still lags well behind that of the general public.
With the data, we were able to compare the educational attainment of people who had been recently released from prison (within a year of the survey) to those who had been back in the community for four years or more. Ideally, with robust reentry support, those who had been in the community for four years or more would have had the opportunity to advance their educations, and would report educational attainment much higher than people who were recently released. But the differences are underwhelming; we find that between the first year after release and four or more years after release:
- The share of people with high school credentials increases from 72% to 82%.
- The percentage of individuals who have experienced “some college” increases from 19% to 28%.
- College degree attainment increases from under 3% to 6%.
Although the narrowing of the high school education gap is encouraging, these results aren’t as significant as we would hope and formerly incarcerated people remain far less likely than the general public to take part in any postsecondary educational experiences. There are, however, opportunities to alleviate these educational inequalities and prevent them from ever occurring in the first place.
Recommendations
The severe educational barriers that formerly incarcerated people face reinforces their broader exclusion from society and harms the social and economic viability of the communities to which they return.
To remedy this exclusion, we need a new, evidence-based policy framework that addresses K-12 schooling, prison education programs, and reentry systems, which would yield measurable economic and public safety rewards.26 Below, we detail important policy recommendations that would help to achieve these goals.
- Fix K-12 school inequalities, such as those arising out of zero-tolerance disciplinary policies.27 Students — particularly students of color — should not suffer from a lack of educational resources or overly punitive school policies that funnel them into prisons simply because of the neighborhood in which they live. In order for education to truly be the “great equalizer” it first has to operate equally.
- Ensure that incarcerated people have access to robust educational services that prepare them for both higher education and 21st century jobs. Educational opportunities should be conceptualized as a means to begin the reentry process, not as a frivolous “extra.”
- States should immediately “ban-the-box” on all applications for admission to state funded colleges and universities. Postsecondary educational institutions should give everyone a fair opportunity to pursue their educational goals, not further punish criminalized people looking to get their lives on track.
- Restore Pell Grants to incarcerated people and remove other barriers to financial aid for incarcerated and formerly incarcerated people. Like public education, Pell Grants and other sources of student aid should be seen as public goods, available to everyone and enhancing both public safety and the social and economic mobility of all people.
See the appendix with the data and other data sources
Methodology
This report’s analysis of educational attainment and exclusion among formerly incarcerated people is primarily based on data from the National Former Prisoner Survey. The survey was a product of the Prison Rape Elimination Act, and mainly asks about sexual assault and rape behind bars, but it also contains some very useful data on education.
Because this survey contains such sensitive and personal information, the raw data was not available publicly online. Instead, it is kept in a secure data enclave in the basement of the University of Michigan Institute for Social Research. Access to the data required the approval of an independent Institutional Review Board, the approval of the Bureau of Justice Statistics, and required us to access the data under close supervision.
The practicalities of having to travel across the country in order to query a computer database limited the amount of time that we could spend with the data, and other rules restricted how much data we could bring with us. Additionally, if the number of respondents falling within any one group was too small, we were not allowed to export the data for that group due to privacy concerns.
Data Sources
The National Former Prisoner Survey (NFPS) began in January 2008 and concluded in October 2008, and was derived from the Prison Rape Elimination Act of 2003, which mandated that the Bureau of Justice Statistics investigate sexual victimization among formerly incarcerated people.
The NFPS dataset includes 17,738 adult respondents who were previously incarcerated in state prisons and under parole supervision at the time of the survey. Individual respondents were randomly selected from a random sample of over 250 parole offices across the United States.
It is important to note that because this survey was given to people on parole, it is not a perfect tool to measure educational attainment among all formerly incarcerated people. Some incarcerated people are released without supervision, and their ability to attain further educational credentials may differ from those on parole. Previous research suggests that parole obligations may, in and of themselves, create logistical barriers for people attempting to secure consistent work and school schedules.28
We drew upon specific NFPS survey questions for this report:
- A2. Are you of Hispanic or Latino origin?
- A3. Which of these categories describes your race?
- A7, A7a, A7b, A7c. What is the highest grade of school you ever attended/completed?
- A7d. Did you earn your GED while serving time in a prison, jail, or other correctional facility?
- B2a, B2b. Date of admission.
- B3a, B3b. Date of release.
- C1. Are you male, female, or transgendered?29
- F18. Do you currently have a job?
- F18b. Are you looking for work?
For measures of educational attainment in the general public, we used Census Bureau population estimates from the Current Population Survey (CPS), particularly Table A-2 from the CPS Historical Time Series Tables (2017) and Table 1 from Educational Attainment in the United States: 2008.
Appendix
The data behind the graphs in this report (Figures 1, 3, and 4) are in the tables below. (Note that, due to rounding, percentages may not total 100%.)
| Highest educational attainment | General public | Formerly incarcerated |
|---|---|---|
| No high school diploma or GED | 13% | 25% |
| High school diploma | 28% | 20% |
| GED | 3% | 33% |
| Some college | 26% | 19% |
| Bachelor’s degree or higher | 29% | 4% |
| Unemployment by race/ethnicity and gender | |||||||
|---|---|---|---|---|---|---|---|
| Population | Educational attainment | White men | White women | Black men | Black women | Hispanic men | Hispanic women |
| General public | No high school diploma or GED | 7.9% | 8.7% | 15.6% | 13.4% | 7.6% | 9.4% |
| Formerly incarcerated | No high school diploma or GED | 25% | 29% | 42% | 60% | 34% | 47% |
| Formerly incarcerated | All education levels | 18% | 21% | 33% | 37% | 26% | 33% |
| Formerly incarcerated | ||||||
|---|---|---|---|---|---|---|
| Educational attainment | White men | White women | Black men | Black women | Hispanic men | Hispanic women |
| No high school diploma or GED | 16% | 18% | 29% | 33% | 35% | 41% |
| Bachelor’s degree or higher | 5% | 6% | 3% | 4% | 2% | 1% |
This report, for the first time, analyzes educational attainment among formerly incarcerated people using nationally representative data, and compares post-release employment outcomes by educational level. Two previous, commonly cited studies have used national survey data to examine education among currently incarcerated people. These studies, conducted by the Bureau of Justice Statistics (BJS) and the U.S. Census Bureau, include people incarcerated in federal prisons, local jails, and other facilities, and focus on different research questions, such as reasons for dropping out of school, family background, and current educational enrollment. The BJS study includes an analysis of employment prior to incarceration, while the Census study does not address employment at all.
Researchers and policymakers interested in the education of correctional populations may find the following comparison of our analysis to these earlier national studies useful.
| Getting Back on Course(this report) | Education and Correctional Populations | Educational Characteristics of Prisoners: Data from the ACS | |
|---|---|---|---|
| Published by | Prison Policy Initiative | Bureau of Justice Statistics | U.S. Census Bureau |
| Year published | 2018 | 2003 | 2011 |
| Data collected (year) | 2008 | 1997 | 2009 |
| Populations | People on parole who were previously incarcerated in state prisons | People in state or federal prisons, in local jails, or on probation | Adults in federal and state prisons, local jails, federal detention centers, correctional residential facilities, and military disciplinary barracks and jails |
| Demographic breakdowns offered |
|
|
|
| Levels of educational attainment examined |
|
|
|
| Employment | Analysis of employment after incarceration | Analysis of employment prior to incarceration | No employment analysis of incarcerated population |
| Special topics covered | Educational level by time since release from prison (1 year or less since release compared to 4 years or more since release) |
|
|
About the Prison Policy Initiative
The non-profit, non-partisan Prison Policy Initiative was founded in 2001 to expose the broader harm of mass criminalization and spark advocacy campaigns to create a more just society. The organization is known for its visual breakdown of mass incarceration in the U.S., as well as its data-rich analyses of how states vary in their use of punishment. The Prison Policy Initiative’s research is designed to reshape debates around mass incarceration by offering the “big picture” view of critical policy issues, such as probation and parole, women’s incarceration, and youth confinement.
The Prison Policy Initiative also works to shed light on the economic hardships faced by justice-involved people and their families, often exacerbated by correctional policies and practice. Past reports have shown that people in prison and people held pretrial in jail start out with lower incomes even before arrest, earn very low wages working in prison, and face unparalleled obstacles to finding work and securing stable housing after they get out.
About the author
Lucius Couloute is a Policy Analyst with the Prison Policy Initiative and a PhD candidate in Sociology at the University of Massachusetts Amherst; his dissertation examines both the structural and cultural dynamics of reentry systems. Getting Back on Course is the third and final report in a series analyzing data from the National Former Prisoner Survey, all authored or co-authored by Lucius. The first report in the series, Out of Prison & Out of Work, provided the first-ever national unemployment rate among formerly incarcerated people. The second, Nowhere to Go, offered the first estimate of homelessness among the 5 million formerly incarcerated people living in the U.S.
Acknowledgements
This report benefitted from the expertise and input of many individuals. The author is particularly indebted to Dan Kopf for technical assistance and retrieving this data from the ICPSR Physical Enclave, Jodi Anderson for his insight into the value of education for criminalized people, Alma Castro for IRB assistance, Allen Beck for his insight into the NFPS, the ICPSR staff for their data retrieval support, Elydah Joyce for the banner illustration, and his Prison Policy Initiative colleagues, who have provided immeasurable assistance on each of the reports using the National Former Prisoner Survey.
This report was supported by a generous grant from the Public Welfare Foundation and by our individual donors, who give us the resources and the flexibility to quickly turn our insights into new movement resources.
Footnotes
- It is important to note that this data was gathered after people were released from prison, and thus the percentage of respondents with less than a high school credential is lower than what is typically found in datasets measuring the educational levels of currently incarcerated people. ↩
- This finding is based on our analysis of highest education attained. We find that among all formerly incarcerated people 25 years or older who attained high school credentials, 63% did so through a GED exam. In the general public, estimates suggest that only about 7-10% of everyone with high school credentials achieved that credential through a GED exam. See Sarah R. Crissey and Kurt J. Bauman’s working paper for more information. ↩
- See Pettit and Western’s (2004) article, Mass Imprisonment and the Life Course: Race and Class Inequality in U.S. Incarceration ↩
- This statistic is based on the percentage of formerly incarcerated people who received a GED as their highest level of educational attainment. In addition to those who earned GEDs in prison, we expect that a small number of formerly incarcerated people receive GEDs outside of prison and then go on to further their education; however, we were not able to track these pathways with our data. See the methodology to learn about our data collection. ↩
- For a concise review of research on the school-to-prison pipeline, see Christopher A. Mallett’s The School-to-Prison Pipeline: A Critical Review of the Punitive Paradigm Shift (2016). ↩
- For example, see Marc Behrendt and Teresa Franklin’s review of research on the value of school field trips: ↩
- See Deirdre Royster’s book, Race and the Invisible Hand (2003), where she found that personal networks were crucial in determining employment after high school. ↩
- See research by Lapan, et al., illustrating the importance of career development in high school. ↩
- See Table A-2 from the CPS Historical Time Series Tables (2017) ↩
- These are jobs that don’t generally require more than a high school education, such as production, construction, farming, mining, machine operating, assembly, clerical work, retail sales, and service occupations. Among low-skill jobs, non-service jobs have declined more markedly, while service sector jobs have rebounded since 1980. Unfortunately, due to occupational license restrictions or employer liability concerns, formerly incarcerated people may be ineligible for many service jobs, such as security services, house cleaning, and home health assistance. Together, these changes leave formerly incarcerated people at a greater competitive disadvantage for even fewer jobs than in decades past. The data source for the low-skill jobs decline in our chart comes from Table 1 in The Growth of Low-Skill Service Jobs and the Polarization of the US Labor Market by David H. Autor and David Dorn (2013). ↩
- See our previously published report on unemployment among formerly incarcerated people. Also note that the unemployment rate is different from the joblessness rate. Joblessness includes anyone who does not have a job, whether they are looking for one or not. Unemployment, which is typically used to measure the economic well-being of the general U.S. population, includes only those people who want to work but can’t find a job. This measure of unemployment allows us to examine the extent to which structurally disadvantaged formerly incarcerated people are locked out of the labor market, and avoids the need to discuss whether they actually want jobs or not. ↩
- Unfortunately, because of the sample size and level of data disaggregation, we were not able to produce reliable statistics for additional educational levels. See the methodology for details. ↩
- See Appendix B (page 24) of Sarah R. Crissey and Kurt J. Bauman’s working paper, Measurement of High School Equivalency Credentials in Census Bureau Surveys (2012). ↩
- See Stephanie Ewert’s article for the U.S. Census Bureau Blog examining income by educational level for the data and further discussion. ↩
- One study using data from Florida demonstrates that (compared to those without GEDs) receiving an GED in prison led to higher post-imprisonment earnings for some groups, but this effect dissipated after the first year. Other research has established an important link between GED programs and reduced recidivism rates. ↩
- See the Census Bureau’s Survey of Income and Program Participation 2008 dataset ↩
- To get an idea of the supplemental educational experiences and supports incarcerated and formerly incarcerated people may need, see the Prison-to-College Pipeline program, offered by the Prisoner Reentry Institute at John Jay College. The program emphasizes building reading and writing skills that prepare incarcerated students for college-level coursework. ↩
- Measures of educational attainment in the general public in this section come from the Census Bureau’s Current Population Survey, in particular Table 1 from Educational Attainment in the United States: 2008 ↩
- For context, the last time less than 5% of the general U.S. population had a college degree was in 1940 - before the end of World War II, before the implementation of the GI Bill, and before the Supreme Court outlawed segregation in public schools. See Table A-2 from the CPS Historical Time Series Tables (2017). ↩
- Estimates for the number of college degree programs before and after the 1994 crime bill come from “Uncaptive Minds.” The U.S. Department of Education provides a list of institutions selected for the “Second Chance Pell Experiment,” through which 12,000 incarcerated people are eligible for Pell grants. A handful of college programs are able to operate without federal funds, such as the Bard Prison Initiative, Hudson Link, and the Prison University Project at San Quentin. ↩
- The 1994 crime bill banned Pell grant eligibility for people in prison, effectively cutting off funding for most in-prison college programs. In 2015, the Department of Education under President Obama piloted an experimental program making 12,000 incarcerated students eligible for Pell grants. In 2018, the full reversal of the 1994 ban on Pell grants was being considered as part of the reauthorization of the Higher Education Act, but as of this writing, Pell grants were still limited to a small fraction of the incarcerated population. For more on the history of Pell grants for incarcerated people, see “Senate Leaders Reconsider Ban on Pell Grants for Prisoners.” For an explanation of eligibility criteria for students with criminal convictions, see the Federal Student Aid website. ↩
- In 2018, the Common Application “banned the box” to help mitigate this barrier to entry, but institutions are still able to inquire about applicants’ criminal history. The Center for Community Alternatives studied the effects of criminal history screening on application completion and a recent national audit found evidence of discrimination in admissions based on criminal history (see the American Sociological Association meeting presentation). ↩
- The National Inventory of Collateral Consequences of Conviction shows that at least 11 states that have either mandatory or discretionary restrictions on admission to the bar or to be certified as a paralegal: Alabama, Arizona, California, Connecticut, Idaho, Iowa, Kansas, Missouri, North Carolina, North Dakota, and Oregon. ↩
- Prior research suggests that the intersection of English language barriers and resource-poor schools present especially steep educational barriers for Hispanic people in the United States. ↩
- For historical data on educational attainment in the general population, see Table A-2 from the Census Bureau’s CPS Historical Time Series Tables (2017). ↩
- For example, the Vera Institute of Justice outlines the benefits of college programs in prison in its fact sheet, Expanding Access to Postsecondary Education in Prison. ↩
- For more on this, see Nancy Heitzeg, Education or Incarceration: Zero Tolerance Policies and the School to Prison Pipeline (2009) ↩
- See Christine S. Scott-Hayward’s paper on the effects of parole on reentry, The Failure of Parole: Rethinking the Role of the State in Reentry (2011). A section on “Parole as an Obstacle to Reentry” begins on page 448 (or page 28 of the pdf). ↩
- We could not analyze the trans population because the number of trans-identified people in the survey was too small to use, and doing so posed a risk of respondent identification. See the methodology for details. ↩
Recommended Reading:

Advocacy Toolkit
Resources, tips, and best practices to help advocates working to end mass incarceration.

50 state incarceration profiles
All of our recent reports about prison/jail growth, racial disparities, and more, re-organized by state.

Mass Incarceration: The Whole Pie
The U.S. incarcerates nearly 2 million people. Where are they locked up and why? Read our report.

Events
- April 30, 2025:
On Wednesday, April 30th, at noon Eastern, Communications Strategist Wanda Bertram will take part in a panel discussion with The Center for Just Journalism on the 100th day of the second Trump administration. They’ll discuss the impacts the administration has had on criminal legal policy and issues that have flown under the radar. Register here.
Not near you?
Invite us to your city, college or organization.