New data: Police use of force rising for Black, female, and older people; racial bias persists
New survey data from the Bureau of Justice Statistics on police interactions in 2019 and 2020 provide the broadest look at relations between police officers and the public. The findings leave a lot to be desired (as they’re primarily pre-pandemic), but the message is clear: police are still a massive presence in our communities, and they don’t always provide the solutions and safety we need.
by Leah Wang, December 22, 2022
This briefing has been updated with a new version examining data from 2022.
At a time when the public desperately needs accurate, comprehensive data about how the police interface with people in the United States, the Bureau of Justice Statistics has released a new report based on a 2020 survey about interactions between police and the public. Despite a seemingly smaller “footprint” of police interactions in the community that year — fewer people came into contact with police overall — those interactions were still too often racially discriminatory and too often involved improper or harmful conduct.1
You might expect that this survey would tell us about the state of policing amidst the deep social unrest caused by the COVID-19 pandemic and a number of high-profile police killings. Unfortunately, the survey was conducted between January and June of 2020, so many of the responses actually refer to experiences with police in 2019 and in the earliest months of 2020.2 And while the Bureau of Justice Statistics did thoughtfully document certain changes driven by the COVID-19 pandemic in other data collections,3 the police contact survey results fail to provide the public with critical and timely information about how policing changed — or didn’t change — in 2020, particularly during the nationwide reckoning with racialized police violence after the death of George Floyd. Still, some of the findings got our attention.
Of people surveyed4 between January and June of 2020 about their recent experiences with police:
More than 1 in 5 people reported coming into contact with police in the past 12 months. About half of all police contacts were initiated by residents who reached out to the police to report a crime, seek help, or for another reason; the other half were initiated by police, through traffic stops or otherwise approaching or arresting someone. Police actually had less contact with the public in 2020 than in 2018 (the last time this survey was administered), but that is unsurprising given the pandemic-related lockdowns in early 2020.5
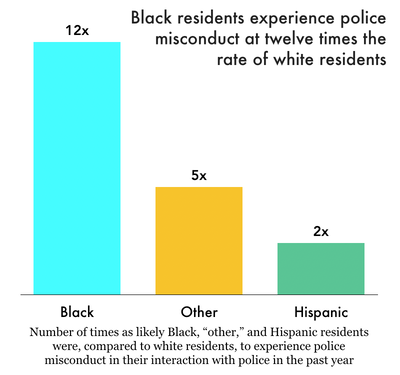
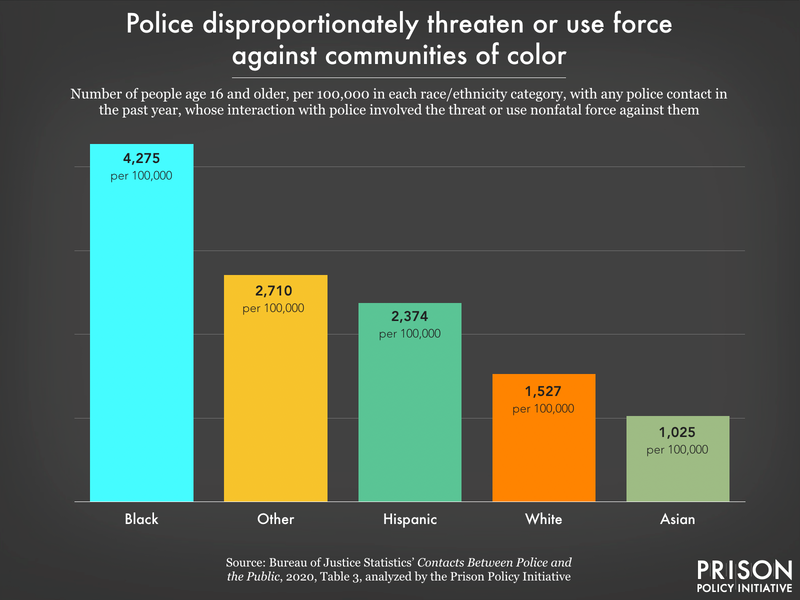
Racial disparities in policing persist, particularly in the threat or use of force. Only 2% of people who had any contact with police experienced the nonfatal threat or use of force6 by police in the past year, but this aggression fell disproportionately on Black, Hispanic, and “Other” (non-Asian, non-white) people. Black people were also nearly 12 times more likely than white people to report that their most recent police contact involved misconduct, such as using racial slurs or otherwise exhibiting bias.
During traffic stops, Black and Hispanic people were the most likely groups to experience a search or arrest. Meanwhile, white people were the least likely to receive a ticket and the most likely just to get off with a warning during a traffic stop. The immense discretion — and lack of accountability — police have when making traffic stops leaves too much room for racially biased questioning and enforcement.7
Older people are vulnerable to harmful interactions with police. More than 1 in 7 people age 65 or older reported police contact, and the number of older people experiencing the threat or use of force nearly doubled between 2018 and 2020.8 Meanwhile, the number of people experiencing force declined among all other age groups. Other data show that arrests of people 65 and older have increased over the past decades, too, unlike overall arrests.9 These concerning trends should spark urgent conversations about the role and training of police when it comes to aging populations.
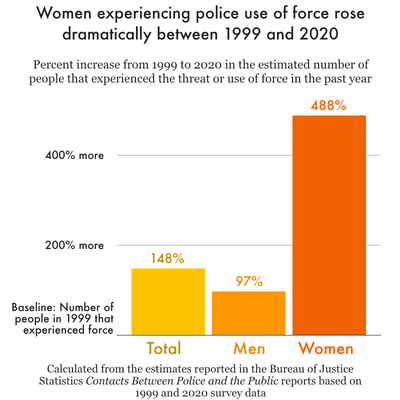
More and more, police are threatening or using force against women. Women accounted for an alarming 31% of all people experiencing the threat or use of force by police, and over half of women (51%) who experienced threat or use of force in their most recent police interaction reported that such conduct by police was “excessive,” a result which is up a significant 8 percentage points from the last survey in 2018. These findings raise the obvious question: Why are women increasingly targeted by police hostility while men’s police encounters, including arrests, continue to plummet?10
Police act “properly” most of the time, but do they provide solutions to people needing help? Of those who initiated contact with police, most (91%) perceived the police as behaving properly when they showed up, and most (93%) were at least equally likely to contact police in the future, varying little by sex, race and ethnicity, or age. But over a third of people (36%) who contacted police for help felt that the police response didn’t improve their situation. The fact that most people would contact police in the future even when they haven’t been helpful in the past is a clear indication of our dependence on police, and the need for alternatives to policing.
Additional context: Data on law enforcement staffing levels in 2020
The Bureau of Justice Statistics also released a number of publications based on regular administrative surveys of law enforcement personnel. These staffing surveys, unlike the Police-Public Contact Survey, actually cover the full calendar year for 2020, when policing was central to national conversations about safety and social justice.
If there’s one timely thing to come out of this recent wave of data, it’s that police were not “defunded” in 2020 — since 2016, the number of full-time staff has barely changed in local police departments (down one-tenth of one percent), and has even slightly increased in sheriff’s offices and federal agencies employing law enforcement. This finding tracks with reports of stagnant or increased budgets in the 2021-22 fiscal year in many police departments nationwide, including 34 of the largest 50 U.S. cities.
Sheriffs and police chiefs also continue to be overwhelmingly white (87% each) and male (99% of sheriffs and 96% of police chiefs). If law enforcement agencies continue to operate at current scales without leadership or staff that actually represent the diversity of their communities, how can they hope to equitably protect and serve those communities?
The results of the 2020 Police-Public Contact Survey and other staffing surveys only scratch the surface of how police function in our communities (for example, the data don’t tell us about police contact by sex and race or ethnicity, obscuring the experiences of women of color and of LGBT people with police), let alone how police interactions shifted throughout the tumultuous first year of the COVID-19 pandemic. Still, these data are essential to assessing whether on-the-ground police interactions are actually happening at a scale that is appropriate, and with outcomes that are safe and appropriate, for issues that actually require police. For many people engaged in the reimagining of public safety, police should have a greatly reduced role in areas like traffic safety and crisis response.
Hopefully, future versions of this survey will help paint a clearer picture of how policing has evolved over the past two years and how advocates and lawmakers can continue to push for change, like halting the overuse of police and jails to respond to the needs of people with economic disadvantages or health needs. As the data show, we’ve yet to see meaningful shifts in policing institutions.
Footnotes
-
Note that the survey doesn’t cover fatal police interactions, a uniquely American crisis. ↩
-
Further, the impact of COVID-19 in early 2020 meant that the survey responses dropped between March and June 2020, when the survey team halted in-person interviews. ↩
-
For example, the Bureau of Justice Statistics documented positive cases, deaths, and expedited releases in prisons and in tribal jail populations, as well as changes in probation and parole in response to the pandemic. ↩
-
The Police-Public Contact Survey (PPCS), which is a supplement to the more widely-known National Crime Victimization Survey (NCVS), followed up with respondents age 16 and older (while the NCVS starts at 12 years old) and asked questions about non-fatal contact with police in the 12 months prior to the interview. ↩
-
Compared to 2018, in 2020 there were about 1 million fewer traffic accidents with a police response, 2.7 million fewer traffic stops reported, and almost 1.5 million fewer street stops and approaches. ↩
-
In this survey, nonfatal force refers to being handcuffed, pushed or grabbed, hit or kicked, used chemical or pepper spray on, used an electroshock weapon on, pointed or fired a gun at, or used some other type of physical force on. ↩
-
For more policy context on “pretextual traffic stops” — when a police officer pulls someone over for a minor violation and uses the stop to investigate an unrelated criminal offense — see this publication from the Pew Research Center. ↩
-
In 2018, there were 35,200 instances of a threat or use of nonfatal force during a police interaction with someone age 65 or older; in 2020, there were 69,200, a 97% increase. ↩
-
According to analysis of government data by The Marshall Project, there were 30% more arrests of people 65 or older in 2020 than in 2000, while there were 40% fewer total arrests in 2020 than in 2000. ↩
-
For example, men’s arrest rates fell by 43% between 1980 and 2019, while women’s arrest rates increased by 19% over the same time period, according to arrest data collected by the Federal Bureau of Investigation (for 1980-2014 and for 2015 onward). ↩

