Report shows every community is harmed by mass incarceration
June 27, 2022
Today the Prison Policy Initiative and Justice Policy Institute released a new report, Where people in prison come from: The geography of mass incarceration in Maryland, that gives an in-depth look at where people in Maryland state prisons come from. The report also provides 9 detailed data tables — including neighborhood-specific data for Baltimore City and Montgomery County — that serve as a foundation for advocates, organizers, policymakers, data journalists, academics, and others to do their own analysis of how incarceration relates to other factors of community well-being.
The report shows:
Every single county — and every legislative district — is missing a portion of its population to incarceration in state prison;
No city is harmed by mass incarceration as much as the city of Baltimore. It is home to 9% of the state’s residents, but 40% of people in its state prisons.
Smaller and traditionally under-resourced Eastern Shore communities are particularly hard hit by mass incarceration; and
The worst impacts of mass incarceration are often concentrated in specific neighborhoods that are already systematically under-resourced. For example, over a third of the people from the city of Baltimore in state prison come from just 10 of the cities 55 neighborhoods.
Data tables included in the report provide residence information for people in Maryland state prisons at the time of the 2020 Census, offering the clearest look ever at which communities are most impacted by mass incarceration. They break down the number of people locked up by county, city, town, zip code, legislative district, census tract, and other areas.
The data show the counties with the highest state prison incarceration rates are Wicomico, Dorchester, and Somerset, all with incarceration rates greater than 500 people in state prison per 100,000 residents. For comparison, Montgomery County has the lowest prison incarceration rate, at 61 people in state prison per 100,000 residents, roughly 10 times lower than the highest counties.
“The nation’s 40-year failed experiment with mass incarceration harms each and every one of us. This analysis shows that while some communities are disproportionately impacted by this failed policy, nobody escapes the damage it causes,” said Emily Widra, Senior Research Analyst at the Prison Policy Initiative. “Our report is just the beginning. We’re making this data available so others can further examine how geographic incarceration trends correlate with other problems communities face.”
The data and report are made possible by the state’s landmark 2010 law that requires that people in prison be counted as residents of their hometown rather than in prison cells when state and local governments redistrict every ten years. Maryland was the first state in the nation to end the practice of “prison gerrymandering,” which gave disproportional political clout to state and local districts that contain prisons at the expense of all of the other areas of the state. Since then, more than a dozen states and 200 local governments have taken steps to end the practices. In total, roughly half the country now lives in a place that has taken action to address prison gerrymandering.
A new report from the Prison Policy Initiative offers the most recent national data on incarcerated people’s health, and shows that U.S. state prisons are continuing to ignore the plight of people in their care. The report, Chronic Punishment: The unmet health needs of people in state prisons, examines the Bureau of Justice Statistics’s Survey of Prison Inmates and breaks down the prevalence of several chronic conditions in this country’s 1,566 state prisons. The report also takes a deep dive into the medical histories of people behind bars.
Key findings in Chronic Punishment include:
People in state prisons suffer disproportionately from asthma, hepatitis C, HIV, and substance use disorder.
Significant numbers of people in state prisons also suffer from illnesses such as heart disease, hypertension, and diabetes, which are exacerbated behind bars.
Half (50%) of people in state prisons lacked health insurance upon the arrest that led to their incarceration, and those with insurance disproportionately received Medicaid, a sign that poverty, exclusion from the healthcare system, and incarceration overlap significantly in this country.
Other standout findings in the report suggest that state prisons, nationally, are not treating medical problems among incarcerated people:
Four in 10 (43%) people in state prison report one or more diagnosed mental health conditions, and women’s rates are even higher. Yet only about one-fourth (26%) have received some sort of professional help for their mental health since entering prison.
19% of people in state prisons report having gone without a single health-related visit since entering prison.
Existing research suggests that many people who go to prison die prematurely: Cancer is more deadly in prison than on the outside, and people recently released from prison have a higher risk of hospitalization and death from heart disease than the average person. In the first two weeks after release from prison, individuals face a risk of death that is more than 12 times higher than for non-incarcerated individuals.
The report, which includes 15 powerful data visualizations, analyzes how the typical individual in state prison lacked healthcare long before their incarceration and how prison doctors often diagnose problems that prisons lack the capacity to treat. The report takes a particularly close look at how incarcerated women fare medically, including a section about the treatment of people who are pregnant.
Chronic Punishment is the second installment in the Prison Policy Initiative’s analysis of the 2016 Survey of Prison Inmates, a national dataset released last year that offers the most thorough and recent demographic picture of people behind bars in the U.S. This report follows the Prison Policy Initiative’s recent report Beyond the Count about the adverse life experiences of people behind bars. The data cannot be disaggregated by state.
Report shows every community is harmed by mass incarceration
June 16, 2022
Today the New Jersey Institute for Social Justice and the Prison Policy Initiative released a new report, Where people in prison come from: The geography of mass incarceration in New Jersey, that provides an in-depth look at where people incarcerated in New Jersey state prisons come from. The report also provides eight detailed data tables — including neighborhood-specific data for Newark and Jersey City — that serve as a foundation for advocates, organizers, policymakers, data journalists, academics and others to analyze how incarceration relates to other factors of community well-being.
The data and report are made possible by the state’s landmark 2020 law that requires that people in prison be counted as residents of their hometown rather than in prison cells when state and local governments redistrict every ten years.
The report shows:
Every single county — and every state legislative district — is missing a portion of its population to incarceration in state prison.
Many of the state’s smallest counties, including Cumberland, Cape May and Salem, have among the highest incarceration rates in the Garden State.
There are dramatic differences in incarceration rates within communities. For example, in Newark, one of the most racially segregated cities in the nation, residents of the Belmont neighborhood are more than four times as likely to be imprisoned than residents of neighboring University Heights.
Data tables included in the report provide residence information for people in New Jersey state prisons at the time of the 2020 Census, offering the clearest look ever at which communities are most impacted by mass incarceration. They break down the number of people locked up by county, city, town, zip code, legislative district, census tract and other areas.
The data show the counties with the highest state prison incarceration rates are Cumberland (444 per 100,000 residents), Atlantic (364 per 100,000 residents) and Essex (351 per 100,000 residents). For comparison, Hunterdon County has the lowest prison incarceration rate, at 28 people in state prison per 100,000 residents, which is nearly 16 times lower than Cumberland County.
“The nation’s 40-year failed experiment with mass incarceration harms each and every one of us. This analysis shows that while some communities are disproportionately impacted by this failed policy, nobody escapes the damage it causes,” said Emily Widra, Senior Research Analyst at the Prison Policy Initiative. “Our report is just the beginning. We’re making this data available so others can further examine how geographic incarceration trends correlate with other problems communities face.”
The report cites studies that show that incarceration rates correlate with a variety of negative outcomes, including higher rates of asthma, depression, lower standardized test scores, reduced life expectancy and more. The data included in this report gives researchers the tools they need to better understand how these correlations play out in New Jersey.
“Eliminating prison-based gerrymandering in New Jersey was not only a huge win for achieving fairer representation for incarcerated people, but it also allows us to see, down to the neighborhood-level, the true costs of mass incarceration in New Jersey,” said Henal Patel, Director of the Democracy & Justice Program at the New Jersey Institute for Social Justice. “The availability of this new data makes room for much more targeted and robust policy solutions to some of the often race-related inequities in the Garden State.”
This is the second in a series of reports examining the geography of mass incarceration in America.
New Jersey is one of more than a dozen states and 200 local governments that have addressed the practice of “prison gerrymandering,” which gives disproportional political clout to state and local districts that contain prisons at the expense of all of the other areas of the state. In total, roughly half the country now lives in a place that has taken action to address prison gerrymandering.
Report shows every community is harmed by mass incarceration, particularly in upstate New York
June 6, 2022
Today, the Prison Policy Initiative and VOCAL-NY released a new report, Where people in prison come from: The geography of mass incarceration in New York, that gives an in-depth look at where people in New York state prisons come from. The report also provides 13 detailed data tables — including neighborhood-specific data for New York City, Buffalo, Syracuse, and Yonkers — that serve as a foundation for advocates, organizers, policymakers, data journalists, academics, and others to do their own analysis of how incarceration relates to other factors of community well-being.
The report shows:
Every single county — and every Assembly and Senate district — is missing a portion of its population to incarceration in state prison;
Upstate communities, including some of the least populous counties, have disproportionately high state prison incarceration rates; and
The worst impacts of mass incarceration are often concentrated in specific neighborhoods that are already systematically under-resourced. For example, more than a quarter of everyone in state prison from Syracuse comes from just 4 of that city’s 32 neighborhoods.
Data tables included in the report provide residence information for people in New York State prisons at the time of the 2020 Census, offering the clearest look ever at which communities are most impacted by mass incarceration. They break down the number of people locked up by county, city, town, zip code, legislative district, census tract, and other areas.
The data show the six counties with the highest state prison incarceration rates are upstate: Schenectady, Albany, Monroe (Rochester), Oneida (Utica), and Onondaga (Syracuse). Additionally, New York City had a state imprisonment rate below the state average, more than five times lower than Rochester, and more than four times lower than Syracuse and Albany.
“The nation’s 40-year failed experiment with mass incarceration harms each and every one of us. This analysis shows that while some communities are disproportionately impacted by this failed policy, nobody escapes the damage it causes,” said Emily Widra, Senior Research Analyst at the Prison Policy Initiative. “Our report is just the beginning. We’re making this data available so others can further examine how geographic incarceration trends correlate with other problems communities face.”
The report also highlights other studies that show a correction between areas in the state with high incarceration rates and a wide range of negative consequences, including lower life expectancy, increased rates of asthma (including in children), and lower standardized test scores.
“This data allows us better understand the full scale of the devastation mass incarceration has brought to communities across New York,” said Nick Encalada-Malinowski, of VOCAL-NY. “More importantly though, it can be used as a roadmap for leaders who are committed to breaking the cycle of incarceration by investing in the communities that need it most.”
The data and report are made possible by the state’s landmark 2010 law that requires that people in prison be counted as residents of their hometown rather than in prison cells when state and local governments redistrict every ten years. New York was among the first states in the nation to end the practice of “prison gerrymandering,” which gave disproportional political clout to state and local districts that contain prisons at the expense of all of the other areas of the state. Since then, more than a dozen states and 200 local governments have taken steps to end the practices. In total, roughly half the country now lives in a place that has taken action to address prison gerrymandering.
Here at the Prison Policy Initiative, we know a strong visual can drive home a point, change someone’s mind, or spur a person to action. It is why data visualizations are a core part of our research and communications strategy.
We usually only update our data visualizations about mass incarceration when a new report or briefing requires it. However, some graphs are so powerful that they warrant special treatment. In recent months, new data has been released about jail suicides, racial disparities, probation, and state incarceration rates. So we’ve updated a few of our most impactful charts with this new data to equip advocates, lawmakers, and journalists with the most up-to-date information available.
These updated charts show how people of color, particularly Black and Native American people, are disproportionately incarcerated in the United States.
Visit our Racial Justice page for more reports, briefings, research, and visualizations focused on the intersection of race and mass incarceration.
State policies drive mass incarceration
While the activities of Congress often grab headlines, it’s state legislatures that have a chance to make the most progress toward ending mass incarceration.
That’s because, as these charts make clear, state governments and their policies are responsible for the vast majority of people incarcerated in this country. And while the COVID pandemic has led to recent drops in incarceration rates, without intentional action from the states, these reductions will almost certainly be short-lived.
Suicide is the single leading cause of death for people in jail, a fact that isn’t surprising considering the mountains of research that shows incarceration is inherently bad for a person’s mental health. As this updated chart shows, someone in jail is more than three times as likely to die from suicide as someone in the general U.S. population.
For many people, their prison sentence tells only part of the story of their involvement with the criminal legal system. As a result of prohibitively high cash bail, they are often held in a local jail for weeks, months, or even years before they are convicted of a crime. And then, once they’re released from prison, they often remain under state supervision through parole for years, living with the constant threat of being jailed for a technical violation.
As these updated charts show, pretrial detention is the driver of jail population growth over the last 20 years, and roughly half of all people under correctional control are on probation. And despite recent pandemic-related reductions in these numbers, they’re still too high and likely to increase as pandemic slowdowns ease.
Visit our Probation and Parole page for more reports, briefings, and visualizations that show that someone isn’t free just because they’re not behind bars. And check out our Jails and Bail page for more research on these institutions’ roles in the carceral system.
We’ve also updated the underlying data behind some of these charts in our data toolbox to empower advocates, lawmakers, and journalists to show the consequences of mass incarceration in their communities. If you’re using this data in your work, we want to know about it.
No wonder prisons and jails face constant understaffing and that communities increasingly resist new facilities: Decades of research show that the physical and mental health problems associated with correctional officers' jobs are inherent to the work, and that new prisons and jails fail to deliver on promises of economic development.
As we well know, people incarcerated in jails and prisons experience constant trauma, and are surrounded by brutality and violence that are impossible to escape. This experience has only grown worse in recent months. As we are frequently reminded in media coverage, prison and jail security staff (known as correctional officers or “COs”) have been quitting their jobs and failing to show up for work. This turnover and absenteeism leaves incarcerated people locked down in cells, experiencing minimal freedom of movement and social interaction, lost recreation time, difficulties accessing physical and mental health care, worse and less reliable food and mail services, and fewer programming and education opportunities.
But why are departments of corrections throughout the country complaining that they are unable to hire and retain enough staff?
The simplest and most obvious answer is there are way too many people locked up. States could dramatically reduce the need for additional staff by arresting and booking fewer people and releasing more. In European countries (which incarcerate far fewer people), the ratios of incarcerated people to staff are significantly lower than in the United States. As noted in a 2013 press release from the union representing federal workers, the number of federal correctional workers increased 19% from 2000 to 2013, while the federal prison population grew 41%.
But there is another reason prison and jail jobs sit vacant — a problem exacerbated by the pandemic but long predating it. Any way you look at it, working in a prison or jail is traumatic and harmful to mental health. As a result, people have always quit these jobs at high rates. Nearly 40 years ago, in 1983, a paper warned that “officer stress and burn-out has led to soaring organizational costs due to high rates of absenteeism and turnover.” In 2000, the average national turnover rate among COs was 16% (meaning the number of people quitting was 16% of the average CO headcount that year), a rate one author called “alarmingly high.” And a 2010 report found that the average CO turnover rate was 17% in 2006 and 2007, and 16% in 2008.
Today, as prisons and jails have become vectors of COVID-19, turnover rates have grown higher than ever.1 But as this briefing shows, long before COVID, corrections work meant being surrounded by trauma and suffering, while working stressful jobs that are both monotonous and require constant vigilance.
Of course, much of the violence behind bars is perpetrated by COs themselves; we know that staff often assault and abuse incarcerated people; encourage, bribe and threaten incarcerated people to abuse others; and watch without intervening when violence breaks out. In fact, Micol Seigel proposes in her book that prison workers — along with police, members of the military, and others employed in security or detention — can collectively be considered “violence workers,” as their roles are designed to exercise the state’s power to use violence for enforcement. Violence in correctional facilities is further exacerbated by stressful, miserable living conditions. But while this violence harms incarcerated people the most, it has life-altering consequences for workers as well. As a result, COs face negative mental and physical health outcomes, including extremely high rates of depression and PTSD. Worst of all, for many COs, the job fundamentally changes the way they relate to others, requiring them to dehumanize the people they supervise and cultivate a brutal authority that is hard to shake even at home.
This creates a vicious cycle. Correctional jobs are stressful and traumatic, leading to high rates of burnout, absenteeism, and staff turnover. But when people quit or don’t show up for work, this makes the job even worse for their colleagues, who are often left working overtime shifts2 alongside new, inexperienced coworkers.3
While the trauma and stress faced by incarcerated people dwarfs the experiences of correctional officers, it is important to study the frequently overlooked ways that prisons and jails harm everyone associated with them.
This is particularly crucial because, for years, state and local governments have used the promise of these “good state jobs” to garner support for newer, bigger prisons. For decades, rural towns looked to prisons as a saving grace that would bring economic development, boost local populations, and most of all, replace disappearing jobs. As that prison-building boom cools, now we are seeing pressure to build new, expanded county and city jails. But when officials promote prisons and jails as job creators, it is important to keep in mind what these jobs actually look like, and the effects they have on workers and the community.
To be clear, the problems outlined throughout this article are fundamental to the nature and environment of working in a prison or jail. These problems cannot be solved by increasing budgets, doubling down on hiring efforts, providing additional training, or increasing pay and benefits.
Exposure to trauma is inescapable on the job
Although incidents of violence behind bars are poorly tracked and reported, every count we do have shows that those who spend time in prisons and jails (staff and incarcerated people alike) are surrounded by traumatizing violence:
Estimating the prevalence of violence in prisons and jails
Other adult facilities (i.e., military prisons, ICE facilities, and jails on tribal lands that hold only adults): 219 reported incidents in 2018
A 2021 paper analyzing the experiences of 156 correctional supervisors in a northeastern U.S. state revealed that large percentages witnessed or experienced the following traumatic events in a typical month:
55% – a suicide attempt by an incarcerated person
93% – violence inflicted by one incarcerated person on another
And in a typical year, many reported witnessing or experiencing:
61% – suicide of an incarcerated person
65% – non-suicide death of an incarcerated person
45% – a coworker suicide
Similarly, a team of researchers have published a series of papers based on surveys of Canadian workers in high-stress occupations. They found that institutional corrections workers report high rates of exposure to various traumatic events. For example:
45% had witnessed a death in line of duty
78% experienced or witnessed serious injuries in the line of duty
69% experienced or witnessed incidents that seriously threatened their life or the life of a colleague
65% witnessed or learned about the suicide of a close colleague or superior
A correctional officer from Oregon described this on-the-job trauma in a 2015 article in the Guardian: “You’re doing tier count and you’re watching a human being die in front of your eyes because he’s coughing up lungs and screaming with his eyes for help and there’s nothing you can do.” The man’s son, also a CO, recalled that on his first day of work, he witnessed the mutilated body of a man who had been beaten to death.
Correctional officers have high rates of depression, PTSD, and suicide
It is not surprising that many COs struggle with the mental and emotional toll of regular exposure to trauma. A 2021 analysis of thousands of anonymous surveys filled out by COs in California prisons revealed that, among those who answered specific questions about the prior month:
48% had felt anxious, nervous, or on edge
80% felt tired or fatigued, even right after sleeping
28% consumed six or more drinks on at least one occasion
28% felt down, depressed, or hopeless
4% experienced repeated, disturbing memories
11% had suicidal thoughts or had attempted suicide
A 2018 survey of corrections employees in Washington State estimated a PTSD rate of 19%, which is similar to rates among veterans of the Iraq and Afghanistan wars, and higher than that of police officers.
Several studies put the rate of PTSD even higher. A 2013 study of nearly 3,600 corrections professionals from all over the country estimated that 34% of correctional staff in security roles have PTSD and 31% have depression. A 2016 paper studying correctional officers in Michigan estimated that 34% of participants had PTSD, 36% had depression, and 25% had both. Rates of both — as well as the risk of suicide — were higher among people working in high-security units, and among those who had worked in corrections for 10 years or more, indicating that these problems do not get easier with time or experience. And a 2017 Canadian study (again, using the pool of high-stress workers mentioned above) found that more than 54% of correctional workers screened positive for mental disorders including PTSD (29%) and major depressive disorder (31%), compared to a baseline diagnosis rate of 10% of the Canadian population.
Although there are not many studies on correctional officer suicides, one analysis found that COs in New Jersey had more than double the suicide rate of 25-to-64 year old men in the state from 2003 to 2007. A 2016 article tracking CO suicides in Massachusetts found the suicide rate to be about six times that of the general state population. An earlier study from 1997 found that COs have a 39% higher rate of suicide than the rest of the working age population. And the survey of Canadian correctional workers revealed that 35% had experienced suicidal ideation in their lifetimes (including 11% in the prior year), and 8% had previously attempted suicide.
This relentless stress inevitably leads to burnout, which is often associated with workers in healthcare, human services, and education, and is characterized by emotional exhaustion, depersonalization, and a sense of a lack of personal accomplishments. Burnout can lead to depression, and can cause someone to withdraw emotionally, psychologically, and socially from their job. A 2020 Swiss study found that — although violence is infrequent in Swiss prisons — COs who did witness or directly experience violence had more exhaustion and a decreased sense of security, which in turn, led to higher levels of burnout. The paper concluded that “not only serious major incidents, but also the daily grind have an effect.”
A 2013 literature review, which provides a collection of research on the topic, concluded that the implications of stress and burnout are far-reaching:
Workplace stress and burnout among COs can lead to unsafe correctional facilities, high turnover rates, high absenteeism, lower productivity and decreased effectiveness in the workplace as well as negative personal and social outcomes like decreased life satisfaction and work-family conflict.
In fact, a 2014 paper for the National Institute of Corrections proposed a diagnostic category called “corrections fatigue,” which can have implications including “negative personality changes, socially dysfunctional thinking/ideology, and forms of declined health and functioning.” Those researchers further estimated that 20% of correctional officers experience corrections fatigue.
These consistent findings of rampant PTSD and depression among COs are remarkably similar to studies of incarcerated people. Research among incarcerated populations have found rates of PTSD at 48%. And much like corrections fatigue, researchers have identified “post-incarceration syndrome,” a subset of PTSD. In-depth interviews with 25 people who were incarcerated an average of 19 years revealed a “specific cluster of mental health symptoms,” including institutionalized personality traits, social-sensory disorientation, and alienation. These high rates among both prison staff and incarcerated individuals indicate that prisons themselves are unhealthy, dangerous spaces that contribute to serious and lasting mental health problems.
COs experience chronic pain and hypertension, and are exposed to illness and violence
The stressful nature of the job brings other physical drawbacks. A 1983 study found that correctional officers had higher rates of hypertension (high blood pressure) and heart disease than the general population, both of which are linked to stress. And a 2015 study found extremely high baseline levels of hypertension and pre-hypertension among correctional officers. While hypertension usually shows up later in life, the study revealed high rates among COs ages 20 to 34 and 35 to 44.4
While estimates vary regarding the percentage of COs who are victims of violence on the job, it is clear that working in a prison comes with an increased risk of violence. The Bureau of Justice Statistics (BJS), for example, found that from 2005 to 2009, 33 out of every 1,000 COs reported experiencing workplace violence (defined as rape/sexual assault, robbery, and aggravated and simple assault).5 Compared to other professions in the study, this rate is lower only than bartenders, police officers, and security guards.6
Of course, when considering data on this type of violence, it is important to remember that it is self-reported by correctional officers, making it impossible to know what role they or their colleagues might have played in the reported incidents. COs are incentivized to report every possible incident as an assault, as a way of justifying budget and salary increases.
And it is clear that the constant fear of violence further adds to stress and negative mental health outcomes, and can contribute to job performance and turnover rates.7 In this way, too, COs’ risk of violence mirrors the experiences of incarcerated people.8
Prisons — no matter how modern — are depressing work environments
Back in 1982, a review of the stresses of prison work stated the obvious:
Any organization or social structure which consists of one group of people kept inside who do not want to be there and the other group who are there to make sure they stay in will be an organization under stress.
Investigative reporter Shane Bauer described corrections work in a similar way. In 2016, Bauer (who was previously incarcerated for two years in an Iranian prison), spent four months undercover as a CO in Winn Correctional Center, a private state prison in Louisiana. He later said of corrections officers, in his experience:
Most of them, when they go in, they want to treat prisoners well. But then you have to face the fact that you’re doing something that is not really within your normal realm of what it means to be a decent human being.
Multiple papers have noted that certain stressors are built into the corrections model, and are sometimes called “occupational” or “work-related.” As the author of an expansive 2013 literature review on wellness and safety among COs explains, much of the job of a correctional officer is boring and repetitive, yet the constant risk of violence and other incidents requires “hyper-vigilance, boundary setting and self-control. The constant state of alertness can be taxing both physically and psychologically.”
“We put on our armour. When you walk through the first gate, it clicks. And so does your back,” another former correctional officer from Oregon told the Guardian. He compared the job to being in a pressure cooker.
On top of the inherently stressful work environment, corrections jobs do not tend to open the door to desirable work in other industries. While former COs may go on to work in law enforcement or private security, these career paths are two of just three identified by the BJS as having higher exposure to workplace violence than corrections. Low wages are also often cited as a drawback of the job.
According to one Canadian corrections officer, who responded to a survey’s open-ended question about the job:
Corrections are a very mentally and physically demanding career that is very difficult to understand. Being keepers of people has demands that should not be misunderstood. This career is a meat grinder.
And in a white paper on correctional wellness titled “I Am Not Okay,” published by One Voice, the authors (who are correctional officers) described the reasons people go into corrections:
During childhood, kids regularly invent games where they imagine what they will be when they grow up. Many pretend to be police officers, nurses, doctors, lawyers, firefighters, or teachers. How many kids in the neighborhood grew up locking their friends in the basement because they wanted to be a correctional officer? How many seniors in the high school yearbook listed “correctional officer” as a career aspiration? Almost no one does that. No one wants to go to prison, even if they have the keys…
Some choose this path because they see it as an opportunity to help people “correct” their wrongdoings and come out better, but those for whom this was their motivation quickly find out that it’s not really an option, because the current system was not designed with this in mind.
But the correctional work environment is worse than it has to be
While some stressors of the job are inherent to the nature of locking people up, others stem from the way prisons are run in the United States. Sometimes called “organizational” or “institution-related” stressors, they contribute to stress and burnout, and can include:
Low autonomy/ no input into decision making
Unpredictable shift work
Overtime demands
Lack of support from or trust in supervisory staff
Inadequate benefits and resources
Inadequate training
Other significant “institution-related” stressors are role conflict and role ambiguity. Role conflict reflects fluctuating expectations over whether prisons are for punishment or rehabilitation. Role ambiguity is the uncertainty created when supervisors instruct COs to go “by the book,” even though it is clear to everyone that the role requires flexibility — and that the culture surrounding prison work encourages staff to carry out violent, informal sanctions that aren’t in any rulebook. As one paper described role ambiguity:
While officers work in a paramilitary organization marked by explicit lines of authority and a host of formal regulations, their task of managing inmates demands flexibility, the judicious application of discretionary justice, and the ability to secure inmate compliance through informal exchanges which deviate from written rules… Ambiguous and conflicting expectations are a likely result and a potential source of stress.
What’s more, negative experiences in prison may be exacerbated by the machismo culture in corrections. The 2013 literature review notes that, “like police officers, COs have subcultural taboos regarding the acknowledgement of a need for medical or psychological assistance, as such admissions are perceived as a sign of weakness.”
Bringing the problems home
Many correctional officers struggle to leave the job behind at the end of a shift, which is described by psychologists as “dual role conflict.” People often bring home the violence, hypervigilance, and command culture they experience all day, importing violence into their homes and communities. As the 2013 literature review explains:
It can be difficult for a CO to override innate and acquired characteristics that are considered functional and professional in the workplace, but are not effective at home or in their personal lives… For example, conflict can occur at home when excessive job stress causes a CO to displace frustration onto spouses and children, ordering family members in the same way he or she issues commands to inmates.
The review further notes that family conflict can be exacerbated by other features of the job, such as “cynicism, pessimism, sarcasm, flattened drama/stress response, and exposure to trauma and other disturbing behaviors.” All of this can lead to withdrawal and isolation at home.
A 2021 study of 156 correctional supervisors found correlations between exposure to traumatic incidents on the job and work-family conflict. And a 2013 paper included first-person accounts from Canadian correctional officers describing the effects the job has on them. As one CO explained it:
Prison staff learn to apply a thin layer of ‘Machismo’ as a result of each incident they respond to. It’s like a Band-Aid… It covers and seals in your emotions and your feelings; otherwise you’re weak, a punk, or a sissy… The only problem is the Band-Aids don’t come off after work. They stay on. So you live your life and miss all the beauty and the real experiences because you are a heartless, emotionally numb, and desensitized a__. You see an awful car accident with injuries, big deal. You have a friend that gets hurt really bad, big deal. Your family member dies in his fifties and you truly love the man, big deal. An inmate gets stabbed 47 times, big deal. You get mad because your kid wrecks his bike and cries because he skinned up his knees, big deal. Tell him to man-up and quit being a baby and walk away.
It is getting in my blood… When I drive home, I wonder who I am becoming. I feel ashamed of my lack of self-control, my growing thirst for punishment and vengeance. I’m getting afraid of the expanding distance between the person I am at home and the one behind the wire. My glass of wine with dinner regularly becomes three. I hear the sounds of Ash unit as I fall asleep. I dream of monsters and men behind bars.
This can lead to dire outcomes. A 2011 study found that work-family conflict can contribute to depression among COs. And in a 2012 survey of 710 correctional officers in Florida, 33% reported they had heard of at least one correctional officer who committed unreported domestic violence.
Nurses, teachers, and other corrections workers face similar challenges
Although there is little research into the experiences of correctional nurses, teachers, and case managers, the little we know suggests that COs are not the only ones experiencing stress and trauma.
A 2019 exploratory study from the United Kingdom found that 57% of participating correctional mental health nurses had listened to people express thoughts of suicide and self-harm more than 30 times. Most had witnessed self-harm or attempted suicide.
Repeated exposure to this type of trauma can build up, just as it can for COs. “Vicarious” or “secondary” trauma can occur in people who are exposed to disturbing images and stories second-hand, and can have similar symptoms to PTSD. A 2019 study from Australia found that 87% of participating health staff at correctional centers experience high or moderate levels of vicarious trauma. Similarly, a 2011 study of educators in youth facilities found that 81% met at least one, 55% met two, and 39% met all three core diagnostic criteria for PTSD.
A 2006 study of workers in two unnamed midwestern prisons found even higher rates of burnout among case workers than correctional officers. And while little research exists on the physical health impact of this work, a study of correctional nurses found that 56% had short sleep duration and 32% had poor sleep quality.
Communities and counties should not seek new prisons and jails as job boosters
The overwhelming evidence shows that correctional work is stressful and traumatic. But for decades, rural communities throughout the country were persuaded to compete for prison contracts, and are now stuck with these jobs.
Not only are individual prison jobs difficult, but prisons as a whole have failed to revitalize the towns where they are built. In a 2002 report, Tracy Huling concluded that “increasing evidence suggests that by many measures prisons do not produce economic growth for local economies and can, over the long term, have detrimental effects on the social fabric and environment of rural communities.”
First, Huling noted that prisons often don’t hire locals. She cited Ruth Wilson Gilmore’s Golden Gulag, which includes a study of prison towns in California that showed that, on average, less than 20% of jobs in new state prisons went to current residents of the local town. Looking specifically at Corcoran, Calif., which housed two prisons, Gilmore further found that just 40% of the people working at those prisons lived within a 75 mile radius of the town. This happens in part because prison systems tend to promote from within.
Prisons can have other negative effects on a town’s economy. Citing work by economist Thomas Johnson, Huling noted that they generate few “linkages to the economy.” Unlike an auto plant, which might lead to the creation of new delivery companies, radio assemblers, and electronic harness makers, prisons do not attract new, related industries to the area. What’s more, prisons tend to attract chain stores, creating a “replacement” effect where locally-owned businesses lose out to the incoming McDonalds and Walmarts. Prison labor carried out by incarcerated people for the municipality or for private industry — which is already exploitative — can also displace local workers.
Too late, communities may find that, with all the small businesses gone, they have become dependent on their prisons — meaning that when states occasionally shutter prisons today, the news can be met with disappointment and fear.
“The 1990’s location of prisons in rural areas was based on a high dose of economic development hype and the hopes and expectations of local elected representatives, business and community leaders who believed state prisons were a ‘gold plated’ solution to their economic problems… Once more comprehensive and rigorous impact studies did emerge, they demonstrated that many of the apparent benefits of rural prison location for local communities were invalid.”
A 2010 study lead authored by Gregory Hooks similarly found that prison construction“impedes economic growth in rural counties.” Three Kentucky counties remain among the poorest in the nation after becoming home to federal prisons. And in 2016, an analysis of 25 years of prison building in Appalachia found “little evidence to support the claim that prisons are engines of growth,” and warned: “policymakers would be well served using great caution before pursuing this development pathway.”
Today, the prison-building boom has slowed, and county jails have become the new frontier of carceral expansion. From 2013 to 2019, jail populations grew 27% in rural areas and 7% in small-to-midsize cities, prompting many counties to build newer and bigger jails. In some states, this growth is accelerated by policies in which the state departments of corrections pay counties a per diem to house people serving state sentences. In Kentucky, for example, “at the same time that coal revenues dried up, the state’s criminal justice policies subsidized and incentivized the expansion of carceral capacity at the county level,” explain Jack Norton and Judah Schept. But, like the prison boom jobs before them, jobs in these new, expanded jails should not be desirable to individual workers or communities.
Prisons bring trauma into communities — for the people locked up in them, of course, but for those employed there as well. There are other ways to create better, safer jobs for people in rural communities. In particular, states have the power to create different kinds of jobs — such as jobs in mental health services, youth programming, or health care — that simultaneously help others stay out of jail and prison in the first place.
Footnotes
Recently, the Montana DOC reported it has a three-year statewide corrections turnover rate of 23%. In South Dakota prisons, 28% of officers left their jobs in FY2020. Two Virginia prisons had turnover rates of 54% and 46% in 2021. Across Georgia’s youth facilities, 90% of entry-level officers left the jobs within their first year in FY 2021; this actually marked an improvement from 97% the year before. And in Colorado, two private prisons recently reported staff turnover rates of 126% and 107% in 2021, meaning that the number of people who quit over the course of the year was higher than the average number of COs employed there. ↩
In recent years, many states have resorted to lowering the eligibility requirements for COs. Arizona shortened hiring timelines by no longer checking candidate references. In 2018, Michigan started allowing COs to complete the required 15 hours of college credits after starting the job. In 2019, Florida lowered the age of eligibility from 19 to 18, and the Oklahoma Department of Corrections recently asked the legislature to lower it from 20 to 18. This isn’t a new idea either: When Kansas lowered the age of eligibility from 21 to 19 in 2001, the New York Times announced, “Desperate for Prison Guards, Some States Even Rob Cradles.” ↩
Articles about correctional work sometimes cite a statistic that COs have an average life expectancy of just 59 years — 16 years below the national average. But as Politifact breaks down succinctly (in response to a Rhode Island corrections union president who made a similar assertion), the evidence does not support this claim. ↩
In a finding somewhat similar to the BJS estimate of 33 per 1,000 COs experiencing workplace violence, an analysis of 2011 incidents found 254 work-related injuries per 10,000 full-time corrections employees as the result of assaults and violent acts, or a rate of 25.4 per 1,000 COs. A much lower rate was reported in a 2011 analysis of assaults coded as “serious” by the Texas Department of Criminal Justice: 284 per 100,000 staff members, or a rate of just 2.84 per 1,000 COs. (The paper notes, however, that only a small percentage of total assaults on staff were marked as “serious.”) ↩
Two additional professions in the BJS study also reported higher rates of workplace violence than correctional officers, but had very small sample sizes: mental health custodial care workers, and teachers at technical and industrial schools. ↩
COs may perceive their risks of physical violence and illness as even higher than they are, which can contribute to stress and take a mental toll. A 2017 literature review found eight studies that looked at correctional officers’ perceptions of workplace safety and wellness. One of the studies, from 2005, found that over 92% believed they were at risk of contracting either HIV/AIDS or Hepatitis B or C. Another survey, from 2013, revealed that 78% of CO respondents were at least “somewhat afraid” of victimization by incarcerated people. And a 2014 study asked COs to assess their risk of injury from six different workplace dangers (such as gangs and contraband); the majority of the sample perceived a high risk from each danger. What’s more, COs who had been on the job longer were more likely to perceive a risk of injury. ↩
Incarcerated people face an extremely elevated risk of violence at the hands of staff and other incarcerated people. A 2009 study found that 35% of incarcerated men experienced physical victimization and 10% experienced sexual victimization behind bars; among women, the rates were 24% and 25% respectively. ↩
This Mother’s Day — as the COVID-19 pandemic continues to put people behind bars at risk — nearly 150,000 incarcerated mothers will spend the day apart from their children.1Over half (58%) of all women in U.S. prisons are mothers, as are 80% of women in jails, including many who are incarcerated awaiting trial simply because they can’t afford bail.
How up-to-date are these numbers?
These estimates are based on a typical, pre-pandemic year. And 2020, the most recent year with data, was anything but “typical”…
To be clear, these estimates are based on the most recent numbers we have that represent a “typical” year. Of course, very little has been “typical” since the pandemic began, so we rely on pre-pandemic data from 2019 for our estimates. The most recent national government data, from 2020, show dramatic changes in incarceration from previous years, but other data sources we’ve monitored throughout the pandemic indicate that jail populations have largely rebounded since then, and many state prison populations have also started to tick back up. Since nationally representative 2021 data will not be published by the Bureau of Justice Statistics until later in 2022, we use 2019 data to provide the most recent picture of incarceration in a “typical” pre-pandemic year.
Most of these women are incarcerated for drug and property offenses, often stemming from poverty and/or substance use disorders. Most are also the primary caretakers of their children, meaning that punishing them with incarceration tears their children away from a vital source of support. And these numbers don’t cover the many women preparing to become mothers while locked up this year: An estimated 58,000 people every year are pregnant when they enter local jails or prisons.2
150,000 mothers separated from their children this Mother’s Day is atrocious in and of itself – but that’s just one day. How many people in the U.S. have experienced separation from their mothers due to incarceration over the years? Unfortunately, these specific data are not collected, but we calculated some rough estimates based on other research to attempt to answer this question:3
Roughly 570,000 women living in the U.S. had ever been separated from their minor children by a period of imprisonment as of 2010.
An estimated 1.3 million people living in the U.S. had been separated from their mothers before their 18th birthdays due to their mothers’ imprisonment, also as of 2010.4
The scale of maternal incarceration – and its related harms – is monumental. But to be clear, these are estimates of how many children there were among the roughly 1 million women alive in 2010 who had ever been to prison, and only includes children who were minors when their mothers were in prison. These estimates are therefore very conservative, as they do not include the many, many more women who have ever been booked into a local jail.
Most incarcerated mothers are locked up in local jails
80% of the women who will go to jail this year are mothers — including 55,000 women who are pregnant when they are admitted. Beyond having to leave their children in someone else’s care, these women will be impacted by the brutal side effects of going to jail: Aggravation of mental health problems, a greater risk of suicide, and a much higher likelihood of ending up homeless or deprived of essential financial benefits.
How incarceration — and life after incarceration — hurts mothers and their children
Women who are pregnant when they are locked up have to contend with a healthcare system that frequently neglects and abuses patients. In a 50-state survey of state prison systems’ healthcare policies, we found that many states fail to meet even basic standards of care for expectant mothers, like providing screening and treatment for high-risk pregnancies. In local jails, where tens of thousands of pregnant women will spend time this year, healthcare is often even worse (across the board) than in state or federal prisons.
More challenges await incarcerated mothers and pregnant women when they are released from jail or prison. Formerly incarcerated women experience extremely high rates of food insecurity, according to a 2019 study. And as we previously reported, the 1.9 million women released from prisons and jails every year have high rates of poverty, unemployment, and homelessness, confirming what many advocates already knew: that there is a shortage of agencies and organizations able and willing to help formerly incarcerated women restart their lives.
It’s time we recognized that when we put women in jail, we inflict potentially irreparable damage to their families. Most women who are incarcerated would be better served though alternatives in their communities.
So would their kids. Keeping parents out of jail and prison is critical to protect children from the known harms of parental incarceration, including:
Traumatic loss marked with feelings of social stigma and shame and trauma-related stress
More mental and physical health problems later in life
Incarceration punishes more than just individuals; entire families suffer the effects long after a sentence ends. Mother’s Day reminds us again that people behind bars are not nameless “offenders,” but beloved family members and friends whose presence — and absence — matters.
Footnotes
Based on the most recent (2016) Survey of Prison Inmates, the Bureau of Justice Statistics (BJS) estimates 57,700 women in state and federal prisons are parents of minor children. We calculated approximately 55,142 mothers of minor children in local jails based on the Vera Institute of Justice report’s estimate that 80% of women in jail are mothers, and the BJS estimate of 110,500 women in local jails at mid-year 2019 (80% of 110,500 is 88,400). While jail populations dropped quite dramatically in the early months of the COVID-19 pandemic, we opted to use the more typical 2019 jail population for our estimate because other data sources show that jail populations have largely rebounded since mid-2020, but national 2021 data from BJS are not yet available. ↩
These estimates are based on the following percentages, reported in the linked sources: 4% of women admitted to state and federal prisons annually, and 3% of women admitted to local jails, are pregnant at the time of admission. The estimated 55,000 women admitted to jails while pregnant each year is based on the number of women over age 18 arrested in 2017 (over 1.7 million women), as reported in the original source. The estimated number of pregnant women admitted to state and federal prisons in a year is based on the total number of female admissions in 2019 (73,586) as reported by the Bureau of Justice Statistics CSAT — Prisoners tool (4% of 73,586 is 2,943.) While prison populations – especially admissions – dropped quite dramatically in 2020 due to the COVID-19 pandemic, we chose to use the more typical 2019 prison data because other sources show that prison populations have since started to tick back up, but national 2021 data are not yet available. In contrast to the annual admission numbers, the share of women in prison who are pregnant on any given day (the “one-day prevalence” of pregnancy) was 0.6% in prisons and 3.5% in local jails as of the end of 2016. ↩
Both of these estimates are based on Shannon, et al.’ s estimates of the number of living U.S. residents who have been in prison at some point, as of 2010. We combine their findings with the most recent data from the Bureau of Justice Statistics about parents in prison and their children. But to do so, we have to make some assumptions – namely, that the percentage of women in prison who are mothers of minor children has remained more or less constant over the years, and that the average number of minor children per woman in prison has also remained constant over the years. To see how much these measures have changed over time, we reviewed Bureau of Justice Statistics reports about parents in prison and their children dating back to 1991, and found that between 1991 and 2016, the percentage of women prison who are mothers of minor children fell from 67% to 58% in state prisons and from 61% to 58% in federal prisons. At the same time, the average number of minor children per incarcerated mother has increased slightly from about 2.16 children in 1991 to 2.28 in 2016. These changes over time are not dramatic, but our resulting estimates should still be viewed as very rough estimates. ↩
Here’s the math behind our estimates: Shannon, et al. (2017) estimated 7,304,910 (or 3.11%) adults alive in the U.S. in 2010 had ever been in prison or on parole (whether still in prison or after release). They also estimated that 5.55% of the adult male population in 2010 had ever been in prison or on parole (they did not publish an estimated percentage of the adult female population that had been imprisoned). Based on Census data, we calculated an estimated 6,317,909 living adult males who had ever been in prison as of 2010 from that percentage. We then subtracted the number of adult males who had ever been in prison from the total number of adults who had ever been in prison; the difference – about 987,000 – is the number of adult women who had ever been in prison. Then, we took 57.7% of that total (0.577 * 987,000) to estimate that 569,500 (or roughly 570,000) of those women had been mothers of minor children while incarcerated (in 2016, 57.7% of women in prison had minor children). Finally, to estimate the number of people in 2010 who were minor children when their mothers were in prison, we multiplied the average number of minor children per woman with minor children in prison in 2016, 2.28 children, by our estimate of the number of women alive in 2010 who had been incarcerated when they had minor children (569,500) – 1,301,182 people. ↩
We examined release card companies’ fee structures to learn how this industry has evolved, and what government leaders can do to stop its worst practices.
Every year, roughly 5 million people are released from jail and another half million leave prison. But just because they are released from physical custody doesn’t mean that they are free of the financial exploitation resulting from that experience.
When a person leaves a correctional facility, they often receive their funds — wages earned while behind bars, support from family members, or money the person had in their possession when arrested — on fee-laden prepaid debit cards. As we explain below, there are several ways (six, to be precise) to get money off of a release card, but they are expensive, difficult, or both.
We first put a spotlight on these “release cards” in 2015, when they came on the scene as one of the newer ventures from companies that have traditionally profited by charging incarcerated people and their families exorbitant rates for phone calls, money transfers, or other technological services. While release cards were novel in 2015, they are now ubiquitous. Since then, the Consumer Financial Protection Bureau (CFPB) has reined in some of the industry’s worst practices and cracked down on one of the biggest players in the industry, but these companies continue to line their pockets at the expense of low-income individuals who are trying to navigate the reentry process. As the CFPB’s director recently noted, some release-card companies have made a practice of “siphoning off…people’s own hard-earned money” through abusive practices that sometimes violate federal law.
To better understand how these companies continue to unfairly extract money from consumers — and more importantly, what can be done to stop them — we analyzed the most recent fee disclosures that release-card companies filed with the CFPB. The data (which are summarized in the appendix1) paint a picture of a complex obstacle course, riddled with pitfalls that deprive formerly incarcerated people of the modest amount of money they have when they are released.
The six ways release-card companies grab people’s money
When someone is given a release card on their way out of a prison or jail, they have up to six ways to use its value, but each option entails different challenges, and most involve fees.
Option #1: Opt out (but the clock starts ticking at the moment of release)
The first way someone can get their money off of a release card is by exercising their right to “opt out” and get a refund.
While this may sound easy, it will come as no surprise that release-card companies make it difficult (or nearly impossible) for recently released people to exercise their opt-out rights. Cardholders face four primary hurdles:
First, the cardholder must act quickly. They have to notify the company they want a refund within an arbitrary “grace period” to avoid being hit with maintenance fees. These grace periods are generally between two and thirty days, creating an unnecessary obstacle at a time when the cardholder is trying to secure housing and employment, and (if on parole) comply with terms of supervised release.2
Second, opting out generally requires that the cardholder call customer service or make a web-based request to close the account. The problem here is that people recently released from custody frequently lack reliable phone or internet service.
Third, the cardholder cannot use the card for even a single transaction, effectively freezing their money at a time when they need it most.
Finally, refunds are generally sent via a mailed check, even though recently released people are likely to need time to establish a mailing address and are unlikely to be able to wait for the time required under the U.S. Postal Service’s degraded delivery standards.
A full breakdown of fees charged by each card type is available in the appendix.
If someone receives a release card that charges a periodic maintenance fee and they do not close their account within the grace period, then the maintenance fees will be deducted from their card balance every week or month. Almost three-quarters of the release-cards we reviewed charge “account maintenance” fees.
Option #2: Close the account after the opt-out period has expired
After the grace period has expired, a cardholder can request that the account be closed and receive a refund via mailed check. Seventeen release cards (all managed by Numi Financial) charge a steep $9.95 fee for this service, meaning anyone with a balance of less than $10 can’t take advantage of this option. Someone with a $50 balance can use this option, but effectively has to pay a fee of 20% for a very simple transaction.
Option #3: Transfer the money to a bank account (if you have one)
Some cardholders can transfer their balance to a bank account. Two of the three dominant release card brands (Access Corrections and Numi) appear to allow cardholders to transfer their funds to a bank account without paying a fee.3 However, the companies do not provide much detail about how to do this, beyond referring consumers to the program manager’s website. While this may be useful for cardholders with bank accounts, most people being released from long terms of incarceration don’t have bank accounts, effectively eliminating this option for them.
Option #4: Use the card to make purchases
Holders of release cards can use their balances to make in-store or online purchases. This only works if the business in question accepts Mastercard. While many retailers do, some important businesses (like landlords) do not.
But even if a cardholder wants to use the card at a Mastercard-accepting business, simply using the card for purchases can subject them to a whole new series of fees. Some cards charge users for each purchase (seven cards levy such fees, averaging 71¢ per transaction). These fees are hard to justify because card companies are already compensated for the cost of processing transactions through interchange fees paid by merchants.4
Half of the cards we examined charge fees for declined transactions, with an average fee of 62¢. These fees are even more difficult to justify because it doesn’t appear that card issuers incur any expense when a purchase request is declined. These fees seem to be nothing more than corporate enrichment at the expense of consumers who are least able to absorb these costs.
Finally, don’t forget that for cards with periodic maintenance fees, the longer it takes the consumer to spend down their balance, the more they will pay in weekly or monthly maintenance fees.
Option #5: Get cash at an ATM
Getting cash from an ATM also presents its own challenges and fees.
Some card companies offer a network of ATMs where customers can withdraw their money for free, or a relatively low fee. However, if the cardholder uses an ATM outside of this network, they’re likely to be hit with fees by both the card issuer and the bank that operates the ATM. Twenty-nine release cards (60% of our data set) impose fees for ATM withdrawals — with an average fee of $2.58 per transaction. Sometimes these fees apply only to out-of-network ATMs, but some cards charge the fee for all ATM transactions.
Finally, twenty-four cards impose a fee for declined ATM transactions (with an average fee of 62¢). To avoid a declined-ATM-withdraw fee, a cardholder may want to check their available balance, but doing that at an ATM carries a fee — ranging from 50¢ to $1.50 — on thirty-seven release cards (77% of the data set).
A full breakdown of fees charged by each card type is available in the appendix.
Option #6: Withdraw cash at a bank
Over-the-counter withdrawals appear to often be fee-free, but figuring out how to use this option can be nearly impossible. For example, the cardholder agreement for Axiom Bank’s release cards (branded as Access Corrections cards) states that cardholders must perform over-the-counter withdrawals at a “MasterCard principal financial institution,” but neither Axiom or Mastercard itself provides information on how to determine which bank branches fall within this category. Similarly, Central Bank of Kansas City (a partner with Numi Financial) also fails to inform customers where they can make over-the-counter withdrawals, but cardholder materials do warn that banks offering this service may impose their own fees.
Making release cards work for recently released people
All too often, correctional facilities use release cards without giving any thought to the experience of the person being released from custody. For a short stint in jail — a few days or hours — simply returning a person’s cash to them upon release is almost always the best option. If someone spends a longer time in custody, though, and accumulates a balance in their “trust account,” a prepaid debit card may be a convenient way to give someone their money, especially if there are few (or no) fees and cardholders have free and easy-to-use options to transfer the balance or turn it into cash.
The real problem here isn’t release cards themselves; it’s the abusive fees and practices that are common in the industry today.
Correctional agencies can take steps to end some of the most outrageous release-card practices. For example, we identified one release card in the CFPB database that stands out in a good way: the Comerica Bank card used by the North Dakota Department of Corrections. This card has relatively few fees compared to other companies: just an inactivity fee of $2/month that kicks in if the card hasn’t been used for twelve consecutive months, a $10 fee for expedited replacement of a lost card via overnight mail (a replacement card via first-class mail is free), and a few ATM fees.5 It’s also the only card we reviewed that doesn’t include a mandatory arbitration provision. How did such a small prison system get such a good deal? Because the North Dakota Department of Corrections joined with other state agencies that use prepaid debit cards (for payments like unemployment benefits) to negotiate a group contract with decent consumer protections. It’s a practice more states can and should adopt.
State legislatures can also crack down on bad release-card deals. We’ve drafted simple model legislation that prevents most of the worst practices in the industry.
Finally, the federal government has a role to play in making these cards work better for consumers. The CFPB is currently looking at “junk fees” charged in connection with consumer financial products. These are fees that don’t serve any real purpose other than to pad the bottom lines of the companies that charge them. We filed comments asking the CFPB to finish the work it started when it fined JPay last year. We encouraged the agency to crack down on some of the worst practices across the release card industry, in addition to addressing the equally abusive fees charged for money transfers to incarcerated people.
Release cards shouldn’t be a tool for taking money from those who can least afford it. Prison and jail officials, along with state and federal leaders, have a responsibility to ensure the little bit of money that recently released people have is not quickly drained by hidden or inescapable fees. States and counties should follow the lead of North Dakota by leveraging their power to negotiate a contract that minimizes fees; state legislatures should prohibit the industry’s worst practices; and the CFPB should continue to police companies in this sector.
Appendix
Disclosure concerning JPay data: With one exception, JPay has not uploaded long-form fee disclosures, thus, it is impossible to know the full range of fees. In addition, many of the fees JPay used to charge are now prohibited under the terms of the consent order entered in Admin. Proc. 2021-CFPB-0006. This table includes any fees listed in JPay’s short-form disclosures, even though this information is likely out of date. If information in the CFPB database clearly establishes that a particular fee is not charged for a JPay release card, that fee is denoted as “–“; otherwise, if a fee could possibly be listed on the (unfiled) long-form disclosure, it is denoted as “Unknown”. JPay’s entries in the CFPB database also consistently fail to list the correctional agencies where any given card is used. When the database includes older (superseded) account agreements that do identify correctional agencies where cards were issued, we have listed those agencies here.
It appears the data JPay filed with the CFPB may be out of date. Last year, the company signed a consent order with the CFPB banning it from charging most fees, however it has not updated its filings with the Bureau. For this analysis, we’ve used the most recent filings from the company, even though they are likely out of date, because they reflect the state of the market prior to the enforcement action, and where the market may return upon the expiration of the consent order in 2026. ↩
Not only are grace periods arbitrary, but they likely have a more troublesome purpose, as we explain in our recent filing with the CFPB. Consumer-rights activists have had a fairly good track record suing release-card companies for various legal violations. The companies try to keep these suits out of court by relying on the arbitration provisions in the fine-print terms of service, but most courts that have confronted these disputes have held the arbitration provisions unenforceable because cardholders do not voluntarily agree to them. Grace periods are likely an industry strategy to defeat future litigation: by offering someone a few days to opt out of using a card, the company can then argue that anyone who doesn’t opt out has “voluntarily” agreed to all the terms and conditions buried in the card’s fine print. ↩
We assume the third company, JPay, doesn’t charge a fee to transfer money to a bank account under the terms of the CFPB consent order. However, as explained in footnote 1, we can’t be certain of this because the company has not updated its filings with the CFPB. ↩
Mastercard rules specify that costs of operating the network are to be borne by the financial institutions that are members of the Mastercard network. Thus, collecting fee revenue from cardholders for processing purchase transactions looks like a form of double recovery. See Mastercard Rules S 3.4 (Dec. 7, 2021). ↩
There is a $1.25 for out-of-network ATM withdrawals, but cardholders get two free out-of-network withdrawals each month. There are also fees for ATM transactions outside the U.S, which is fairly common across most prepaid cards. Even with these fees, when examined as a whole and compared to other release cards being used, the North Dakota fee structure seems fairly good. ↩
On Earth Day, many people contemplate past and future demands for clean air, clean water, and protected landscapes. But society’s calls for a healthier environment rarely extend to incarcerated people, many of whom are confined in toxic detention facilities. We recap some aspects of how prisons leave both people and planet worse off.
No one is spared from reckoning with human-induced environmental change, like pollution from industrial emitters and increasingly severe natural disasters. Yet in correctional facilities, incarcerated people have no agency over almost any aspect of their lives, including their exposure to harmful and even potentially lethal conditions. Prisons fail to provide a basic standard of livability, while climate change and extreme weather test the ability of prison administrations to carry out contingency plans for the hundreds of thousands of people in their care. The ways in which environmental hazard and risk maps onto other unsafe conditions of confinement amounts to a human rights crisis that has persisted for decades.
Prisons are sited on uninhabitable, toxic wastelands
The rural geography of many of our nation’s prisons isn’t just unfortunate for those having to travel far from home to visit; prisons are too often built near (or directly on) abandoned industrial sites, places deemed fit only for dumping toxic materials. One-third (32%) of state and federal prisons are located within 3 miles of federal Superfund sites, the most serious contaminated places requiring extensive cleanup. Research warns against living, working, or going to school near Superfund sites, as this proximity is linked to lower life expectancy and a litany of terribleillnesses.
As a result of being on or near wastelands, prisons constantly expose those inside to serious environmental hazards, from tainted water to harmful air pollutants. These conditions manifest in health conditions and deaths that are unmistakably linked to those hazards.
In western Pennsylvania, for example, a state prison located on top of a coal waste deposit has done permanent damage, causing skin rashes, sores, cysts, gastrointestinal problems, and cancer, with symptoms often appearing soon after arrival. A scathing report from 2014 exposed these patterns of illness and neglect, but the prison — SCI Fayette — remains open.
And the devastating health outcomes at one prison in Louisiana was a smoking gun for environmental injustice — or a smoking tire, in this case. Laborde Correctional Center‘s neighbor, an abandoned tire landfill, caught fire and burnedfor four days before the prison decided to evacuate. The state’s environmental agency and the tire company are on the hook for failing to address compliance issues, but the damage had already been done to the health of the people trapped inside the prison’s walls.
Indeed, no region is more of a poster child for harmful prison siting than Appalachia, where new prisons have served as a failed economic replacement for the waning coal industry. For example, devastating mining and mountaintop removal activity in Kentucky has left residents — and now, many incarcerated people — with high rates of cancer and warnings against drinking or bathing in the tap water. With these day-to-day health hazards in mind, the promise of stable prison jobs and related economic development in Appalachia is hampered by its appalling environmental legacy.
This is not just a rural phenomenon. The Rikers jail complex in New York City is sited squarely on a landfill, making it a particularly cruel metaphor; the leaching of toxic fumes from poorly decomposing trash has caused anguish to the point where correctional officers have sued the city. It’s clear that those who set out to build these prisons care no more about the people inside than they do about garbage.
Bad water and bad air: Incarcerated people are forced to drink and breathe contaminants
Whether the result of terrible prison siting or run-down infrastructure, poor water quality plagues prisons nationwide, but little has been done. At one of the older state prisons in Massachusetts, incarcerated people fear for their health because their water has been “dark in color,” bad-smelling, and clogging filters with sediment for years. Testing showed dangerous levels of manganese, which can lead to neurological disorders. Meanwhile, a Texas facility was providing water with elevated levels of arsenic for ten years before the courts got involved, and an Arizona prison’s water, smelling foul and causing rashes, tested positive for a “petroleum product.” The list truly goes on and on, with a wide range of toxic substances swirling around the water supply of prisons.1
In addition to heavy metal and oil, water with unacceptable levels of bacteria has caused outbreaks of Legionnaires’ disease — a potentially fatal type of pneumonia — at prisons in California, Illinois, New York and other states. Not only are prison administrations hesitant to replace the aging, corroded pipes that may have contributed to this horrendous bacterial growth, but staff enjoy free bottled water or bring in their own to avoid illness, leaving incarcerated people’s concerns largely unheard and unaddressed.
In the 1970s and 80s, the U.S. government took a firm stance against radon, an invisible, odorless gas known to cause lung cancer in indoor environments, launching an all-out eradication initiative in homes across the country. Yet in prisons, testing for and mitigation of radon has not been a priority. In 2018, a court found that a Connecticut prison was “knowingly and recklessly” exposing its incarcerated population to alarming levels of radon,2 in violation of the Constitutional right to an environment free from toxic substances.3 Incarcerated people have the right to clean air and water no less than anyone else, yet these and other basic necessities are routinely denied to them.
Over 1 million people are locked up in prisons, environments almost guaranteed to make them sick, while medical copays in many prisons only disincentivize treatment, making illness worse and in some cases more likely to spread.4 Often, correctional staff are also exposed to dangerous levels of pollutants, and concerns about health and safety are ignored by prison officials. This glaring cruelty of confinement makes it hard to believe that these “correctional” facilities make anyone better off.
Eleven miles of sewers: New prison and jail construction threatens human and environmental health
The plan to build a new jail in Otsego County, Michigan, would have been on an undeveloped site. According to a a public document from 2016 (top), the site had contaminated soils that would have required extensive clean-up before any digging and construction could take place. That fact was conveniently ignored by Otsego County public safety officials, who made an assumption of “no hazardous materials mitigation,” in their 2020 feasibility study (bottom) , creating the illusion of an environmentally and financially viable location.
Over the years, we’ve offered several reasons not to build or expand prisons and jails, but siting new correctional facilities brings up questions of ecological and health impacts. For example, when residents of Otsego County, Michigan voted against building a new county jail in late 2021, they prevented more than just a fiscally wasteful campaign to over-incarcerate people. The budget in the county and engineering firm’s feasibility study made an assumption that the site would require “no hazardous material mitigation,” even though government documents from four years prior declared the very same site to “contain hazardous substances,” in this case petroleum. Either the proposed “justice complex” would have required millions of dollars in soil remediation, or the damning document could have been rescinded or even ignored, allowing the county to do what too many other jurisdictions have done — knowingly incarcerate people on toxic land.
And next to Great Salt Lake in Utah, a massive new prison is under construction, despite great concern about its decidedly bad location and environmental impact. An engineering industry magazine even admitted it: The forthcoming Utah State Prison and its outbuildings, sited on a “remote wetland area” in a “sensitive environment,” is more like “a small city [of] 7,000 people,” more than half of those incarcerated. The city-sized project, requiring six miles of new roads and 11 miles of new sewer lines, is built upon soils that are known to “liquefy” when rattled by an earthquake (which would not be unusual, as this region sits upon on a network of geological fault lines). Plus, the new facility is located next to a closed, unregulated landfill; how long will it be before the untreated medical issues in Utah’s prisons are exacerbated by toxic landfill fumes?
Prisons refuse to respond to climate change-related emergencies
With their unwillingness to prepare for disasters due to global climate change, prisons (and other parts of the criminal legal system) stand to endanger or delay justice for people charged with a crime. For example, when Hurricane Harvey tore through the greater Houston area in Texas in 2017, several thousand incarcerated people were evacuated, but just as many were forced to wait out the storm in their facilities, with no plumbing and dwindling supplies. Not far away, Harvey caused flooding that put courtrooms out of commission and forced people detained pretrial to wait in jail longer for their day in court.
And in Louisiana, a state known both for its high incarceration rate and for its vulnerability to storms, hurricanes Katrina and Ida exposed serious shortcomings in disaster planning for its prison and jail populations. Trapped in dilapidated, flooding buildings and cut off from communication with loved ones, incarcerated people in Louisiana were simply left behind when evacuation was ordered for parish residents. In California, where wildfires are the primary environmental threat, evacuation plans are rare and unpracticed; the large populations in many prisons present a logistical nightmare — a disincentive to move incarcerated people out of harm’s way. In the words of Loyola University professor Andrea Armstrong, incarcerated people unwillingly stand “on the front lines of climate change.”
In many regions, scorching temperatures spurred on by global climate change are an active threat to incarcerated people with no access to relief. While the prevalence of air-conditioned homes in U.S. cities has skyrocketed, according to recent Census data, prisons have been slow or downright unwilling to respond to increasingly unbearable conditions, as we found in a 2019 investigation of the hottest parts of the country. Intolerably hot environments are worse for people on certain medications or with medical conditions like diabetes and high blood pressure, which incarcerated people tend to have at higher rates than the general population.
Experts have already warned that climate change will impact the criminal legal system in profound ways beyond adapting correctional facilities to a warming world. An entire generation of climate migrants, people forced to flee where they live due to extreme weather, may ironically become ensnared in the U.S. “crimmigration” system, finding themselves locked up and even more defenseless in the face of disaster. As the climate changes, so must prisons and other confinement facilities — and not in ways that expand the massive footprint of the criminal legal system.
As research overwhelmingly shows, people in prison tend to come from disadvantaged, criminalized communities — the same communities bearing the burdens of environmental injustice. Moving people from the environmental hazards deliberately imposed where they live, to similar or more extreme hazards in prison through the criminal legal system, is an inane practice with enormous moral and fiscal costs. Decarceration efforts (like changing sentencing laws and accelerating compassionate release) will move people out of these death traps back into their home communities, where funding saved can be directed to where it should have gone all along.
Footnotes
Unfortunately, even when corrections officials do appear to take action on poor water quality, it’s likely to fall short of adequate. In a South Carolina jail, incarcerated people were in fact provided with bottled water after a chemical spill contaminated the municipal water supply. But they were given so little water — usually between two and three glasses per person per day — that the population was forced to bathe in and drink the “sweet-tasting,” chemically-tainted water. ↩
True relief still awaits incarcerated people (and correctional officers) suffering from radon exposure in Connecticut prisons, as litigation makes its way through the courts. ↩
Advocates often point to the Eighth Amendment of the Constitution to argue that prison conditions amount to “cruel and unusual punishment,” and numerous lawsuits have made the claim that exposure to environmental toxins fits the same criteria. In 1993, The Supreme Court helped expand the punishment concept to the risk of future harm and the failure of prison administrations to take measures to mitigate such harms, such as from secondhand smoke or asbestos. A lower court, upholding this landmark decision in 2005, insisted that “right to adequate and healthy ventilation” in confinement is clearly established. Despite these apparent wins, people in prison are still on the losing end: Because court cases can drag out for years, and because incarcerated people are systemically denied access to legal proceedings relating to their conditions of confinement, any finding of wrongdoing is too little, too late for many. In fact, the lawsuit at Garner Correctional Institute in Connecticut described here is still unresolved in the courts. ↩
Our roundup and supporting research have largely focused on prisons, but the 760,000 people locked up in local jails, youth and immigrant detention, and other such facilities brings the total confined population closer to 2 million people, and other confinement facilities are no less likely than prisons to be sited in places with similar environmental problems. ↩
People in prisons have endured disadvantage and poverty all the way back to childhood, the Prison Policy Initiative's new report shows.
April 13, 2022
This morning, the Prison Policy Initiative published Beyond the Count, a report that examines the most recent and comprehensive demographic data about people in state prisons and provides a groundbreaking view of the lives of incarcerated people before they were locked up. The report’s findings make clear that solving this country’s mass incarceration crisis will require policy changes that begin outside the prison walls and tackle the inequities and disadvantages incarcerated people face early in their lives.
The report analyzes data from the Bureau of Justice Statistics’ “Survey of Prison Inmates,” collected in 2016 and released in late 2020. The data show what many in the criminal justice reform movement already know: that the U.S. criminal justice system today locks up the least powerful people in society. Key takeaways include:
Many, if not most, people in prison grew up struggling financially. 42% of survey respondents said their family received public assistance before they were 18. Respondents also reported uncommonly high levels of homelessness, foster care, and living in public housing before the age of 18.
Most individuals in state prisons report that their first arrest happened when they were children. 38 percent of the people BJS surveyed reported a first arrest before age 16, and 68% reported a first arrest before age 19. The average survey respondent had been arrested over 9 times in their life.
The typical person in state prison is 39 years old and has a 10th grade education, a fact that is most likely linked to youth confinement, which disrupts a young person’s life and schooling.
Half (49%) of people in state prisons meet the criteria for substance use disorder (SUD), and 65% were using an illicit substance in the immediate lead-up to their incarceration, suggesting that many people who are not locked up for drug offenses are still victims of our country’s choice to criminalize substance use rather than treat it as a health issue.
The Prison Policy Initiative’s report includes more than 20 detailed data tables that allow readers to better understand the people who are in state prisons and the challenges they have faced in their lives. Beyond the Count also includes a section diving into the data on the race, age, gender identity, and sexual orientation of people in state prisons, explaining that a disproportionate number of incarcerated people are racial minorities, very young or very old, or LGBTQ. Many of the key demographic findings in Beyond the Count (such as incarcerated people’s age at first arrest) are also broken down by race or gender.
While the data in this report is about people in state prisons, it does not allow statistics to be broken out for individual states.
“What the data in our new report show is that this country is locking up the same people it has failed by not investing in things like good healthcare, housing, and education for all,” said report author Leah Wang. “What’s worse, the data show that most disadvantaged people’s encounters with the justice system begin during childhood, when they are arrested rather than given the care and attention they need as young people.”


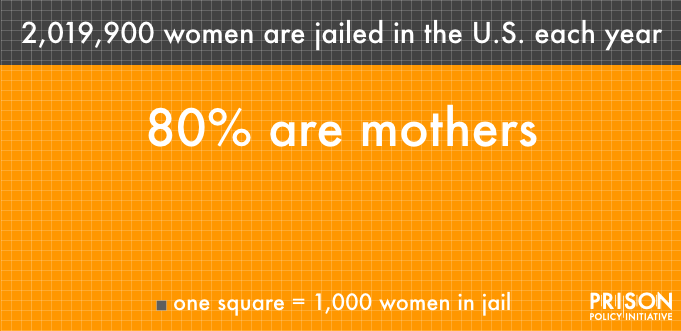 Estimates have been rounded for this graphic. Sources: Federal Bureau of Investigation,


