North Dakota profile
North Dakota has an incarceration rate of 560 per 100,000 people (including prisons, jails, immigration detention, and juvenile justice facilities), meaning that it locks up a higher percentage of its people than almost any democratic country on earth. Read on to learn more about who is incarcerated in North Dakota and why.
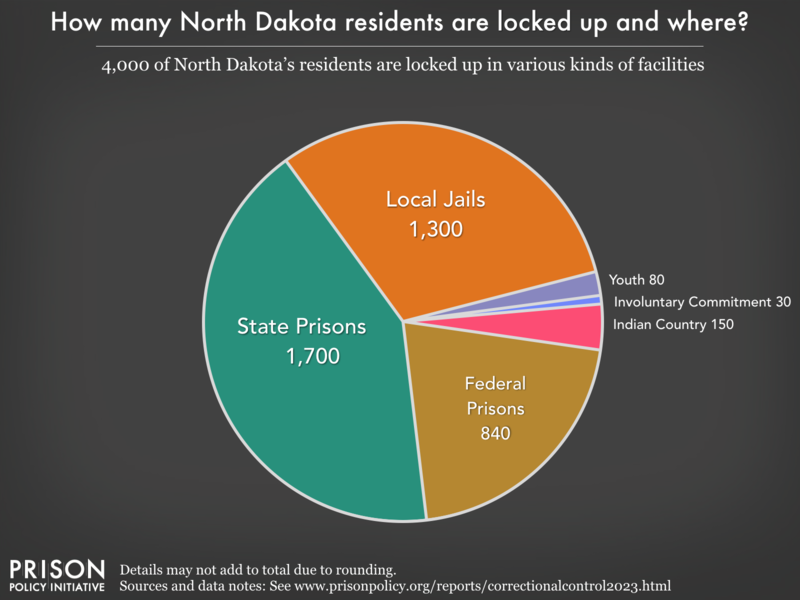
4,000 people from North Dakota are behind bars
Additionally, the number of people impacted by county and city jails in North Dakota is much larger than the graph above would suggest, because people cycle through local jails relatively quickly. Each year, at least 13,000 different people are booked into local jails in North Dakota.
Rates of imprisonment have grown dramatically in the last 40 years
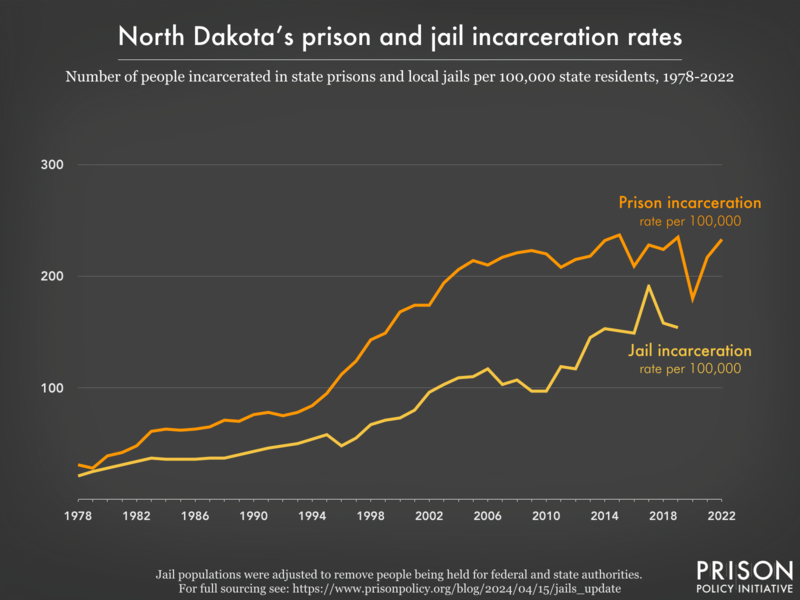
- total numbers rather than rates.
- Women’s prisons: Incarceration Rates | Total Population
- Men’s prisons: Incarceration Rates | Total Population
Today, North Dakota’s incarceration rates stand out internationally

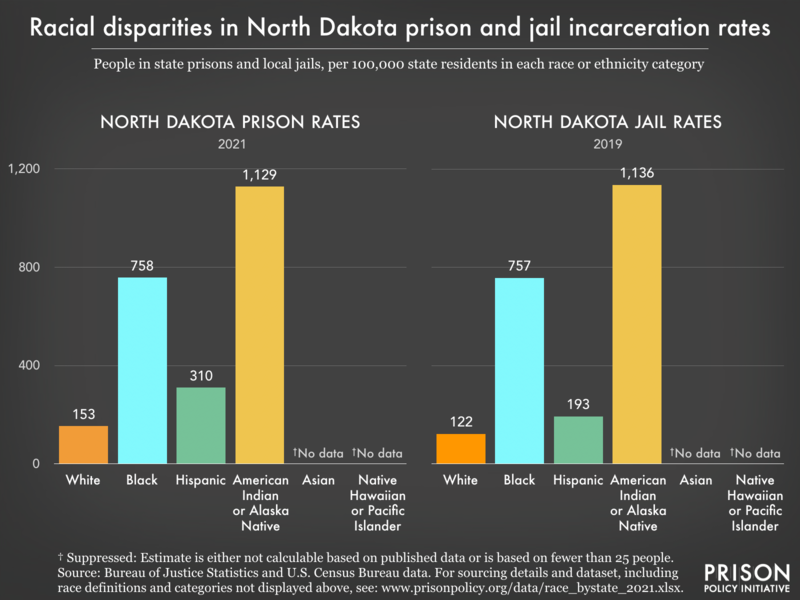
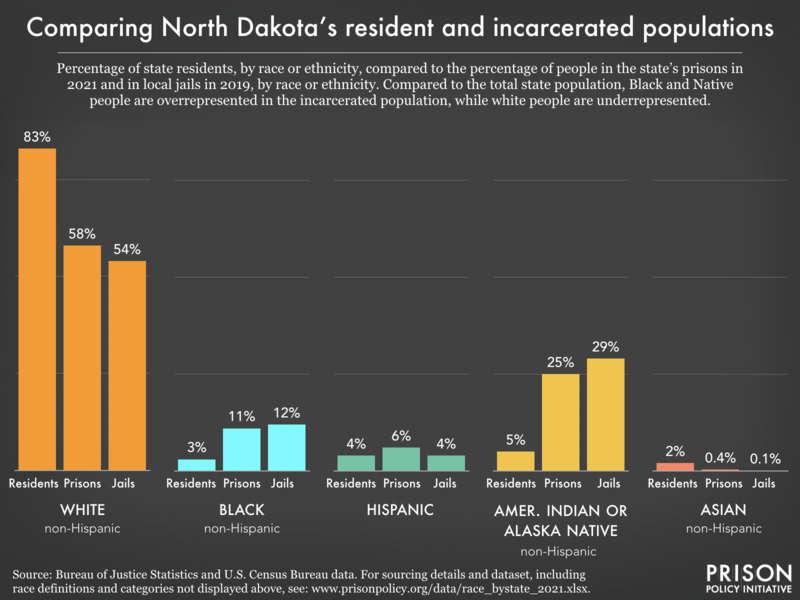
People of color are overrepresented in prisons and jails
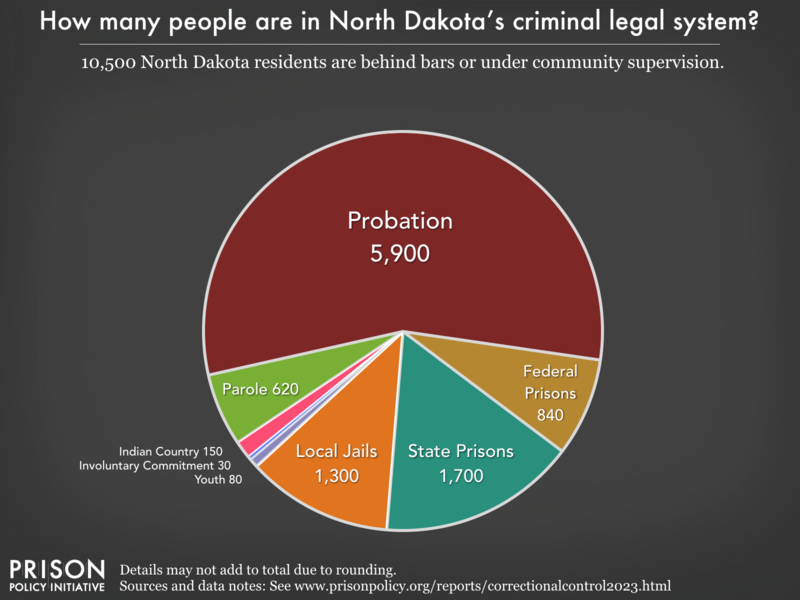
North Dakota's criminal justice system is more than just its prisons and jails
Reports and briefings about North Dakota's criminal legal system:
Filter to show
- North Dakota makes medications for opioid use disorder available in its prisons. Why is getting treatment for substance use disorders so difficult across the US carceral system?
- While other states reduced their prison populations during the pandemic, North Dakota's prison population has been increasing since the pandemic started.
- People on probation in North Dakota are saddled with onerous rules and conditions they must follow every day or risk incarceration.
- Prisons in North Dakota have tablets, but they may be being used to restrict incarcerated people’s access to books and sap them of the little money they have.
- With an incarceration rate of 560 per 100,000 residents, North Dakota locks up a higher percentage of its people than almost any democratic country on earth.
- After the Dobbs’ decision, striking down Roe v. Wade, North Dakota totally banned abortion, putting access to the service effectively out of reach for the 1,800 women on probation or parole in the state who also face travel restrictions.
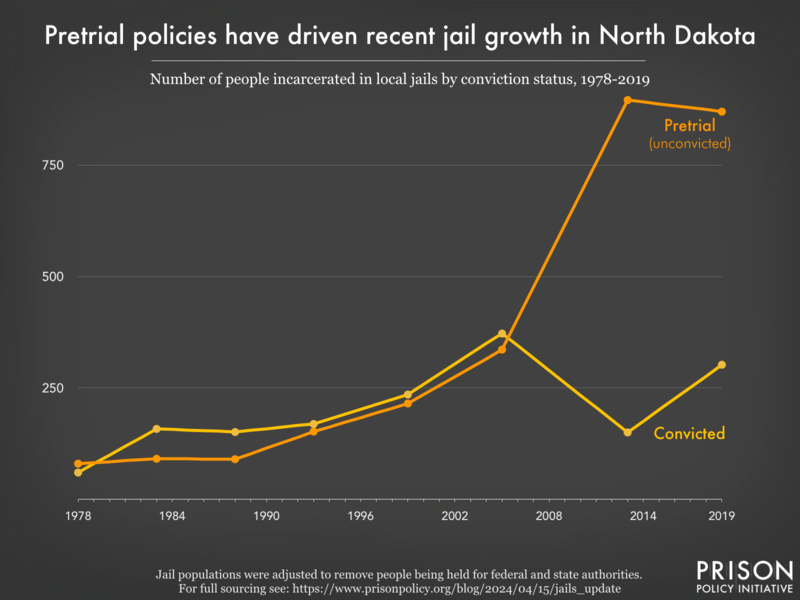
- 74% of people in North Dakota jails have not been convicted of a crime, meaning they're legally innocent. There are simple steps the state can take to reduce this number. Why isn't it?
- North Dakota releases roughly 35,829 men and 12,039 women from its prisons and jails each year. What is it doing to support them upon reentry?
- The parole board in North Dakota is releasing 25% fewer people and holding 23% fewer hearings since the pandemic started
- Black people in North Dakota are incarcerated at a rate 5 times higher than white people.
- North Dakota's choice to criminalize "failure to appear" may be hurting public safety
- The cost of incarcerating older people is incredibly high, and their risk of reincarceration is incredibly low, yet 9% of people in North Dakota prisons are over the age of 55. Why is the state keeping so many older people locked up?
- North Dakota makes it difficult or even risky for incarcerated journalists to tell their stories.
- North Dakota is one of 20 states that locks up some people convicted of sex offenses in shadowy "civil commitment" facilities, long after their sentences are over — and often indefinitely
- In North Dakota, 4,000 people are incarcerated and another 6,520 are on probation or parole.
- North Dakota charges up to 40¢ for an e-message to or from prison, among the highest rates in the nation.
- Jails in North Dakota charge up to $3.15 for a 15-minute phone call, reaping profits for companies, while prisons charge $1.20 for a 15-minute call.
- North Dakota prisons are replacing incarcerated people's personal mail with scans, stifling family contact
- How the end of Roe v. Wade will impact the 1,760 women on probation and parole in North Dakota
- North Dakota suspended its $3 medical copays in prisons at the beginning of the pandemic for flu related medical visits — it should eliminate them entirely.
- People in North Dakota prisons must pay for hygiene items and other basics — unless they have less than $15 in their spending account and meet work requirements. Those that qualify for financial assistance have to pay the state back.
- North Dakota prisons charge families up to a 20% fee to transfer money to an incarcerated loved one.
- We gave North Dakota a failing grade in September 2021 for its response to the coronavirus in prisons.
- How many COVID-19 cases in North Dakota communities can be linked to outbreaks in correctional facilities? (data from our report Mass Incarceration, COVID-19, and Community Spread)
- We graded the parole release systems of all 50 states — North Dakota gets an F-
- North Dakota incarcerates women at a rate of 155 per 100,000 residents — higher than any democratic country on earth.
- People in North Dakota prisons earn as little as 19¢ an hour for their work.
Other resources
- Research on North Dakota in our Research Library
Events
- April 30, 2025:
On Wednesday, April 30th, at noon Eastern, Communications Strategist Wanda Bertram will take part in a panel discussion with The Center for Just Journalism on the 100th day of the second Trump administration. They’ll discuss the impacts the administration has had on criminal legal policy and issues that have flown under the radar. Register here.
Not near you?
Invite us to your city, college or organization.
