Uncategorized archives

Jails and prisons across the country have record-high vacancies, creating bad working conditions for corrections staff and nightmarish living conditions for incarcerated people. Why haven’t pay raises, benefits, and new facilities turned recruitment around, and what does that tell us about the state of mass incarceration?

by Brian Nam-Sonenstein and Emmett Sanders, December 9, 2024

Prisons and local jails struggled with staffing well before the COVID-19 pandemic spurred a national labor shortage, and they haven’t bounced back since. Recruitment and retention are still a high priority for corrections agencies,1 with nearly half reporting between 20 and 30% of their workers leaving each year. Many departments have tried increasing compensation, lowering employment requirements, hiring more part-time workers, and building new facilities to attract recruits but it hasn’t worked. Why not? Because “understaffing” is an untreatable symptom of mass incarceration — not a recruitment problem.

When there are fewer workers than necessary to operate facilities as planned, correctional authorities cut back on the things staff are needed to manage, and conditions get worse: people are stuck in ‘lockdown’ conditions, they’re transferred around, housing units are consolidated, access to services and programming is limited, and fights break out. As conditions deteriorate, fewer people want to work in these facilities. Decarceration should seem like the obvious way to break the cycle, but it’s readily dismissed by corrections leaders2 whose livelihoods depend on mass incarceration. In this light, understaffing is a bad way to understand what’s plaguing jails and prisons but a good way to demand more investment; it’s why recruitment is the only solution corrections can offer and a dead end at the very same time.

It has become clichéd for corrections departments and news media to blame understaffing for nearly every problem in jails and prisons; everything would be so much better (the thinking goes) if departments simply had enough workers. This framing conveniently overlooks mass incarceration as a policy choice, restricting the universe of available policy solutions to greater investments in locking people up. Many of the issues for which “understaffing” is blamed are fundamental to mass incarceration, and are best addressed through decarceration — not a jobs program for corrections officers or further investments in surveillance and imprisonment. Decarceration takes incarcerated people (and workers) out of harm’s way while freeing up resources for more constructive uses in the community, which are far more effective at deterring crime and ensuring safety than criminalization.

In this briefing, we look at what’s happening to the corrections workforce, how staff shortages harm incarcerated people and workers, and how corrections agencies have tried (and failed) to address staffing problems without addressing mass incarceration. In the end, we urge jurisdictions to prioritize release and reduced admissions over futile attempts to make mass incarceration “work.”

According to our analysis of the Census Bureau’s Annual Survey of Public Employment and Payroll, the number of state prison and local jail workers fell substantially with the onset of the COVID-19 pandemic and has yet to rebound.

Staffing is down despite annual wage growth

Prisons and local jails have shed thousands of full-time workers in recent years. Despite rising wages, this decline in the workforce — which began to accelerate in 2020 — is expected to continue into the next decade and has been markedly worse in state prisons than in local jails.

Employment. State prisons lost 12% of their full-time workforce between 2013 and 2023, with nearly all (93%) of this decline coinciding with the pandemic, according to our analysis of the Census Bureau’s Annual Survey of Public Employment & Payroll.3 Local jails lost 2% of their full-time workers over the past decade, with a 7% decline in the workforce since 2020.4 Meanwhile, part-time employment5 in jails and prisons has grown since the first year of the pandemic.6 The total correctional workforce7 has shrunk by 11% in state prisons and 7% in local jails since 2020, and agencies are expected to see, on average, a 6% decline in employment between 2023 and 2033.8

Chart showing how corrections wages have risen and kept pace with inflation from 2013 to 2023 Corrections wages have risen and largely kept pace with inflation over the past 10 years; even during high inflation following the onset of the COVID-19 pandemic, the purchasing power of corrections workers’ salaries remained relatively consistent.

Wages. According to the Bureau of Labor Statistics’ Occupational Employment and Wage Statistics,9 the median annual wage for correctional officers and jailers in 2023 was $53,300.10 The median corrections salary grew by 35% in the decade between 2013 and 2023, and 12.5% since 2020 alone. Wages have remained relatively consistent with inflation for the last 10 years, but these figures notably exclude premium wages,11 which are significant and have skyrocketed in recent years. There are no public data on premium pay, but news reports indicate that workers racked up hundreds of millions of dollars of these additional wages in many prison systems.12 While overtime puts more money in workers’ pockets, demanding work schedules burn people out and deter them from seeking or keeping corrections jobs.

Chart comparing fatal workplace injuries in corrections to the most dangerous jobs in America Working as a delivery truck driver is roughly 15 times as deadly as working in a jail or prison, and yet corrections workers’ median annual salary is around $13,300 higher.

Jail and prison officials consistently blame low wages as an obstacle to recruitment, but it’s worth noting that the median annual corrections wage ($53,300) is higher than professions requiring more training and education, like EMTs ($53,180) and counselors and social workers ($44,040). Additionally, corrections work isn’t among the top 10 most dangerous jobs in America, but their median annual salary is still higher than those for jobs that are, such as loggers ($48,910 per year), roofers ($50,030), delivery truck drivers ($39,950 per year), and construction workers ($44,310 per year).

Recruitment strategies can’t address fundamental problems in jails and prisons

The narrow focus on recruitment as the antidote to understaffing poses serious risks to the health and well-being of incarcerated people and workers (albeit in very different ways). To be clear, incarcerated people undeniably face the worst harms of understaffing. Incarcerated populations are consolidated and crowded together when there’s not enough staff, and they’re often transferred to other facilities and housing units. Those transfers disrupt supportive connections to local communities, programming, and services like visitation, medical services, or the commissary. Crowding and transfers also lead to violence and the spread of infectious diseases. Lockdowns and other restrictions on movement have become more brutal and frequent without the necessary staff to facilitate movement throughout facilities or to and from court. As a result, time out-of-cell is significantly limited.13 All of this has contributed to the deterioration of incarcerated peoples’ mental health and their inability to get care, raising the risk of death and suicide: in-custody deaths have spiraled out of control as staff shortages intensified, forcing more people to endure the trauma of witnessing and being victims of violence. Understaffing is routinely blamed for deaths in part because there is also a shortage of medical and social work staff — shockingly, these professionals are sometimes tapped to handle officer duties when there is a shortage of trained security staff.

While our work focuses mostly on how the system harms incarcerated people and their communities, we’ve written before about how corrections work harms workers. A recent job posting for a Georgia corrections officer provides an instructive example, noting that applicants must be prepared to work nights, weekends, and holidays; be exposed to violence and disease; strip search people; and kill them “if necessary:”

image composed of screenshots highlighting requirements for Georgia correctional officers to work extra shifts, perform body cavity searches, and shoot people to death if necessary Select requirements listed in an additional “Note” in all Georgia Department of Corrections job vacancy listings for Correctional Officers (accessed December 7, 2024).

In addition to working in the same overcrowded and dangerous environments facing incarcerated people, corrections workers are exposed to physical health risks such as injury or an increased risk of infectious diseases including COVID-19, tuberculosis, and hepatitis B. They have high rates of death and suicide from routinely experiencing trauma: one 2013 study of nearly 3,600 corrections professionals from all over the country estimated that 34% of correctional staff in security roles have post-traumatic stress disorder (PTSD) while 31% have depression — rates that are much higher than the 6 out of every 100 people (or 6% of the U.S. population) who will have PTSD at some point in their lives.

With that in mind, it’s no wonder why several recruitment strategies have failed to make these jobs more attractive:

Pay increases haven’t worked: As we’ve noted, the median annual salary for corrections officers has increased year over year. Agencies have tried to use higher salaries, signing bonuses, generous benefit packages, and other compensation to recruit workers but this generally hasn’t made a difference. Atlanta’s Fulton County Jail, which has a lot of problems including that it hasn’t had enough staff for many years, deployed hiring bonuses and the highest salaries of any sheriff’s department in the state but still struggles to fill positions.14 Meanwhile, the Colorado Department of Corrections has tried offering up to $7,000 in bonuses and received around $192 million to increase compensation, recruitment/retention incentives, staff overtime, and contracted personnel, but still faces a major labor shortage.

Easing employment requirements hasn’t worked: Corrections officials have also tried to relax various employment requirements to boost recruitment. In most cases, this involves changing the minimum or maximum age requirement to work as a corrections officer. In Mississippi, teenagers are expected to manage people incarcerated in state prisons with as little as an 8th-grade education, and the state still ranks among the worst of the worst for understaffing. The federal Bureau of Prisons, meanwhile, faces staff shortages despite temporarily raising its maximum age for corrections officers to 40 years old.

Staff wellness programs haven’t worked: Employee wellness programs are a popular approach to making corrections workplaces more attractive. The American Correctional Association surveyed 45 state prison systems and 25 local jails and found that 96% of those corrections agencies offered some form of employee wellness programming. However, over half of the 61 corrections agencies that reported barriers to wellness programs said that “lack of adequate staffing” was a barrier to implementation.

New facility construction hasn’t worked: Correctional facilities are often cited as obstacles to recruitment for reasons that include their vulnerability to climate change and old and crumbling architecture. We’ve previously written about the dangers of new jail and prison construction (and how to fight it), and one of the most pernicious myths supporting these projects is that newer, nicer facilities will stimulate recruitment by improving working conditions for staff. Yet time and time again, agencies struggle to staff new facilities. Marion County, Indiana built a new $570 million campus for its courts and a jail, arguing it would help resolve staff shortages, which it did not. Denver, Colorado spent millions to renovate a jail and improve working conditions and still can’t fully staff it.

Other desperate measures: Florida and West Virginia have called in the National Guard to maintain a brutal state of emergency rather than release people in response to staff shortages. West Virginia recently ceased its emergency as staffing levels have improved compared to two years ago, but overcrowding and staff vacancies persist nonetheless. Meanwhile, Nevada has contemplated turning to drones and monitoring shackles, and the federal government is considering taking over Alabama prisons amid hundreds of deaths, years of understaffing, and a plan to build a new $1 billion prison.15

Conclusion

Understaffing is a real problem in jails and prisons, and is directly tied to the living conditions of incarcerated people. It is an inevitable consequence of the U.S.’s limitless dependence on criminalization and mass incarceration — not a failure to provide higher wages, new prisons, and yoga classes. We know this because narrowly focusing on the needs of the corrections workforce has not made a dent in staffing, nor has it improved conditions for incarcerated people.

Decarceration is the most straightforward, workable solution to the problems for which “understaffing” is blamed. This means increased use of parole and other forms of release, ending cash bail, reducing arrests and police contact, and other interventions aimed at removing people from the system and preventing more people from going in are all targeted policy solutions to understaffing. When policymakers abandon the idea that these problems can be addressed as narrow recruitment and human resources issues, and instead move away from mass criminalization and incarceration, we will finally see real movement on these issues and real relief for workers and incarcerated people alike.

Footnotes

  1. Recruitment and retention are high priorities according to recent surveys from the Correctional Leaders Association. Half of the survey respondents — including administrators for all 50 state prison systems, four territories, four large jail systems, and military corrections — report officer turnover rates in the 20-30% range annually, with 38% of staff leaving within a year and 48% leaving within one-to-five years.  ↩

  2. One report from the American Correctional Association on staffing notes that “the physical work environment includes noise level, not being able to bring one’s cell phone into work, or limited access to natural lighting. Environmental factors have been linked to increased sick leave, stress, and employee substance use. Unfortunately, many of these realities cannot be changed or they require significant expense to improve.”  ↩

  3. To calculate these figures, we used national-level full-time and part-time Corrections employment data for 2013 to 2023. The survey collects state and local government employee data from all agencies of the 50 state governments and approximately 91,750 local governments. According to the methodology, these data cover the pay period including March 12 of each survey year.  ↩

  4. Some state prison and local jail systems saw particularly large drops in their full-time staff rosters. For example:

    Full-time state prison workers

    State Percent change in workers,
    2013-2023
    Percent change in workers,
    2020-2023
    Arkansas -18% -17%
    Georgia -40% -21%
    Mississippi -34% -4%
    Nevada -26% -23%
    New Jersey -25% -20%
    North Carolina -43% -35%
    Texas -18% -14%

    Full-time local jail workers

    State Percent change in workers,
    2013-2023
    Percent change in workers,
    2020-2023
    New Mexico -27% -19%
    New York -7% -16%
    Wisconsin -13% -17%

    Data compiled by the Prison Policy Initiative using the Census Bureau’s Annual Survey of Public Employment & Payroll.  ↩

  5. Notably, this temporary strategy to cope with understaffing likely has a limited shelf life. Part-time workers do not receive the same benefits and compensation packages offered to full-time employees, and part-time workers likely won’t fill enough of the gaps in the schedule to meaningfully reduce the reliance on mandatory overtime.  ↩

  6. The number of part-time workers in state prisons grew by 45% between 2021 and 2023, adding 3,391 part-time workers while losing 33,431 full-time workers (-8%). In local jails, part-time employment grew by 5% in that time, recruiting 587 part-time employees as full-time employees declined by 9,645 (-4%). In all, part-time workers offset full-time workers by only 10% in state prisons and 6% in local jails.  ↩

  7. Here, “total correctional workforce” refers to combined full- and part-time employees in state prisons and local jails.  ↩

  8. There are an estimated 31,000 openings for corrections officers and bailiffs each year due to high turnover, retirement, and workers switching careers.
     ↩

  9. To calculate these figures, we used median annual wage data for Correctional Officers and Jailers for each year from 2013 to 2023. According to the methodology for this series, the Bureau of Labor Statistics survey reports wages as straight-time, gross pay, exclusive of premium pay. Base rate; cost-of-living allowances; guaranteed pay; hazardous-duty pay; incentive pay, including commissions and production bonuses; and tips are included, while overtime pay, severance pay, shift differentials, nonproduction bonuses, employer cost for supplementary benefits, and tuition reimbursements are excluded.  ↩

  10. The lowest 10% of corrections workers made around $38,340 per year while the highest 10% made around $87,670 per year. Importantly, these wage data exclude premium pay, such as overtime and shift differential pay.  ↩

  11. The U.S. Department of Labor defines premium pay as “Extra compensation paid at a ‘premium rate’ for certain hours worked by an employee because such hours are hours worked in excess of eight in a day, or in excess of 40 hours in the week, or in excess of the employee’s normal working hours or regular working hours, as the case may be.” This pay is offered at a premium rate, which the DOL notes “may not be less than one and one-half times the rate established in good faith for work performed in nonovertime hours on other days.” This includes overtime, which is mandatory in many prison systems as fewer workers have to work longer hours, as well as shift differential pay, earned when people work outside of their normal hours.  ↩

  12. For example:

     ↩

  13. A report from the John Howard Association sheds light on the situation in Illinois. For example, it reported results from a survey of 8,616 people incarcerated in that state’s prisons found that 67% said they “spend too long locked up in their cells,” and around 26% disagreed with the statement that they have the “opportunity to go to yard at least twice a week.” They also found administrative-based lockdowns (usually tied to a lack of staffing) accounted for a majority of lockdowns over the last six years — specifically, 86.5% of all lockdowns in FY 2024. Between 2019 and 2024, lockdown days increased nearly 549%, from 242 lockdown days to 1,570 lockdown days – and even this may be an “incomplete picture” because, the authors write, “individual housing areas may be locked down and not captured in public reporting, which appear to only reflect facility-wide restrictions at most prisons.” (For context, the report explains, “Lockdowns typically mean that all incarcerated people in a facility are subject to the extreme restrictions consistent with solitary confinement or restrictive housing. During these periods, incarcerated people are confined to their cells or sleeping areas for 22 to 24 hours per day with limited access to activities such as education, programming, visitation, recreation, religious services, and communal meals.”)  ↩

  14. Ironically, the neighboring Clarke County sheriff has warned his jail will look like Fulton County if officers don’t receive a 10.5% pay increase even though such increases have made no meaningful difference in conditions in Fulton County.  ↩

  15. Conditions in Alabama prisons have become so dire that some incarcerated people are calling for the federal government to step in.  ↩


In a new report, we highlight reforms that are ripe for victory in the new year and provide tips for advocates to oppose lawmakers pushing for failed "tough-on-crime" lawmaking.

December 4, 2024

Today, we released our annual list of actionable and specific criminal legal system reforms state legislators can pursue as they return for the new legislative session. This sweeping resource offers examples of reform victories that policymakers can emulate to make the criminal legal system fairer without making it bigger.

The 34 reforms focus on eight areas:

Each reform provides critical context about the problem it seeks to solve, points to high-quality research on the topic, and highlights solutions and legislation that have already been implemented in other states.

The list is not intended to be a comprehensive platform. Instead, we’ve curated it to offer policymakers and advocates straightforward solutions that would have a significant impact without further investments in the carceral system. We particularly focused on reforms that would reduce the number of people needlessly confined in prisons and jails. Additionally, we selected reforms that have gained momentum in recent years, passing in multiple states.

2024 carried several big setbacks for those pushing for an end to mass incarceration. In response, this year’s report includes a new section, offering tips for advocates to oppose their legislators backsliding into “tough-on-crime” lawmaking.

We sent this list to roughly 700 lawmakers, in all 50 states, from all political parties, who have shown a commitment to reducing the number of people behind bars in their state and making the criminal legal system more just and equitable. As they craft legislation for the upcoming legislative sessions, this list will provide them with actionable solutions to some of the most pressing challenges their states’ criminal legal system faces.

The full report is available at: https://www.prisonpolicy.org/reports/winnable2025.html.


Advocates in Virginia are leveraging their own lived experience and the voices of thousands of other systems-impacted people and their families to make sweeping changes to the state’s prisons. Here’s how they’re doing it.

by Emmett Sanders, December 2, 2024

People who go through the criminal legal system often feel as if their humanity is being ignored. These feelings are more than justified. Dehumanization is not simply a side effect of incarceration: it is intentional and has been a part of prisons in the United States since the first brick was laid. Prisons in early America were so focused on keeping prisoners isolated and anonymous that they “required inmates to wear hoods whenever overseers moved them around the penitentiary.” While some things have changed, stripping prisoners’ identities remains a main component of incarceration in America.

According to activists like Johnny Perez, “The thing that they take the most, also, is actually your identity.” As the authors of The Roles of Dehumanization and Moral Outrage in Retributive Justice point out, “viewing others as lacking core human capacities and likening them to animals or objects may make them seem less sensitive to pain, more dangerous and uncontrollable, and thus more needful of severe and coercive forms of punishment.” Reducing incarcerated people to numbers or to the alleged acts that brought them to prison makes it easier to deny them civil rights and allows systems to justify harsher punishment, longer sentences, as well as the inhumane, often abusive conditions that prisons impose by design. Dehumanization allows policymakers to ignore the human impact of their decisions on people in prisons and their families. It also creates the false image that people in prison are incapable of rehabilitation.

When lawmakers don’t see people in prisons as fully human, it makes it much harder to change inhumane prison conditions and policies. That’s why an organization of systems-impacted advocates in Virginia, The Humanization Project, uses a framework of “humanization” to drive policy change. Humanization works to unflatten the identities of those impacted by incarceration in public narrative and political discussions, shifting focus away from people’s worst moments and toward the many statuses and roles that make them who they are. Through humanization, people are not just numbers or statistics; they are fully formed human beings with families who love them. They are children and parents, husbands and wives, grandmothers and grandfathers. This change in perspective can have a powerful impact on lawmakers.

The Humanization Project provides a powerful framework for advocacy

The Humanization Project has been working with the impacted community to reform Virginia’s justice system since 2017. Co-founded by Executive Director Taj Mahon-Haft and his partner Gin Carter while Mahon-Haft was still incarcerated, the organization began by noting that the “human consequence” of policy decisions was often left out of reform discussions. Informed by Mahon-Haft’s experience as a trained sociologist, The Humanization Project used a humanization framework, centered in empathy and common ground, to develop several strategies to change this dynamic, including:

  • Using multimedia platforms to curate narratives and impacted person-produced research that provide human faces and voices for issues, and connecting those narratives with policymakers, advocates, and the public;
  • Using community engagement and direct outreach to educate and inform impacted people and their families on how the legislative process works, what a bill will do, and the processes and procedures of system change;
  • Leveraging their intersectionality as impacted advocates to facilitate human-centered discussions across a diverse array of partners in order to build capacity and coalition through commonality and compassion.

Entirely dependent upon the support and engagement of the justice-impacted community, this model helped The Humanization Project shift narratives, defuse fear-mongering attacks, and expand support for one of the biggest reforms in Virginia’s history, HB5148, which established a system for Earned Sentence Credits.

Anatomy of a victory: Earned sentence credit in Virginia

According to the Virginia Department of Corrections, when COVID-19 hit, the state’s prison population had been hovering at around 30,000 people since at least 2014.1 Advocates, organizers, and policymakers used litigation and proposed legislative changes to reduce prison populations. In the context of this struggle, lawmakers proposed HB 5148 to expand the use of earned sentence credits. In Virginia, as in other states, some people in prisons earn “good time” credits: for each day they spend incarcerated without disciplinary issues, they earn a certain amount of time off their overall sentence. Earned Sentence Credits, unlike good time credits, are based on merit and require participation in rehabilitative or educational programming, work, or service. Among other benefits, expanding the use of earned sentence credits can help reduce prison populations, make prisons safer, and reduce the chance of people returning to prison. Offering and incentivizing rehabilitative programming also better aligns with what crime survivors want. In Virginia, however, offense-based carveouts meant that thousands of people couldn’t earn sentence credits for participating in programming. HB 5148, the Earned Sentence Credit bill, more than tripled the amount of time most people could earn for participating in programming and applied retroactively, meaning people were awarded credit for programming they had participated in in the past. All in all, it offered an earlier release date for thousands of people in Virginia’s prisons.

Interested in whether your state has earned sentence credits?

33 states allow good time credits.

Many states have long-held mandatory minimum and truth-in-sentencing laws that severely limit the amount of time people can earn, with states like Arkansas, South Dakota, and Louisiana recently implementing new restrictions. Where allowed, earned sentence credit policies are often riddled with offense-based carveouts that severely limit their effectiveness as a means of decarceration. According to a 2020 National Conference of State Legislatures (NCSL) study of time credit statutes by state, 32 states allow good time, 33 states allow earned time, 35 states have programming requirements for earned time or good time, and 20 states have restrictions on time earned or good time based on classification or offense.

Using a humanization model, and with the priceless engagement of community members and grassroots and civil rights organizations like the ACLU of Virginia, The Humanization Project produced videos and messages from people in prison to urge policymakers to pass HB 5148. When Gov. Youngkin forced a budgetary amendment that carved out people with certain offenses and reduced the number of people eligible for the rise in earned sentence credit by around 40%, The Humanization Project again lifted the voices of those most directly affected to fight against the change. The bill passed in October 2020, and was fully realized in May 2024 when the state’s new budget was signed into effect without the governor’s exceptions, expanding eligibility to another 7,000 incarcerated people.

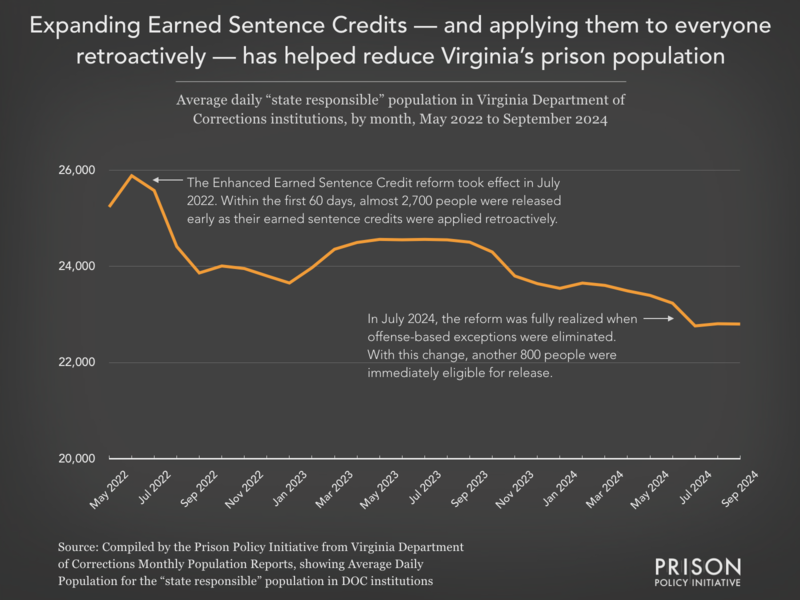
Including the 10,826 who had received immediate changes to their release dates when the bill took effect in July of 2022, nearly 18,000 people2 have had their release dates modified overall. Around 79% (or 7,329 out of 9,324) of people released from Virginia’s prisons in FY 2023 alone benefitted from earned sentence credits, with thousands more projected to be released through earned sentence credits in FY 2024. Overall, per the Virginia Department of Corrections’ monthly population reports, the state lowered its state-responsible population by around 12% between June 2022 (25,889) and September 2024 (22,802), contributing to the closure of four prisons. The implementation of earned sentence credit is also projected to save Virginia $28 million over the next two years. The Humanization Project notes this victory does not belong to them, but to the broader justice-impacted community in Virginia: as Taj Mahon-Haft points out, “We are proud to have been part of helping organize and engage people, but the progress only happened because impacted folks across the state shared their voices and humanity in ways that changed hearts and minds. Anyone who really gets to know the members of our community can’t help but want a more humane system.”

”Line Source: Virginia Department of Corrections Monthly Population Reports June 2022 through September, 2024.

Humanizing future advocacy can strengthen reform

While many factors contributed to Virginia’s massive drop in prison population since the COVID-19 pandemic began, the passing of Earned Sentence Credit has played a huge role, as has the use of humanization as a framework for change. The Humanization Project is now applying this same advocacy model to other issues they’ve identified, such as their “Reentry Begins: Day 1 Inside” initiative, which focuses on creating earlier access to programming for people in prison. Currently, people may have to wait months or even years before accessing programming. With the passage of HB5148, earlier access to programming would mean incarcerated people could begin to accrue earned time and ultimately become eligible for release earlier as well, further amplifying the success of the changes to earned sentence credit. The campaign is also turning the lens of humanization towards protecting visitation quality and access for those in Virginia’s prisons and their loved ones, an effort that the Prison Policy Initiative’s advocacy department has supported through research.3 Focusing on humanization as a method of advocacy has proven effective in many contexts, and advocates across the country can use it in their own reform work.

Conclusion

Ultimately, the dehumanizing force of incarceration serves as a roadblock to reform by disconnecting policymakers from the human experiences of those in prison. Humanization is a framework that uses intersectionality, compassion, and common experience to implement meaningful, sweeping change by countering narratives that too often overlook the people in the policy. As the Humanization Project’s co-founder Gin Carter puts it, “This particular argument has been won with humanity conquering the day. We discuss the human impacts more while stereotypes, dog whistling and fear-mongering win out less often.”

Learn More

Learn more about good time and other ways to shorten excessive prison sentences in our report, Eight Keys to Mercy, and learn how mass decarceration does not make us less safe in Large scale releases and public safety, and learn more about combating carveouts that undermine effective justice reforms in our toolkit and webinar on charge-based exclusions.

Footnotes

  1. We used data from the Virginia Department of Corrections monthly population reports here as it provides the most recent data. However, the Bureau of Justice Statistics consistently reports significantly higher populations, including in 2014 (37,544), 2022 (27,162), than the Virginia Department of Corrections. The reason for this is unclear.  ↩

  2. Per reports, 10,826 received earned sentence credit initially, with another 7,000 receiving retroactive eligibility with the signing of the budget in May of 2024.  ↩

  3. Currently in Virginia, visitation can be suspended for a host of reasons, severely limiting incarcerated peoples’ access to the positive impacts of family contact.  ↩


Under this new rule, more than 340,000 people over the age of 65 who are on probation or parole will have access to healthcare coverage.

by Mike Wessler, December 2, 2024

Last month, the federal government approved an important new rule that makes people on probation or parole, out on bail, or living in a halfway house eligible to receive Medicare benefits. Medicare is the federal health insurance program for people who are age sixty-five or older or who have certain disabling medical conditions. Under this new rule, more than 340,000 people over the age of 65 who are on probation or parole, along with countless others who are under other forms of community supervision, will now qualify for Medicare.

Medicare does not provide care for people who are “in custody.” However, prior to this rule change, Medicare’s definition of “in custody” was much broader than the average person would assume. Rather than applying only to people behind bars, it also applied to anyone who was on bail, probation, parole, in a halfway house, or otherwise under the supervision of correctional authorities but not necessarily behind bars — excluding them from accessing health insurance benefits from the program.

The federal government based its previous Medicare policy on the flawed notion that people on community supervision received medical care from a correctional authority, which we heard time and time again is not the case. Prisons and jails often don’t provide adequate care to people behind bars, and they certainly don’t provide it to people living in the community.

This change is important because older people and people with disabilities are tangled in the criminal legal system at disproportionately high rates. Additionally, people on community supervision have dramatically higher rates of serious medical conditions, including Hepatitis B or C, kidney disease, and other disabilities — they’re also more likely to be uninsured.

We submitted public comment, along with dozens of other groups, including the Health and Reentry Project (HARP), Justice in Aging (JIA) and the Legal Action Center (LAC), in September urging the federal government to make this change. These new rules go into effect on January 1, 2025.

This is a significant victory won by the work of advocates from all across the nation that will significantly improve healthcare access for hundreds of thousands of people.


Using a novel data source, we examine the flow of individuals booked into a nationally-representative sample of jails along lines of race, ethnicity, sex, age, housing status, and type of criminal charge.

by Emily Widra and Wendy Sawyer, November 27, 2024

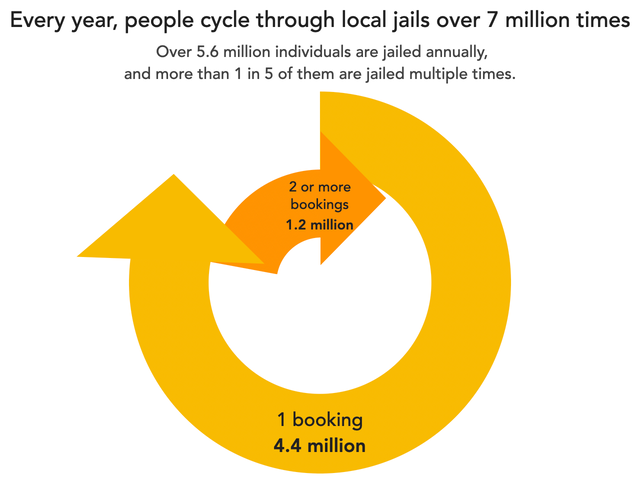
Millions of people are arrested and booked into jail every year, but existing national data offer very little information about who these people are, how frequently they are jailed, and why they are jailed. Fortunately, we now have new data through a collaboration with the Jail Data Initiative to help answer these questions: In 2023, there were 7.6 million jail admissions; but 1 in 4 of these admissions was someone returning to jail for at least the second time that year. Based on the Jail Data Initiative data, we estimate that over 5.6 million unique individuals are booked into jail annually1 and about 1.2 million are jailed multiple times in a given year. Further analysis reveals patterns of bookings — and repeat bookings in particular — across the country: The jail experience disproportionately impacts Black and Indigenous people, and law enforcement continues to use jailing as a response to poverty and low-level “public order” offenses.

stylized pie chart showing that 4.4 million people are booked into jail once each year, and 1.2 million are booked two ore more times

We first looked into these questions about repeat jail bookings in our 2019 report, Arrest, Release Repeat: How police and jails are misused to respond to social problems. In particular, our 2019 analysis found that repeated arrests are related to race and poverty, as well as high rates of mental illness and substance use disorders. While these new data don’t include as many contextual details as the survey we used in that analysis, the Jail Data Initiative data offer a more accurate accounting of unique versus repeat jail bookings — a number that the Bureau of Justice Statistics still does not collect or report. Our two analyses are not directly comparable: Our 2019 report uses data from a public health survey, the National Survey of Drug Use and Health, while the Jail Data Initiative data we use here are collected directly from online local jail records and updated daily.23 As a result, these reports have different strengths: this analysis can provide more accurate jail booking data because of the much larger sample size, while Arrest, Release, Repeat offers more descriptive data about people who have been jailed, including details regarding health, education, and income.

More than 1 in 5 people are jailed multiple times a year

While unique jail admissions (the number of individual people admitted to jail) account for three-quarters of jail bookings, more than 1 in 5 people (22%) booked into jail are booked again within 12 months. People who are jailed multiple times a year inevitably face exacerbated consequences of incarceration: As we have discussed before, there is no “safe” way to jail a person, nor is there an amount of time a person can be detained without escalating short- and long-term risks to themselves, their families, and their communities, including rearrest, legal debt, missed work, lost jobs, and health risks.

Racial disparities in jail admissions extend to repeat bookings

Black people are overrepresented in every part of the criminal legal system including jails, and this new data reveal that not only are Black people jailed at alarmingly high rates, but they are jailed again and again. Relative to their share of the total US population (14%), Black people are greatly overrepresented among the unique jail admissions in this sample (32%) and the people booked multiple times in a year (29%), while white people are underrepresented in both populations. This is consistent with what we know about the over-incarceration of Black people in this country, but the rebookings data add another layer of detail about their experiences with law enforcement, which often targets Black communities.4

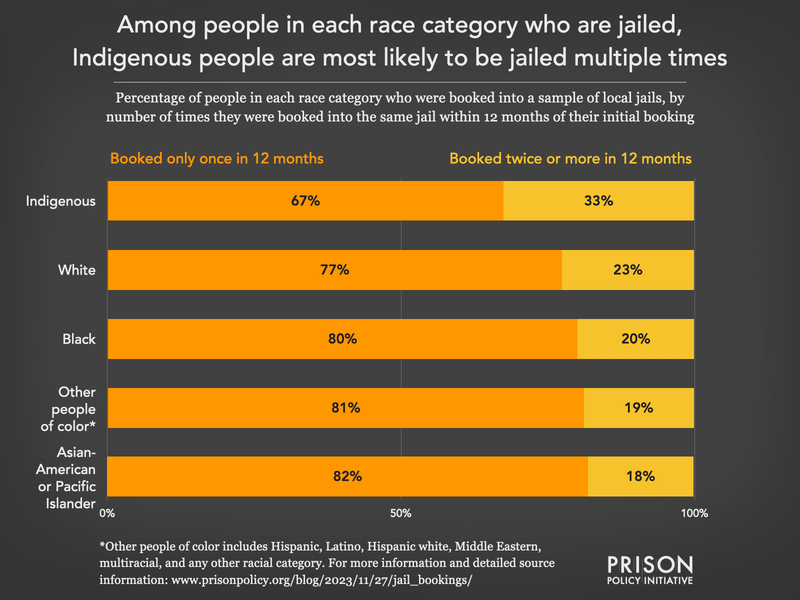
Indigenous people account for only 1% of the total U.S. population, but 3% of the incarcerated population, with incarceration rates between two and four times higher than that of white people.5 In the Jail Data Initiative data, we find that Indigenous people are especially likely to be booked into jail multiple times: 33% of Indigenous bookings were people who had been booked at least once in the past 12 months, compared to 18-22% among other racial and ethnic groups.

bar chart showing the percentage of people jailed in each race category who are jailed once versus two or more times in a year. One-third of Indigenous people who are jailed are jailed more than once, in all other groups it is about twenty percent

Women are funneled into jails

Women make up about a quarter of individuals booked into jail each year, which is in line with annual arrest data showing 27% of arrests in 2023 were of women.6 While we found no significant difference between men and women in terms of multiple jail admissions, we do know that the jail incarceration of women is growing: From 2021 to 2022, the number of women in jail increased 9% while the number of men in jail increased only 3%. The jailing of women has a devastating “ripple effect” on families: At least 80% of women booked into jail are mothers, including over 55,000 women who are pregnant when they are admitted. Beyond having to leave their children in someone else’s care, these women are impacted by the brutal side effects of going to jail: aggravation of mental health problems, a greater risk of suicide, and a much higher likelihood of ending up homeless or deprived of essential support and benefits. So while women may account for a relatively small share of people booked into jails, those jail admissions have serious and long lasting consequences for the women, their families, and their communities.

1 in 10 people booked are 55 years or older

Older adults account for one in ten of all jail bookings, but a slightly smaller share of rebookings (7%). This is consistent with existing arrest data that show an increasing proportion of older adults caught up in the criminal legal system: In 2021, people 55 years or older accounted for 8% of all arrests, a four-fold increase from their share of arrests in 1991. The Bureau of Justice Statistics only began publishing the age ranges of people in jails in recent years, but from 2021 to 2022, the jail incarceration rate of people 55 and older increased by 8%, compared to a 3% increase in jail incarceration rates across all other age groups. Considering most older adults are arrested for low-level, non-violent offenses like trespassing, driving offenses, and disorderly conduct,7 it is likely that the older adults admitted to jail are in need of other systems of support outside of the criminal legal system, like substance use treatment, accessible medical care, and behavioral health services.

More than 40% of unhoused people booked into jail were booked again within the year

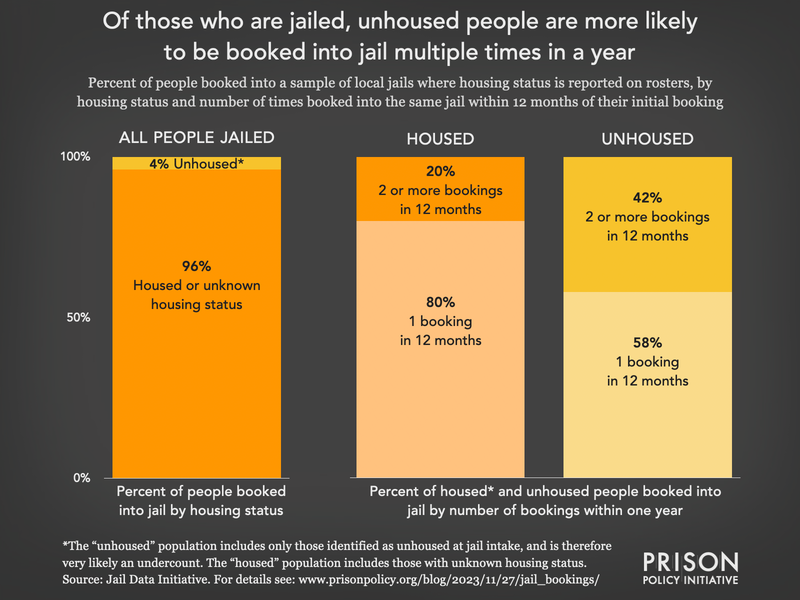
Poor people in the United States are a primary target for policing, especially those forced to live on the streets: In a 2022 analysis of Atlanta city jail bookings, we found that 1 in 8 admissions involved people experiencing homelessness, a proportion more than 30 times greater than the city’s total unhoused population. In this analysis of the Jail Data Initiative data, we find that across the 140 jails that include housing status on their online rosters, 4% of individuals booked are explicitly listed as unhoused, although this is almost certainly a significant undercount.8 While this is a relatively small portion of all bookings, unhoused people were the most likely to be jailed multiple times across all the demographic categories we looked at: Over 40% of unhoused people booked into jail were booked more than once in a twelve month period. This finding adds to the existing evidence of law enforcement’s ineffective but disproportionate and deliberate targeting of people experiencing homelessness.

bar chart showing that people identified as unhoused make up just 4 percent of jail admissions, but 42 percent of those unhoused people are booked into jail multiple times in a year, compared to 20% of people who were housed or had unknown housing status

Most people are jailed for public order, property, or drug charges — not “violent” charges

The Bureau of Justice Statistics last collected charge data for jail populations in their 2002 Survey of Inmates in Local Jails. Given that the most recent jail offense data is over 20 years old, the Jail Data Initiative dataset offers a rare opportunity to analyze the top charges9 that people are booked under nationwide. Of course, the difference in data sources makes a fully apples-to-apples comparison of the 2002 data and the more recent Jail Data Initiative data impossible.10 The data provided in the Bureau of Justice Statistics survey reflects self-reported information from people detained in a sample of local jails on a single day in June 2002, while the Jail Data Initiative data is based on jail bookings across a two-year time period and relies on administrative data. Nevertheless, the overall trends since 2002 offer some valuable insights into the reasons people are detained in jails today:

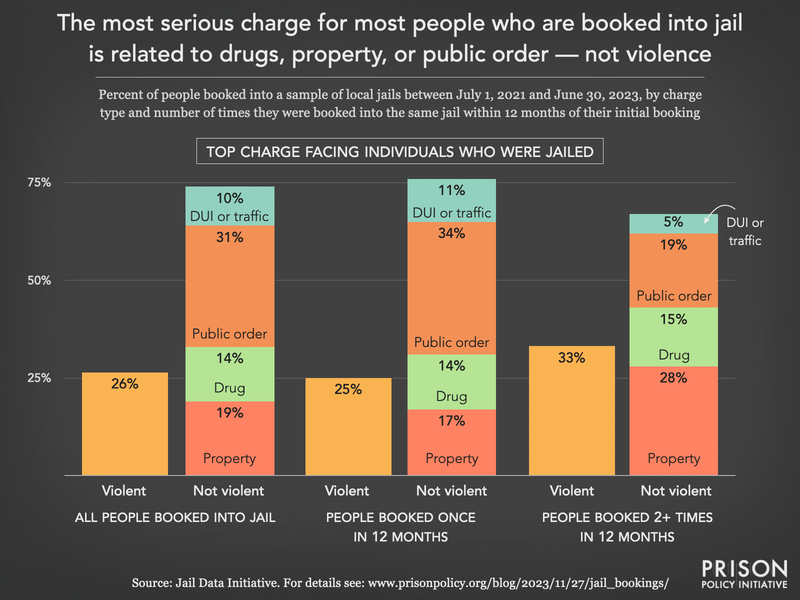
  • Drug charges appear to play a smaller role now than they did two decades ago, when the “war on drugs” was in full effect. In 2002, a quarter of people in jail were held for drug charges, compared to 14% of people admitted to jail in our 2021-2023 sample.
  • Property charges also appear to represent a smaller portion of the jail population now than they did in 2002: Property charges are the top charge for 19% of jail admissions, compared to 24% of the jail population in 2002.
  • In 2002, public order charges were the top charge for 25% of people in jail, but now, 31% of people admitted to jail are booked for a most serious charge related to public order, such as disorderly conduct, loitering, and public intoxication.
  • We see very little change in the proportion of people in jail for violent charges: in 2002, 25% of people were in jail for a violent charge and in our analysis of more recent jail bookings, about 26% of jail bookings were for violent charges.

In our 2021-2023 sample, only one-third (33%) of people booked multiple times had a top charge categorized as violent in the study window, suggesting that the vast majority of people admitted to jail — including people booked repeatedly — are not accused of violent charges like homicide, assault, robbery, or sexual assault.

bar chart showing that about three-quarters of everyone jailed has a top charge that is not violent; even among those booked two or more times in a year, only one-third have a violent top charge

In their own analysis of a similar sample of the dataset, researchers at the Jail Data Initiative, Orion Taylor and Anna Harvey, found that rebooking rates vary by the type of initial booking charge. Looking closely at the rates of people returning to jail on serious violent charges11 within six months of their release from jail, they found the average rebooking rate for a serious violent charge was only 2% for people initially booked into jail on any other kind of top charge. The rate was only slightly higher (9%) if they were also jailed on a serious violent charge initially.12

Conclusion

The Jail Data Initiative offers a sorely-needed alternative source of information about jail admissions and about people who are jailed repeatedly. In many ways, our findings from this analysis support what we already know: people who are arrested and booked more than once per year often have other vulnerabilities, including homelessness, in addition to the serious medical and mental health needs of this population that we discussed in our 2019 analysis based on public health data. In addition, this dataset fills a serious gap in our knowledge about the demographics and charges of people booked into jails, given that comparable data has not been collected or published from the Bureau of Justice Statistics in over twenty years.

Methodology

The Jail Data Initiative (JDI) collects, standardizes, and aggregates individual-level jail records from more than 1,000 jails in the U.S. every day. These records are publicly available online in jail rosters — the online logs of people detained in jail facilities that often include some personal information like name, date of birth, county, charge type, bail bond amounts, and more. JDI uses web scraping — the process of automating data collection from webpages — to update their database of jail records daily.13 The more than 1,000 jails included in the Jail Data Initiative database represent more than one-third of the 2,850 jails identified by the Bureau of Justice Statistics’ Census of Jails, 2019 and are nationally representative.

Of course, not all of the jails included in the Jail Data Initiative database provide the same information. For the purposes of our analysis, we used data from 648 jail rosters for which there was available data for a two-year window (July 1, 2021 to June 30, 2023), plus an additional 365 days for a look-forward review of rebookings (to June 30, 2024). We looked at people who were both booked into jail and released within the two-year study period, and counted people as “rebooked” or “booked two or more times” if they were booked into the same jail system within 365 days of their first jail admission in the study time period. We elected to use a two-year time frame to capture a larger sample of bookings than we could in a single calendar year.

In all, there were 2.9 million jail bookings captured across these 648 rosters, representing almost 2.2 million unique individuals booked into jail: People who were booked more than once in the two-year window accounted for 26% of all bookings.14 For the more detailed analyses of jail bookings and rebookings by race and ethnicity, gender, age, housing status, and charge type, we had to use subsets of this sample of 648 rosters because the inclusion of these details was less consistent:

  • Race and ethnicity: Of the 648 rosters in this sample, 437 rosters (67%) included the relevant race and/or ethnicity data needed for this analysis.15 Often, the data included in these jail rosters are administrative decisions and may not reflect an individual’s self-identified race or ethnicity.16 The final sample of rosters with race information included 1,923,668 bookings from 1,437,730 individuals.
  • Gender: Of the 648 rosters in this sample, 517 rosters (80%) included the relevant gender data needed for this analysis.17 Out of the more than two million bookings in this subset, 75 bookings with values of “trans” or “nonbinary” were omitted because of the small sample size.18 The final sample of rosters with binary “male” and “female” gender identifiers included 2,180,992 bookings from 1,623,638 people.
  • Age: Of the 648 rosters in this sample, 529 rosters (82%) included the relevant age data (under 55 years of age or 55 years and older) needed for this analysis.19 The final sample of rosters with age information included 2,393,299 bookings from 1,775,721 people.
  • Housing status: Of the 648 rosters in this sample, only 140 rosters (22%) included housing information needed for this analysis. This is the fewest rosters included in any of our subsets of the Jail Data Initiative dataset because most rosters in the sample do not have clear indications of housing status. We categorized individuals as “unhoused” if a person was reported unhoused upon admission for any of their bookings in the two-year period,20 and all other housing statuses were considered “housed or unknown housing status.” The final sample of rosters with housing information included 599,423 bookings from 457,025 people.
  • Charge type: Of the 648 rosters in this sample, 554 rosters (84%) included the relevant charge data needed for this analysis.21 Charges were grouped into the following categories (in order of severity, from most severe to least severe): violent, property, drug, public order, DUI offense, and criminal traffic. Because the top charge category does not indicate whether it was the first, second, or subsequent booking that had the top charge, nothing should be inferred about release decisions. The final sample of rosters with charge information included 2,517,899 bookings from 1,869,156 people.

See full Methodology

Footnotes

  1. Jail bookings — or admissions — involve the administrative process of collecting and entering information about the individual into the jail system and subsequently detaining that person in a jail facility. Almost all arrests lead to at least some in jail.  ↩

  2. The jail records and data are collected from jail rosters — publicly available, online logs of all individuals detained in a jail facility on a given date. The jail rosters used by the Jail Data Initiative are updated at least daily, excluding any jail rosters that are updated less frequently. A single jail roster may contain information for multiple counties or facilities: for example, West Virginia provides a single online search portal for all jails in the state.  ↩

  3. While the Jail Data Initiative data includes individual-level jail data in approximately 1,300 local jails, representing over one- third of all local jails in the country, this current analysis is based on a subset of those jails: 648 jails rosters with available data throughout the study period of July 1, 2021 to June 30, 2023. See the Methodology for more details.  ↩

  4. People who are arrested and jailed are often among the most socially and economically marginalized in society. The overrepresentation of Black people among those who are arrested is largely reflective of persistent residential segregation and racial profiling, which subject Black individuals and communities to greater surveillance and increased likelihood of police stops and searches. Poverty, unemployment, and educational exclusion are also factors strongly correlated with likelihood of arrest.  ↩

  5. Throughout this briefing, “Indigenous” refers to people identified in jail rosters as Native American, American Indian, Alaska Native, or Indigenous. This is inevitably an undercount of Indigenous people in local jails, given the flawed single-race categorization system that frequently obscures data on Indigenous people throughout the criminal legal system. For more information, see our profile page on Native incarceration in the U.S.  ↩

  6. According to the FBI’s National Incident-Based Reporting System (NIBRS), 1,681,794 of the 6,120,563 reported arrests in 2023 were women (Table 14: Arrestees Sex by Arrest Offense Category).  ↩

  7. According to the FBI’s National Incident-Based Reporting System (NIBRS), Table 13: Arrestees Age by Arrest Offense Category, 54% of people 55 and older arrested in 2023 were arrested for “Group-B offenses” including trespassing, driving offenses, and disorderly conduct.  ↩

  8. “Unhoused” refers to people who were positively identified as unhoused on the jail roster. This is likely a significant underestimate because many more unhoused people may have chosen to list a shelter address, a family member’s address, or another location as their address when they were booked into jail. This estimate is based on only bookings from 140 jail rosters where housing status was indicated for at least one booking in the study time period. If a person was reported unhoused upon admission for any of their bookings, they were counted as “unhoused.” Because of the unique method required to standardize this indicator (it is extracted from a variety of fields by substring searching), and because it is only reported in the positive, we cannot assume that people who are not reported to be unhoused are housed; rather, we assume that they are either housed or have an “unknown” housing status. Unlike the larger sample used in other parts of this analysis, the final sample for this part included 599,423 bookings involving 457,025 individuals.  ↩

  9. The “top charge” category reflects the most serious charge from among all jail bookings for that individual. For example, if the first booking for an individual was for a criminal traffic offense and a subsequent booking three months later was for a violent offense, that person’s “top charge” category is “violent.” The charge categories are based on the CJARS Text-based Offense Classification (TOC) model and include, from most severe to least severe: violent, property, drug, public order, DUI offense, criminal traffic.  ↩

  10. In particular, the offense distribution of the static one-day population in jails is likely to differ from the offense distribution of all jail bookings over a longer time period, because charges are directly related to the likeliness of pretrial detention, and in turn, how long people stay in jail. For example, courts are likely to set higher bail amounts or deny bail for people booked on serious charges (especially charges of violence) and more likely to order release without monetary conditions for people accused of less serious charges. Additionally, less serious offenses carry shorter sentences that result in quicker release from jail even when people are convicted. Therefore, we would expect a higher proportion of “violent” and serious charges in the one-day jail population than we would across all admissions.  ↩

  11. In that analysis, the researchers considered “serious violent charges” to include murder, unspecified
    homicide, voluntary/nonnegligent manslaughter, non-vehicular manslaughter, aggravated assault, kidnapping, rape, statutory rape, lewd act with children, sexual assault, and human trafficking.  ↩

  12. As the authors of that study write, “In other words, over a 6-month period, a recently released individual originally booked on a top charge not involving serious violence can be expected to be charged with 0.02 crimes of serious violence. A recently released individual originally booked on a top charge of serious violence can be expected to be charged with 0.09 crimes of serious violence.”  ↩

  13. For more information about the data collections and web scraping process, cleaning of the data, aggregations, and other relevant methodological details used by the Jail Data Initiative, please see their documentation and methodology at https://jaildatainitiative.org/documentation/about.  ↩

  14. Across the 648 rosters, some bookings were excluded from the analysis due to potential issues with date range overlap (12,413 bookings) and issues with unique person identification (15 bookings).  ↩

  15. For more information on how the Jail Data Initiative standardized race and ethnicity across rosters, please see their documentation page at https://jaildatainitiative.org/documentation/glossary.  ↩

  16. In criminal legal system data, race and ethnicity are not always self-reported (which would be ideal). Police and jail administrators may report an individual’s race based on their own perception — or not report it at all — and the jail rosters used by Jail Data Initiative rely on administrative data, which may not reflect how individuals identify their own race or ethnicity.  ↩

  17. Gender is not always self-reported (which would be ideal) in criminal legal system data. Police and jail administrators may report an individual’s gender or sex based on their own perception — or not report it at all — and the jail rosters used by Jail Data Initiative rely on administrative data, which may not reflect how individuals identify their own gender. For more information on how the Jail Data Initiative standardized sex and gender across rosters, please see their documentation page at https://jaildatainitiative.org/documentation/glossary.  ↩

  18. While these 75 bookings could not be included in this analysis, we know that trans and non-binary are disparately impacted by the criminal legal system: In particular, Black trans people and other trans people of color face high rates of police harassment and high lifetime rates of incarceration. In jails and prisons, trans people face high rates of assault, are frequently denied healthcare, and are at high risk of being sent to solitary confinement. We suspect that because most jail systems likely operate on a gender binary (male/female), this likely represents a serious undercounting of trans and non-binary people admitted to jails.  ↩

  19. For more information on how the Jail Data Initiative standardized age across rosters, please see their documentation page at https://jaildatainitiative.org/documentation/glossary. For this analysis, we were interested in looking specifically at the jailing of older adults, so we collapsed all categories younger than 55 into one group, and all categories 55 and older into another.  ↩

  20. This ultimately results in a significant undercount of the unhoused population admitted to jail: administrative records of unhoused people may include previous addresses, shelter addresses, or addresses of family and friends and would therefore not be considered “unhoused” in jail records.  ↩

  21. Using the Criminal Justice Administrative Records System (CJARS) Text-based Offense Classification (TOC) algorithm, the Jail Data Initiative standardized the most severe charge reported for individuals into the following categories (in order of severity, from most severe to least severe):

    1. Violent
    2. Property
    3. Drug
    4. Public order
    5. DUI offense
    6. Criminal traffic

    An overall top charge category per person was determined by selecting the most severe charge from among all bookings for that individual. For more information on how the Jail Data Initiative standardized the “top charge” — or the most severe charge reported — across rosters, please see their documentation page at https://jaildatainitiative.org/documentation/glossary.  ↩

See all the footnotes


President Biden and three governors should use their clemency powers before they leave office to save the lives of people facing the death penalty, our nation’s cruelest punishment.

by Leah Wang, November 18, 2024

On December 23, 2024, President Biden announced that he was commuting the sentences of all but three people on federal death row to a sentence of life-in-prison.

On December 31, 2024, North Carolina Governor Roy Cooper commuted the sentences of 15 people on that state’s death row to a sentence of life-in-prison without the possibility of parole. This is an important step, but North Carolina continues to have one of the highest death row populations in the nation.

Every November, it has become a light-hearted tradition for the president and some governors to “pardon” turkeys before the Thanksgiving holiday, sparing them from the dinner table. But when the nation’s political leaders take part in an annual turkey pardon, it’s hard not to think about the chronic underuse of clemency1 powers across the U.S., especially for people on death row.

If turkey pardons are about choosing life over death, using clemency powers to empty remaining death rows is a straightforward way for elected leaders to act on those values and reject a horrific practice. President Biden and the outgoing governors of North Carolina, Indiana, and Missouri in particular can use clemency for those facing a state-sanctioned death before they leave office early next year. More than a dozen other governors can stop executions in their states, too, by exercising their unilateral power to modify or reduce criminal convictions and sentences at any time.

In this briefing, we show that the outgoing president and some governors’ tactless traditions of granting relief to turkeys casts a harsh light on their records of granting relief to people condemned to die. Ultimately, their legacies won’t be shaped by crass Thanksgiving rituals, but by how they tapped their power to intervene in the moral atrocity that is the death penalty.

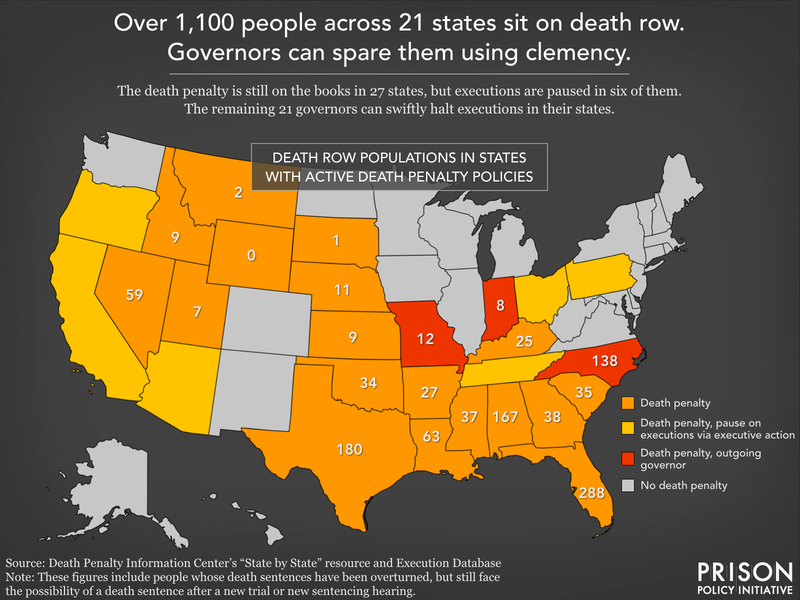
Map showing over 1,100 people on death rows in 21 states with active death penalty policies A national patchwork of policy and practice leads to a geography-based punishment system for people convicted of the most serious crimes.

Outgoing political leaders can turn the page on the death penalty

In addition to being the only irreversible punishment, the death penalty — a sentencing option still on the books in 27 states and at the federal level2 — is widely understood as the most cruel, discriminatory, and corrupt punishment, rife with due process and human rights violations. From deep racial injustice and legal misconduct, to horrific botched executions and shadowy methods of acquiring lethal drugs, to wide public opposition to many executions, the death penalty is an unpopular3 and grotesque public experiment.4 Almost half of U.S. states have already abolished the death penalty, and many victims’ families oppose it, helping to lead the way in repeal efforts.

While the following leaders have no record of sparing anyone from the death penalty, they still have several weeks to change course; it’s customary to wait to use clemency powers until the end of a political term, as a final boost to one’s legacy without the risk of political blowback. (And former leaders following custom have used clemency for people on death row, sometimes with a blanket commutation, converting all death sentences to life in prison.) But as the holiday and family-gathering season kicks off, the choice to ignore death row and spare a turkey instead is no act of festive good will.

President Joe Biden

Although he’s extended pardons and commutations during his term, President Joe Biden has yet to use his clemency powers for a person facing the federal death penalty, despite openly opposing capital punishment at one time. Biden can still heed increasing calls from advocates to improve his minimal clemency record and clear federal death row of all 40 current death sentences.

But Biden does pardon condemned turkeys, issuing a pair of pardons each year he’s been President. These fowl, by the names of Peanut Butter and Jelly (2021), Chocolate and Chip (2022), and Liberty and Bell (2023), are greeted in Washington with pomp and circumstance, and are returned to their home pastures under the care of animal experts.

Given that president-elect Donald Trump enthusiastically supports the death penalty — and has historically abused the pardon power — President Biden could spare 40 lives immediately and reclaim the true function of clemency by commuting all federal death sentences.

Governor Roy Cooper, North Carolina

Governor Roy Cooper has only used clemency sparingly throughout his eight-year term.5 But even after issuing relief to several people just before Thanksgiving — including five people convicted of murder — the outgoing governor has withheld clemency from everyone on North Carolina’s death row, which has the fifth-highest death row population as of January 2024 with 138 people condemned to die.

Governor Cooper has, however, consistently pardoned turkeys, showing mercy toward at least eight birds since he took office. During the most recent pardoning event in 2022,6 Gov. Cooper told spectators that “Thanksgiving is a time to come together and appreciate the many blessings our families, friends and communities have to offer.” These words would be just as appropriate for sparing human life.

The North Carolina Coalition for Alternatives to the Death Penalty has been in Governor Cooper’s ear since 2022, when they launched a campaign calling on him to empty the state’s death row, commuting all sentences to prison terms before his term is over. He still has time to heed their advice.

Governor Eric Holcomb, Indiana

Indiana’s Governor Holcomb has a weak record for granting clemency,7 but could spare the eight individuals on Indiana’s death row with the stroke of a pen,8 including one man scheduled to be put to death in December — resuming executions in the state after more than a decade.

Notably, Holcomb governs a state with a legacy of rethinking death sentences: According to the Indiana Public Defender Council, more than half of all death sentences handed down in the Hoosier State since 1977 have been commuted, reversed, or dismissed, with Indiana governors taking clemency action as recently as 2005. And between 2000 and 2015, few cases that initially sought the death penalty actually resulted in a death sentence.

We couldn’t find evidence of Gov. Holcomb participating in a turkey pardon during his time in office. If he refrains this year, he should have plenty of time to acknowledge Indiana’s de facto moratorium on death sentences and extend clemency to the eight people on Indiana’s “X Row.”

Governor Mike Parson, Missouri

Governor Mike Parson of Missouri is leaving office after nearly seven years with a decent clemency record,9 having cleared a backlog of over 3,500 clemency applications.10 It’s unclear, though unlikely, whether Gov. Parson has ever commuted a death sentence; the clemency data produced by the governor’s office do not include crime or sentencing information. Nor could we find evidence of Parson participating in a Thanksgiving turkey pardon.

Considering Gov. Parson’s record of harmful policies, like bans on nearly all abortions and on gender-affirming care for minors, it seems unlikely that he would consider saving the lives of the dozen men on Missouri’s death row. Parson has overseen the executions of 12 people during his tenure as governor, including the execution of Johnny Johnson, a man with serious mental illness whose clemency was supported by his victim’s own father, and Marcellus Williams, whose advocates included prosecutors and the victim’s family.

As Parson considers his gubernatorial legacy, he should continue to use his unilateral clemency power for the Missourians who deserve better than the abhorrent practice of taxpayer-funded executions.


We applaud elected leaders when they use clemency to relieve people of excessive or unnecessary criminal sentences. But too often, they overlook those given the most draconian punishment on the books. Only a consistent practice of commuting death sentences and issuing pardons can combat the horrifying persistence of the death penalty. With Thanksgiving right around the corner, and their days in office numbered, outgoing leaders can spare human beings, rather than just birds.

Footnotes

  1. Clemency is an umbrella term that refers to the ability of a governor or president to modify or reduce a person’s conviction or criminal sentence, typically via a commutation or pardon.
    A commutation amends or reduces a sentence, usually of a person who is currently incarcerated. Commutations are extremely rare and, when granted, often do not result in immediate release. When someone is actually released, they may still have to go through a lengthy period of supervised release.
    A pardon is an official expression of forgiveness for a criminal conviction. It can restore civil rights that were forfeit upon conviction, such as the right to vote or hold public office. A pardon can be granted prior to charge or conviction, or following a conviction, but the person may or may not have been incarcerated for that conviction.
     ↩

  2. Six of those states — Arizona, California, Ohio, Oregon, Pennsylvania, and Tennessee — and the federal government currently have a hold on executions due to executive action.  ↩

  3. An increasing number of Americans believe that the death penalty is applied unfairly. Meanwhile, public support for the death penalty for murder convictions has held steady around 55 percent since 2017, but is sharply divided along partisan lines.  ↩

  4. In addition to the rich resources we’ve already linked from the Death Penalty Information Center, this overview from the Equal Justice Initiative summarizes the myriad issues associated with the death penalty, including sentencing innocent people to die, the arbitrary application of the death penalty, and the astronomical fiscal cost of death penalty cases.  ↩

  5. Our friends at Families Against Mandatory Minimums (FAMM) recently called on Gov. Cooper to utilize his clemency power during his final days in office; we encourage you to read FAMM’s letter, which contains more information about how clemency can serve as a “critical check on excessive sentencing” in North Carolina.  ↩

  6. North Carolina’s annual turkey pardoning in 2023 was canceled due to avian flu concerns.  ↩

  7. According to the Collateral Consequences Resource Center, Governor Holcomb issued seven pardons in 2017, his first year in office, but he hasn’t issued any others as of August 2024.  ↩

  8. Our friends at Families Against Mandatory Minimums (FAMM) recently called on Gov. Holcomb to utilize his clemency power during his final days in office; we encourage you to read FAMM’s letter, which contains more information about how clemency can serve as a “critical check on excessive sentencing” in Indiana.  ↩

  9. Our friends at Families Against Mandatory Minimums (FAMM) recently called on Gov. Parson to utilize his clemency power during his final days in office; we encourage you to read FAMM’s letter, which contains more information about how clemency can serve as a “critical check on excessive sentencing” in Missouri.  ↩

  10. Some sources actually call the pace of Gov. Parson’s clemency work “generous” and the number of pardons he’s issued during his term earned Missouri a spot as a “Frequent/Regular” grantor of pardons by the Collateral Consequences Resource Center’s Restoration of Rights Project.  ↩


The measure would defund prevention and reentry services, and is projected to grow the state prison population by 35% over the next 5 years.

by Sarah Staudt, October 17, 2024

Update: Californians approved Proposition 36 in the November 2024 elections.

This November, Californians will see an initiative on their ballots proposing a way to curb retail theft and drug use. In reality, this measure would undo a decade of progress towards unraveling mass incarceration without any public safety benefit. Bankrolled primarily by major retail brands like Walmart and Target, the ballot initiative known as Proposition 36 would cut millions of dollars from reentry and prevention services in favor of more prison sentences for theft and drug charges. It would punish people with substance use disorder who relapse, increase penalties for many people who use and sell drugs by increasing penalties and makes some small scale thefts eligible for felony charges. Overall, by 2029, Prop 36 is projected to fully undo hard fought progress made in reducing California’s prison population.

Line chart showing Prop 36 would increase the state prison population by 35 percent over the next 5 years.

Prop 36 is part of a wave of recent measures across the country attempting to resurrect “tough-on-crime” policies. But this one is particularly concerning because it directly repeals decade-old reforms that have been proven to reduce both prison populations and recidivism. Californians who are interested in basing their criminal legal system policy on facts, not fear, should reject the measure — and other states should be on the lookout for similar efforts in their legislatures and on their ballots.

Prop 36 defunds critical prevention and reentry services

The text of Prop 36 doesn’t say it defunds prevention and reentry services, but that’s exactly what it does. In order to understand Prop 36, it’s important to examine another ballot initiative from a decade ago: Proposition 47 in 2014. Sixty percent of Californians voted for Prop 47 that year, a transformative initiative that reduced certain drug possession and theft crimes from felonies into misdemeanors. Lowering charges to misdemeanors decreases the long-term impact of criminal convictions on people’s housing and employment, and misdemeanors have shorter sentences than felonies. Changing these common low-level charges from felonies to misdemeanors dramatically lowered the prison population over time.

The most innovative part of Prop 47, however, was its re-investment provision. It required that the money saved by incarcerating fewer people be calculated by the state and then re-invested in a grant program for local reentry, diversion, substance and mental health treatment and crime prevention programs. So far, Prop 47 has saved the state almost a billion dollars, which has been funneled directly into local programs.

Now, Prop 36 will grow prison populations by reversing the sentencing policy changes of Prop 47. However, because Prop 36 has no funding stream of its own, it will cut into those same Prop 47 savings that fund essential local programs. This will leave local communities without the resources they need to reduce recidivism, house people, treat mental health and substance use disorders, and help people reenter society successfully after incarceration. In other words, it will stoke many of the problems that have fueled tough-on-crime narratives in the first place: fewer reentry programs mean higher recidivism rates, higher homelessness rates, and lower employment rates. Re-conviction rates for participants in Prop 47 reentry programs were 15.3% — 2-3 times lower than the average for people who have served prison sentences. The proportion of Prop 47 reentry participants who were homeless decreased by 60%, and the proportion of people who were unemployed dropped by 50%. These programs are demonstrably effective and essential public safety measures that address homelessness and poverty while reducing crime.

Prop 36 will directly harm Californians, especially those who use drugs

Prop 36 would raise the prison population by filling jails and prisons mostly with people charged with low-level theft and drug possession, while also draining resources from local community programs, and providing less effective treatment for people with substance use disorders and lengthening prison terms.

Draining resources: Prop 36’s proponents claim that they are promoting treatment for drug use even though the proposition drains funding from substance use programs. Instead of helping increase the availability of desperately-needed substance use disorder treatment, Prop 36 is an unfunded mandate, allowing prosecutors to seek “treatment mandated felonies” for people who are charged for a third time with drug possession without providing the funding to make that treatment possible. People who successfully complete these treatment mandates could have their charges dismissed, but people who do not successfully complete these programs would be convicted of a felony and potentially sentenced to prison or jail. And remember, Prop 36 does not do anything to fund these mandatory programs, so cash-strapped county governments will be left to pick up the slack.

Less effective treatment: One concerning feature of drug courts and similar mandatory treatment programs is that they put the rules and regulations of treatment programs in the hands of the courts, not medical professionals. People in community-based voluntary programs work with medical professionals who understand that relapse is part of recovery, while people in court-mandated programs may be labeled as a failure for one relapse and incarcerated. The proposition’s language allows courts and prosecutors to declare that the person has “failed” the program for incredibly broad reasons, including, “If at any time, it appears that the defendant is performing unsatisfactorily in the program, is not benefitting from treatment [or] is not amenable to treatment.”

Mandatory treatment programs are significantly less effective than voluntary treatment programs, and they have higher rates of relapse and overdose deaths. A recent review of 45 studies linking incarceration records with overdose deaths found that, in the first two weeks of release from mandatory treatment programs, opioid overdose deaths were 27 times higher than the general population. People in mandatory treatment programs often spend time in jail, either while awaiting evaluation or as a sanction for relapse and other violations. Even one day in jail can trigger a cascade of problems that are particularly acute for drug users — including heightened risk of death and suicide. Jail also disconnects them from effective treatment: only 24% of jails provide medication assisted treatment (considered the “gold standard” for opioid use disorder care).

Longer sentences: Prop 36 also increases penalties for many people who use and sell drugs by implementing sentencing enhancements for distribution and possession with intent to distribute fentanyl. The impact of expanding these excessively long sentencing enhancements to fentanyl could be disastrous, because fentanyl is so prevalent in the drug supply that most people who buy, use, and sell drugs do not know whether their drugs contain fentanyl. In one recent study, 83% of the study cohort tested positive for fentanyl — but only 18% reported that they intended to use fentanyl. This means that these sentencing enhancements will not just target the people putting fentanyl into the drug supply — they will target the majority of drug users. Prop 36 is likely to simply increase drug offense penalties across the board for Californians, rather than aiming policy at “the worst of the worst”.

Prop 36 would make California’s already-punitive theft laws harsher, locking up more people for low-level theft.

Prop 36 claims to be a response to rising retail theft, and two of the biggest donors supporting the initiative are Walmart and Target. Although retailers have worked hard to claim they are losing large amounts of money and goods from retail theft, it is far from clear that this is true.

What Prop 36 would actually do is make thefts of less than $950 dollars — with no minimum — a “strike” for the purposes of future felony charges. In other words, stealing a candy bar at some point would be enough to enhance someone’s later charge to a felony. Incarcerating more people for retail theft is likely to have notably disproportionate impacts, since people arrested for retail theft are disproportionately young and Black despite white people being more likely to engage in shoplifting. Turning more theft and drug charges into felonies instead of misdemeanors also specifically harms immigrant communities by making more people deportable for minor crimes — even people who are legally in the United States.

These changes aren’t necessary, even according to their own logic. California already has one of the lowest thresholds for felony theft in the nation, and just last month, Governor Gavin Newsom signed a series of “tough on crime” retail theft bills that allow businesses to aggregate the total amount stolen in multiple thefts to reach felony charging thresholds. Prop 36’s draconian punishment for a non-violent crime — crime that is driven most often by poverty and need — is neither needed nor helpful.

Conclusion

Prop 36 is not an isolated policy effort. It is part of a wave of measures across the country that are trying to resurrect “tough on crime” policies that claim to improve public safety or combat drug use or homelessness. But those approaches didn’t work in the past and won’t work now. What communities all over the United States need is more investment in communities, treatment, and reentry — the exact kind of investment that Prop 47 provides in California today, and the exact kind of investment that Prop 36 would undo. If you are interested in learning more about the efforts to defeat Prop 36, California United for a Responsible Budget has compiled a set of resources and ways to get involved. Californians — and people around the country — should reject punitive policies that will simply reboot mass incarceration instead of investing in proven solutions.


In our new annual report, we share examples of how we empower the reform movement with the data it needs to counter “tough on crime” narratives

by Danielle Squillante, October 16, 2024

We wrapped up another busy year at the Prison Policy Initiative, and are thrilled to share our 2023-2024 Annual Report with you. We released 7 major reports, 32 research briefings, and two guides for journalists to support further investigative work on issues related to mass incarceration. We also provided technical support to advocates at the state and local levels working on issues such as ending prison gerrymandering, parole reform and fighting jail expansion. Here are a handful of accomplishments we’re particularly proud of:

This is only a snapshot of what we produced this past year. We are proud of our accomplishments and look forward to sharing new projects with you in the year to come.


October 15, 2024

Easthampton, Mass. A new report from the Prison Policy Initiative provides one of the most comprehensive 50-state compilations of “standard” conditions of probation to date, shining a light on the burdensome rules that govern the lives of nearly 3 million people and that doom many to inevitable further punishments. The report, One Size Fits None, and accompanying data organize probation rules from 76 jurisdictions into topical categories — allowing readers to compare rules in their state to other states, and exposing how these systems turn even everyday behaviors into acceptable reasons for re-incarceration.

For those unfamiliar with probation, the report serves as an accessible introduction to “standard conditions,” the rules that everyone under supervision in a given jurisdiction must follow. One Size Fits None answers questions like:

  • What aspects of people’s lives do probation rules typically address?
  • In which states are standard conditions of probation set at the state versus the local level?
  • What types of probation rules are at the discretion of probation officers to define?
  • How do standard conditions intersect with the life circumstances of people most likely to be on probation, including low-income people and people with mental health conditions or substance use disorders?

“Our analysis of 76 jurisdictions finds that people on probation must abide by 12 standard conditions every day, on average, plus any special conditions that a judge or an officer imposes,” said report author Emily Widra. “These rules are rigidly applied across the board, and have serious consequences for people who are already marginalized along lines of race, class, and disability.”

The report dives into the most common themes that standard conditions of probation fall under, including:

  • Financial requirements: In 64 out of 76 jurisdictions analyzed by the Prison Policy Initiative, probation rules require people to make regular payments, including monthly fees, drug testing or other treatment fees, or mandated support of legal dependents.
  • Rules impacting employment: Despite more than 60 jurisdictions requiring people on probation to maintain full-time employment or the pursuit of “a course of study or vocational training,” most jurisdictions also impose rules that make it harder for people to get and keep a job.
  • Movement restrictions: Almost all of the 76 jurisdictions studied restrict where people on probation can go, and 21 jurisdictions restrict people’s movements to within a county or district.
  • Association restrictions: At least 31 jurisdictions in the sample have rules restricting social relationships with categories of people. Only one — Arkansas — clarifies that unavoidable associations via work or treatment programs are not prohibited.
  • Other, vague conditions that expand criminalization, including stipulations to “be good,” “be truthful,” and “devote yourself” to work or education.

One Size Fits None issues sweeping recommendations to state and local lawmakers who wish to ensure that probation rules work toward, rather than against, the goals of probation. The recommendations urge states to reduce their use of probation overall, change how rule violations are treated, and pare down standard conditions to the essentials — eliminating those that are unnecessary and ineffective. The report also includes a sidebar highlighting jurisdictions that are working to reduce probation revocations.

“Probation conditions today are not only burdensome; they are often in conflict with one another, which puts people in impossible situations where violations are unavoidable,” said Widra. “Rather than continue with this counterproductive system, states and counties must rethink their standard conditions so that people are allowed to succeed.”

Access the full report at https://www.prisonpolicy.org/reports/probation_conditions.html.


In Indian country jails, populations have rebounded from pandemic lows, the detention of women and older adults is increasing, and new offense type data raise questions about why so many people are incarcerated on tribal lands.

by Emily Widra, October 8, 2024

Native people are consistently overrepresented in the criminal legal system, accounting for only 1% of the total U.S. population but 3% of the incarcerated population.1 More specifically, the national incarceration rate of Native people is between two and four times higher than that of white people. Now, newly released data on jails in Indian country in 2023 provide more detail on this disturbing disparity: the Bureau of Justice Statistics (BJS) reports that, much like other jails across the country, Indian country jail populations are quickly bouncing back from the lows of the COVID-19 pandemic, and this growth has disproportionately impacted women and older adults.2

The Bureau of Justice Statistics (BJS) collects and publishes data about jail facilities on Native land separately — and with differing kinds of details — from other locally-operated jails across the country.3 In this iteration of the BJS survey on Indian country jails, the bureau collected new, more detailed information about offense types that are crucial to understanding the role of jails on Native land. They also reveal the troubling overuse of jails in response to non-criminal behaviors for youth and adults.

Two charts showing overall population increase in Indian country jails 1999-2023 and percent increase in Indian country jail population compared to increase in local jail populations from 2020 to 2023. Jail populations in Indian country — like in jails across the country — were generally trending upward before a sharp decrease during 2020, which was the result of fewer arrests and slowed court processes during the pandemic; they have quickly resumed their upward trajectories in the years since.

Indian country jail populations continue to rise after COVID-19

Jail populations across the country — including local and Indian country jails — dropped dramatically during the first year of the COVID-19 pandemic (30% from 2019 to 2020). This temporary decline was primarily explained by fewer people being arrested and booked into jails, as well as slowed court processes. In 2020, Indian country jails saw their first decline in total jail populations since 2013.4 But jail populations on Native land and across the country quickly surged after the first year of the pandemic: from 2020 to 2023, the Indian country jail population grew by 19%, consistent with the 21% growth seen in local jail populations nationwide over the same time period. However, from 2022 to 2023, other local jail populations only ticked up by 0.2%, while the Indian country jail population rose by 7% over that single-year period. In other words, while rebounds in local jail populations are slowing, Indian country jail populations are rising more dramatically.

Women and older adults increasingly incarcerated in Indian country jails

Much like other parts of the criminal legal system, the growth of the women’s and older adult populations in Indian country jails has outpaced the growth among men and younger adults.

Two charts showing percent increase in Indian country jail populations by gender (2020-2023) and by age group (2021 to 2023).

Women: Native women are disproportionately affected by almost every part of the criminal legal system. They are incarcerated at higher rates than women of any other racial or ethnic group. Additionally, women account for a larger portion of the Indian country jail population than they do in other local jails across the nation: in 2023, women represented over a quarter (26%) of adults incarcerated in Indian country jails, but only 14% of people incarcerated in other local jails. In the last three years, the number of adult women in Indian country jails has grown 37%, compared to only 15% for men. Prior to the COVID-19 pandemic, however, we saw this dynamic in reverse: from 2016-2019, the number of women in Indian country jails only rose by 5%, while the number of men rose by 19%. This suggests an alarming shift in the incarceration trends of women in Indian country since the pandemic began, in line with the escalating incarceration rates of women throughout the nation.

Older adults: There are limited historical data on the age of people incarcerated in Indian country jails: the Bureau of Justice Statistics only began collecting and publishing this information in 2021. But over this three-year period, the rise in the number of older adults incarcerated in Indian country jails has been consistent with national trends: between 2021 and 2023, the number of people 55 and older in Indian country jails grew by 38%, while the number of adults under 55 years old only grew by 9%. To be sure, these populations are fairly small in scale — the overall population increase from 2021 to 2023 was 220 people — but any upward trend in the incarceration of older people is worth examining.

Jailing increasing numbers of older adults is part of a terrible national trend of policing unhoused people, poor people, people who use drugs and alcohol, and people with cognitive disabilities. Housing instability, chronic diseases, poverty, and substance use all disproportionately impact Native people, and older Native adults are particularly vulnerable to arrest, detention, and the serious and harmful consequences of incarceration.

New offense data reveals troubling trends on the overuse of jails in Indian country

This iteration of the Jails in Indian Country series provides more data than previous years, including more specific categorizations of the offenses for which people have been detained. These additional details are welcome, especially in light of the limited offense data among jail populations in general.5 In previous years, large portions of the Indian country jail population were lumped together in an “other unspecified” offense category. In 2022, for example, 29% of offenses reported to the BJS were “other unspecified,” and this catchall category has been as high as 37% of offenses in 2015. The inclusion of additional offense categories6 in the most recent survey significantly reduced “other unspecified” offenses to only 8% of the total. Additionally, this is the first iteration of the survey to include mental health and civil commitment holds, unspecified warrants, and status offenses for youth. These additions clarify what’s driving population growth in Indian country jails, while illuminating troubling trends about the overuse of these jails at the same time:

  • Holds: The addition of the mental health and civil commitment holds7 in Indian country jails offers new insight into how often jails are used for questionable reasons. As we’ve argued before, detainers and “holds” contribute to unnecessary jailing, often keeping people in detention longer than necessary while awaiting psychiatric treatment or substance use treatment. Given the heightened prevalence of substance use disorders among Native people,8 the fact that people are in jail for mental health and civil commitment holds instead of receiving crucial healthcare reflects a serious dearth of treatment access on Native land.
  • Unspecified warrants: About 20% of people in Indian country jails are detained for warrants without a specified offense. Many of these detentions are likely for bench warrants related to a “failure to appear” in court given the lack of specific offense data. We know that many court responses to “failure to appear” — including jailing — do not actually promote public safety and are often a misuse of resources. That’s because most people who “fail to appear” are not actually evading justice or threatening public safety: nationally, 87% of people who miss criminal court dates are facing “nonviolent” charges for property, drug, and public order offenses. Considering around a quarter of all cases are eventually dismissed, many people who miss court face punishment even though they would likely not be convicted of the alleged crime that brought them into contact with the system in the first place.
  • Youth status offenses: More than 1 in 10 youth in Indian country jails are held for a status offense, or a “noncriminal act that is considered a law violation only because of a youth’s status as a minor.” This can include missing school, underage drinking, violating curfew, or running away. Native youth are disproportionately represented in status offenses across the country: in 2021, Native youth accounted for 4% of all status offense cases in juvenile court, while only 1.3% of the total U.S. population is Native. Status offenses carry serious consequences beyond jail detention: in 2021, 1,400 youth with status offenses were ordered to out-of-home placements including youth prisons, residential treatment, or group homes, separating them from family and community support systems.
  • “Crimes against vulnerable populations:” In this iteration of the survey, a sample of jails in Indian country were asked to report if they had any admissions (but not the actual number of admissions) for “crimes against vulnerable populations,” including human trafficking, kidnapping, or elder abuse over the course of a single month (June 2023). The Bureau of Justice Statistics (BJS) characterizes these additional questions as responsive to the “interest expressed by Congress, tribal leaders, and federal agencies” to illuminate “the types of persons being held.” At least 17% of all Indian country jails report admitting at least one person for elder abuse and at least 6% of Indian country jails reported admitting someone for kidnapping, while no facilities reported admissions for human trafficking in that month.9 We hope to see further innovations in future iterations and in the larger national BJS surveys as well. For now, it’s hard to put these findings in any kind of context as there is little data on the prevalence of these types of victimization, nor any detail about the people held on these charges in Indian country facilities.

Conclusion

The inclusion of new, more detailed data on jails in Indian country offers the public important insights into the incarceration of Native people on tribal lands. While these trends mirror what’s happening in jails elsewhere across the country, having this level of detail is nonetheless crucial to understanding how the criminal legal system impacts Native people and communities.

More transparency must be provided in the coming years to better inform and target advocacy that reduces Native incarceration and confronts glaring racial disparities in the criminal legal system. This is especially true considering much of this data has only become available in recent years, unfortunately limiting the historical record of Native incarceration.

Ultimately, we hope the Bureau of Justice Statistics will continue and expand the collection and dissemination of such detailed information — including detailed offense and demographic data — for people in Indian country jails and jails across the nation.

Footnotes

  1. Throughout this briefing, “Native” refers to people identified by the Census Bureau as “American Indian/Alaska Native.” For a detailed discussion of how the flawed single-race categorization system obscures data on Native people throughout the criminal legal system, see our profile page on Native incarceration in the U.S.  ↩

  2. “Indian country” — with a lowercase “c” — is a legal and administrative term used in federal law (18 U.S.C. §1151) to refer to Native lands, including reservations, trust lands, and restricted fee lands in order to define the boundaries of political and legal authority. For more detail about the differences between Indian country and other related terms, see this resource from the Center for Indian Country Development.  ↩

  3. Jails in Indian country include all known adult and juvenile jails, confinement facilities, detention centers, and other correctional facilities operated by tribal authorities or the U.S. Department of the Interior’s Bureau of Indian Affairs (BIA). The BIA Office of Justice Services staffs and operates about a quarter of jails in Indian country, while the remainder are operated by Tribes.  ↩

  4. All prior annual decreases in the Indian country jail population were relatively small, with drops of 3% (74 people) in 2013, 3% (57 people) in 2010, and 4% (81 people) in 2004. The largest annual population reduction in Indian country jails that we know of took place from 2002 to 2003, when the population fell by 9% (180 people).  ↩

  5. The most recent offense-specific national jail data published by BJS was included in the 2002 Survey of Inmates in Local Jails.  ↩

  6. These additional offense specifications are all in the “nonviolent and other holds” category, and include motor vehicle theft, malicious destruction of property/vandalism, status offense (for youth), warrants, and mental health/civil commitment holds.  ↩

  7. Mental health and civil commitment holds are not criminal offense types; people detained for involuntary mental health holds may have underlying criminal charges, but are jailed because of their mental condition. Such holds can be extremely dangerous because jails are no place for people in a mental health crisis. “Civil commitment” is a broad category that most often refers to the court-ordered treatment of people with mental health or substance use disorders; however, many people end up locked up in jail rather than receiving the relevant treatment ordered by the court. Civil commitment can also refer to the post-prison confinement of people convicted of sex-related offenses in prison-like civil commitment facilities.
     
    For more information about what mental health and civil commitment holds can look like, and the disastrous consequences of jailing people in crisis, see ProPublica’s investigation of Phillip Garcia’s 2017 death in Riverside County Jail.
     ↩

  8. Rates of substance use disorders — and alcohol use disorder in particular — are extremely high among American Indian or Alaska Native people: from 2015 to 2019, over 12% of Native people meet the criteria for a substance use disorder, compared to only 8% of white people and Black people.  ↩

  9. Only 69 of Indian country jails eligible for survey participation (86%) responded to the relevant questions about “crimes against vulnerable populations.” Out of the 69 facilities that responded, 20% reported admissions for elder abuse and 7% reported admissions for kidnapping in June 2023. Applying these percentages to all 80 Indian country facilities participating in the Annual Survey of Jails in Indian Country, we find that 17% of jails reported admissions for elder abuse and 6% reported admissions for kidnapping.  ↩


Stay Informed


Get the latest updates:


Share on 𝕏 Donate


Events

Not near you?
Invite us to your city, college or organization.