Can you help us sustain this work?
Thank you,
Peter Wagner, Executive Director Donate
Punishment Beyond Prisons 2023:
Incarceration and supervision by state
by Leah Wang
May 2023
Press release
The U.S. has a staggering 1.9 million people behind bars, but even this number doesn’t capture the true reach of the criminal legal system. It’s more accurate to look at the 5.5 million people under all of the nation’s mass punishment systems,1 which include not only incarceration but also probation and parole.
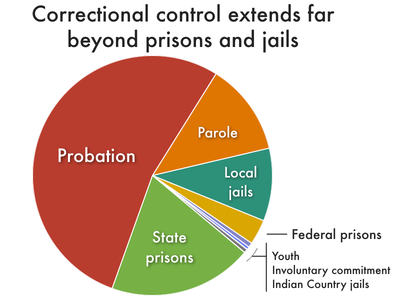
Altogether, an estimated 3.7 million adults are under community supervision (sometimes called community corrections) — nearly twice the number of people who are incarcerated in jails and prisons combined. The vast majority of people under supervision are on probation (2.9 million people), and over 800,000 people are on parole. 2 Yet despite the massive number of people under supervision, parole and probation do not receive nearly as much attention as incarceration. Policymakers and the public must understand how deeply linked these systems are to mass incarceration to ensure that these “alternatives” to incarceration aren’t simply expanding it.
We’ve designed this report specifically to allow state policymakers and residents to assess the scale and scope of their entire correctional systems. Our findings raise the question of whether community supervision systems are working as intended or whether they simply funnel people into prisons and jails — or are even replicating prison conditions in the community.3 The report encourages policymakers and advocates to consider how many people under correctional control don’t need to be locked up or monitored at all, and whether high-need individuals are receiving necessary services or only sanctions.
In this update to our 2018 report, we compile data for all 50 states and D.C. on federal and state prisons, local jails, jails in Indian Country, probation, and parole. We also include data on punishment systems that are adjacent to the criminal legal system: youth confinement and involuntary commitment.4 Because these systems often mirror and even work in tandem with the criminal legal system, we include them in this broader view of mass punishment. We make the data accessible in one nationwide chart, 100+ state-specific pie charts and a data appendix, and discuss how the scale and harms of these systems can be minimized.
The state of mass supervision in the United States
Nationwide, over 5.5 million adults — or 1 in 61 — are under some form of correctional control, whether incarcerated or under community supervision.5 To get a sense of how massive community supervision systems are, consider: If the population under probation and parole alone were its own state, it would be nearly the size of Oklahoma, and more populous than 22 other states, Puerto Rico, and D.C. And while the massive scale of probation (2.9 million) dwarfs the parole population (803,000), there are nearly as many people on parole as there are in federal prisons and local jails combined. Mass incarceration is in many ways fueled by these systems of mass supervision, even though they are typically billed as “alternatives.”
We often hear about probation as a “lenient” sentence for someone facing possible time behind bars, and about parole as the act of a benevolent parole board, allowing an incarcerated person to be released before completing their maximum sentence. These one-dimensional views trick us into seeing these systems as entirely separate from incarceration, but they’re deeply linked. Staying in compliance with dozens of high-stakes, arbitrary rules is so unmanageable that experts call community supervision systems “a deprivation of liberty in their own right.” Moreover, probation and parole are often pathways into incarceration from the community, with violations of supervision accounting for 42% of prison admissions nationwide.6
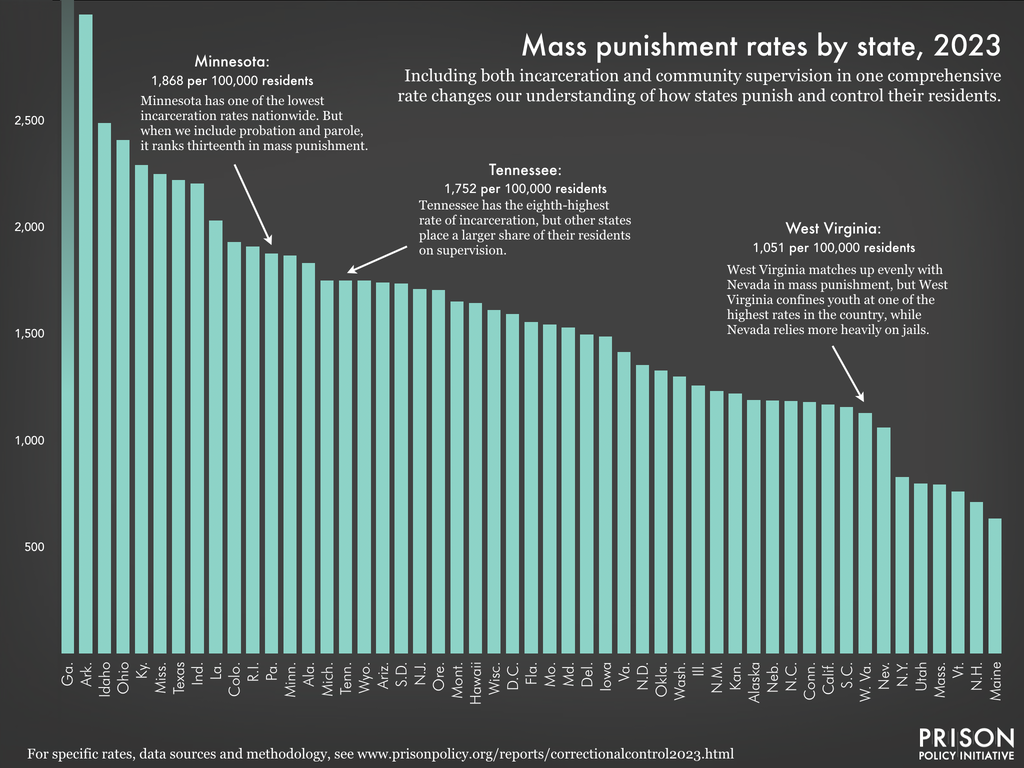
Understanding how each state fares in probation and parole in addition to its systems of confinement gives us a more accurate and complete picture of its reliance on punishment. Notably, some of the states that are the least likely to send people to prison are among the most punitive when other methods of correctional control are taken into account:
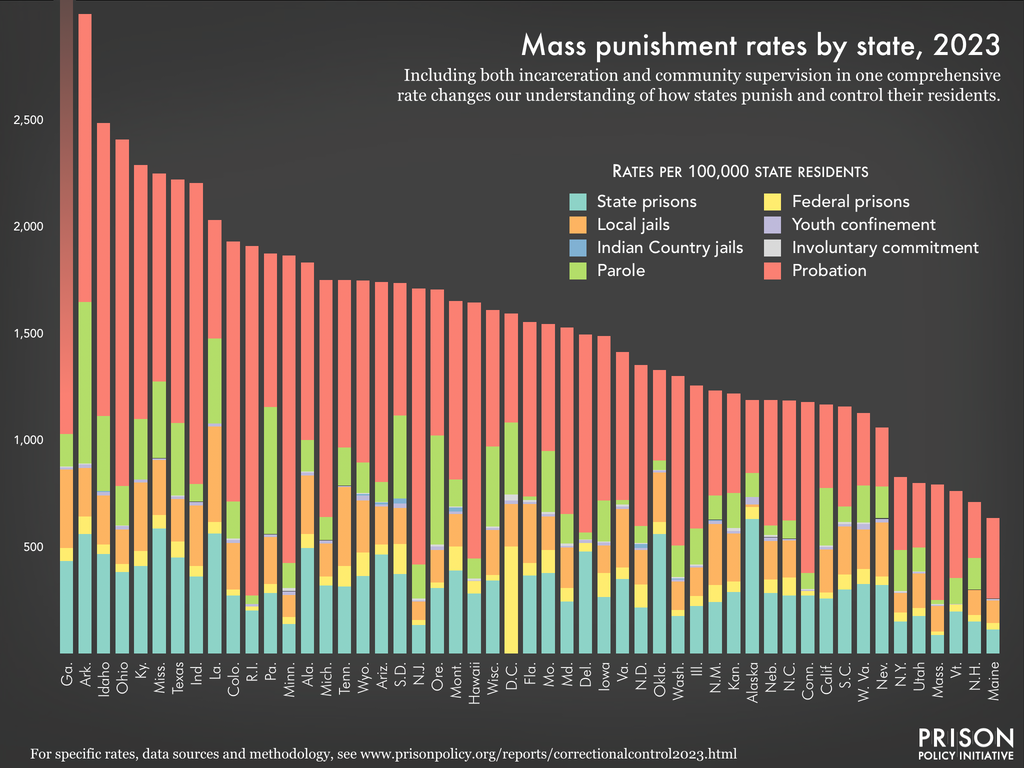
Looking closely at state variations in the use of various forms of correctional control reveals just how differently states mete out punishments; in particular, states vary tremendously in their use of community supervision.
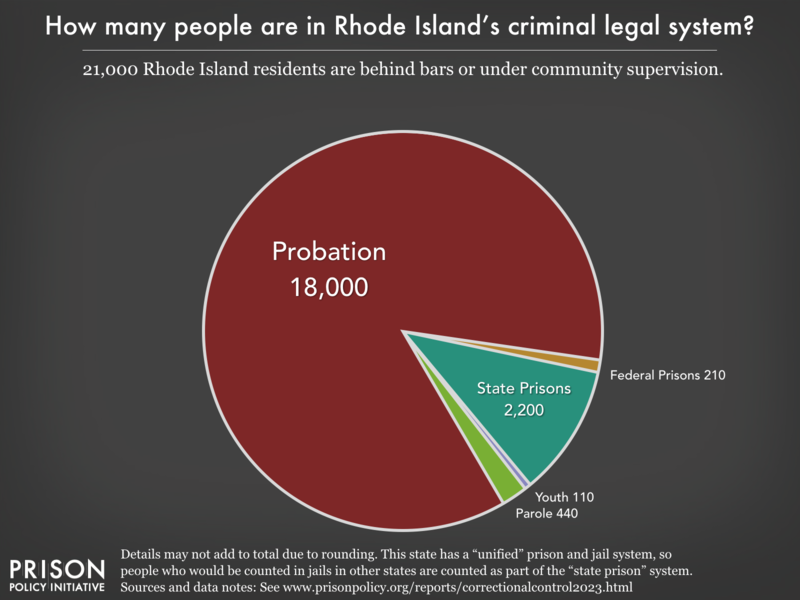
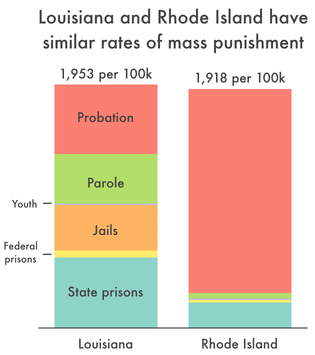
For example, Rhode Island, a so-called ‘progressive’ state below the national average of 566 per 100,000 residents when it comes to incarceration, is among the most punitive in the nation when you look at its full system of correctional control.
See the data for another state:
This graphic shows how many people are in different kinds of correctional control in Rhode Island. (We also made a graphic showing just the number of people in Rhode Island in different types of correctional facilities and confinement that some readers may find useful.)
Among the 50 states and D.C., Rhode Island ranks 10th in mass punishment, subjecting 1,911 per 100,000 of its residents to confinement or community supervision.
Considering each state’s total mass punishment system leads to other insights:
- Massachusetts and Utah have nearly identical rates of overall correctional control, but 69% of people in Massachusetts’ punishment systems are on probation, and only 28% are incarcerated in state, federal, and local jails. In Utah, on the other hand, only 39% are on probation, and a much larger share (46%) are incarcerated.
- Georgia is unfortunately well-rounded in its practice of mass punishment, with the fourth-highest incarceration rate nationwide (between Arkansas and Oklahoma) but a probation rate that eclipses all other states.7
- Residents of New Jersey (1,712 per 100,000 under correctional control) are more than twice as likely to be caught up in their state’s mass punishment system compared to New York residents (830 per 100,000).
- Minnesota has a larger share of its population under correctional control than Alabama does, even though a resident of Minnesota is far less likely to be incarcerated than a resident of Alabama.
- Because of its large probation system, Rhode Island’s total correctional control rate rivals that of Louisiana, one of the most notoriously punitive states in the country (with the nation’s highest incarceration rate).
Shrinking the system, or squeezing the balloon? Changes in the community supervision population over time
It’s important to note that despite their massive size, community supervision populations nationwide have been shrinking for the past 15 years, driven by changes in probation. In fact, the total supervised population has dropped steadily since peaking in 2007; in 2021, there were fewer people on probation or parole than there had been since 1994. In the five years since our last version of this report, probation populations have shrunk by 19% nationwide. Of course, these trends vary greatly by state. Over those same five years, the number of people on probation grew 35% in Arkansas and 13% in Kentucky; probation populations grew by smaller proportions in four other states.8 Meanwhile, just two large states accounted for almost a quarter of the national drop, with Pennsylvania and California each cutting over 80,000 people from probation from 2016 to 2021.
By contrast, parole populations had been trending upward before the pandemic, growing 21% from 2000-2019. But during the first two years of the pandemic, the parole population made a significant turn, dropping by 7% in just one year. This recent decrease is notable and deserves further attention from state policymakers, who should ask why: Did more people successfully complete and exit parole supervision? Did state agencies revoke more people on parole and send them back to prison? Did parole boards release fewer people on parole?
Changes in probation and parole populations are not inherently bad: Increases may signify that states are moving people out of prisons, and decreases may signify that states are lowering barriers to successfully completing a supervision term, such as by capping term lengths, reducing unnecessary conditions, and using non-carceral sanctions for violations. On the other hand, increases could indicate that more people are being placed on supervision who would not have been previously (an effect called “net-widening”), or that people are being kept on supervision for longer terms. Similarly, reductions in supervision populations could be the result of more punitive sentencing (i.e., to jail), more punitive responses to violations (again, to incarceration), or fewer discretionary releases. In either case, advocates and policymakers equipped with state-level trends will be able to fight for changes that reduce the unintended harms of community supervision: unaffordable fees, burdensome conditions, and the use of incarceration for noncriminal violations.
Why probation and parole don’t “work” for so many — and often lead to incarceration
In theory, probation and parole are important tools that can reduce the number of people in prison and jail, where conditions are often dangerous. However, community supervision too often sets people up to fail, with incredibly high stakes. Failure can mean going to jail or prison for being accused of a new crime, no matter how minor, for struggling to follow vague and wide-ranging rules, or for simply not being able to pay monthly fees, restitution, or other legal-financial obligations.9 These “failures” are so common that less than half (44%) of people who “exited” parole or probation in 2021 did so after successfully completing their supervision terms; the rest came off of supervision for unhappier reasons.10 Many people exit supervision when their status is revoked, usually after a violation, which typically means a period of incarceration. In 2021, over 230,000 people shifted from community supervision into a prison or jail. This practice doesn’t just extract wealth from the poor, but wastes all taxpayers’ money: In 41 states covered in a study by the Council of State Governments Justice Center, people returning to prison from probation or parole cost those states more than $8 billion in 2021.11
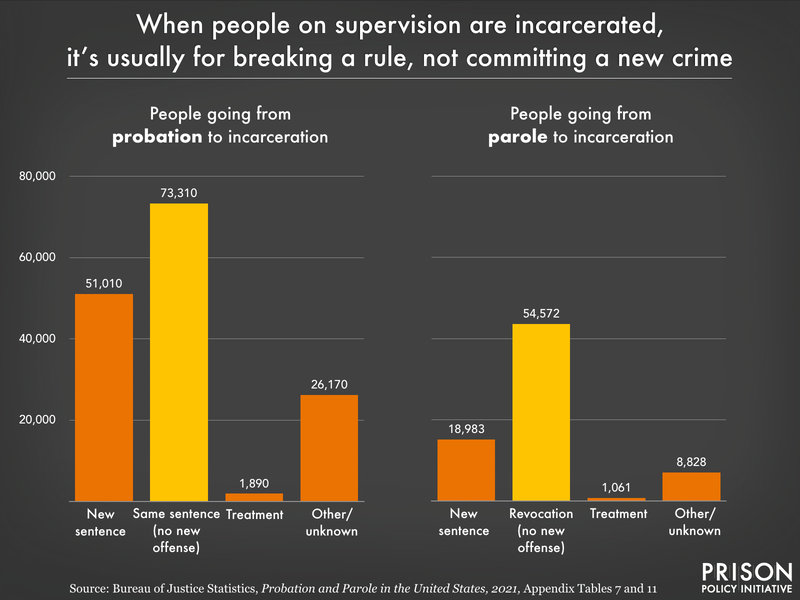
We’ve long argued that noncriminal behaviors (like missed check-ins or nonpayment of fees) should not lead to incarceration — this strips people of any progress they’ve made, further destabilizes them and their families, and is a thoughtless use of public funds. Probation and parole officials can use more effective alternative sanctions and approaches, such as incentive-based systems, but too many continue to default to a “lock ‘em up” response.
Each state approaches supervision violations differently, but some rely on incarceration as a response more than others:
- Tennessee’s jails hold 9,280 people for an alleged violation of supervision, accounting for 30% of the total jail population;
- In both Georgia and West Virginia, over 15,000 people — 28% of the jail population — are behind bars for supervision violations;
- An alarming 39% of the jail population in Ohio is composed of people accused of violating the rules of their supervision.
Beyond the threat of jail time, other aspects of how community supervision is designed make little sense for people trying to get back on their feet. For starters, people under supervision must comply with numerous conditions. Too often, these conditions are unrelated to the original offense, including the bizarre and controversial. People on probation must comply with up to 20 requirements per day12 in order to remain in good standing. The prohibition on “associating” with others who have felony convictions or criminal records at all is an especially harsh and counterproductive condition, given the sheer number of people with records and the importance of social networks in obtaining employment, housing, and other necessities.
These conditions mean living under constant scrutiny and serve as a tripwire to harsher punishments. For example, required interactions with (and surprise visits from) parole and probation officers often lead to the detection of low-level “offending,” like drug use, or noncriminal, “technical” violations such as breaking a curfew. Appropriate responses to these might be fines, community service, drug treatment programs, or no criminal justice response at all. However, for people under supervision who are incarcerated for violations, the consequences are steep: jail time also means job loss, housing instability, difficulty caring for children and elders, interruptions in healthcare, and a host of other collateral consequences.
Probation and parole also affect already-marginalized populations in troubling ways:
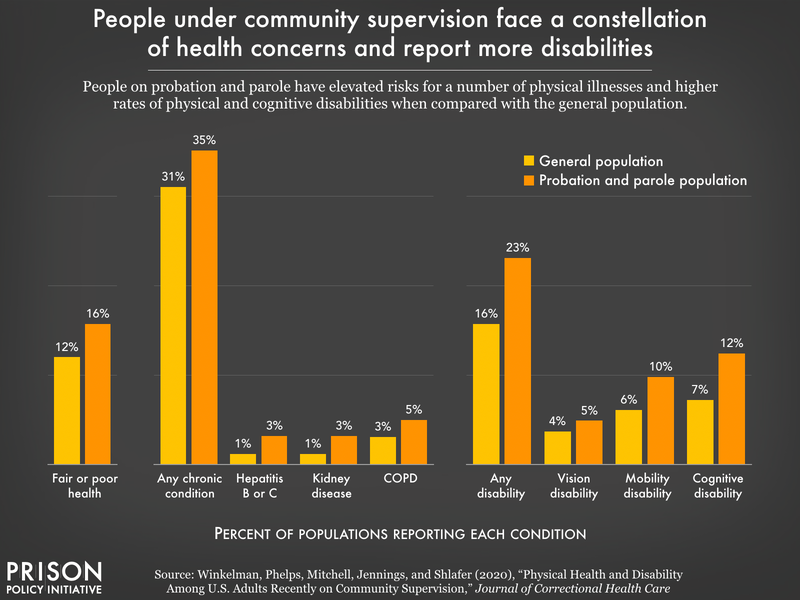
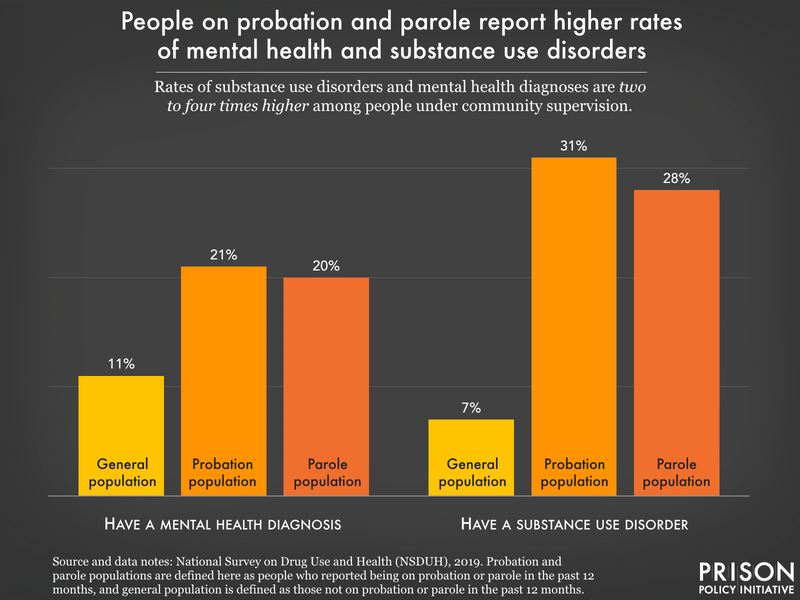
- People under community supervision are in poorer health than the general public, with significantly higher rates of mental illness, chronic conditions, and substance use disorders than the general public. And supervised people — not unlike incarcerated people — often don’t receive appropriate care, whether due to lack of health insurance coverage or because health care providers don’t always take criminal legal system contact into account. A public health approach to common struggles of people on probation and parole, as opposed to a punitive one, will be critical to raising the rate of “successful” exits from supervision.
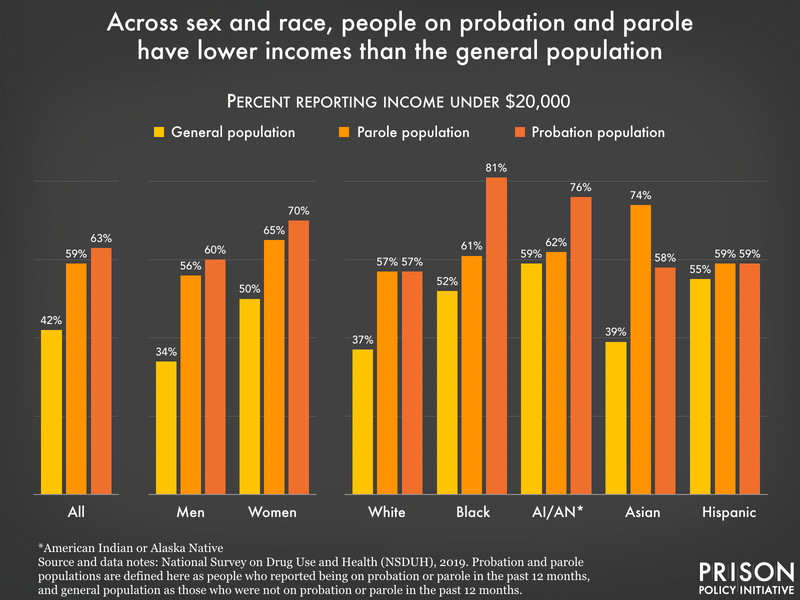
- Parole and probation fees are an enormous burden. People on supervision are overwhelmingly poor; supervision fees, often owed monthly for years, do nothing to further the missions of probation services departments, serving only as a violation waiting to happen. Similarly, charging people who can’t afford to pay for regular urinalysis tests, electronic monitoring devices, required programs, and other costs associated with their supervision only makes it harder for them to succeed.
- Supervision comes down hardest on Black Americans. Black Americans make up over 30% of those under community supervision, but just 12% of the U.S. adult population.13 They are also more likely to have their probation revoked than similar white and Hispanic Americans.
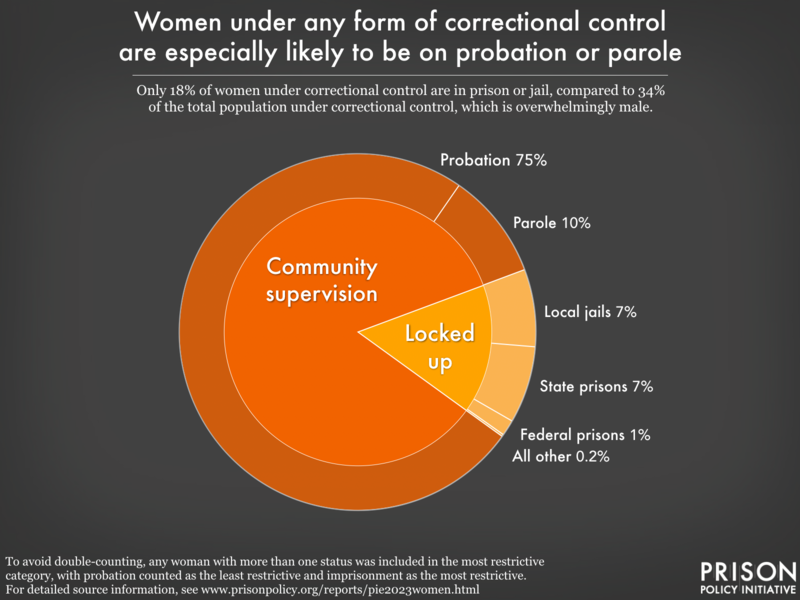
- For women, compliance with rigid rules and schedules is nearly impossible. For supervised women, the vast majority of whom (89%) are on probation, complying with conditions that involve travel and program participation can be particularly difficult due to family caregiving obligations, such as finding or paying for child- or elder-care so they can go to a meeting or required class. Formerly incarcerated women are also more likely to be homeless compared to similarly situated men, making reentry and compliance with supervision even more difficult.
With sweeping changes, parole and probation could be used as tools for decarceration
Our analysis shows that correctional systems exert control over the daily lives of millions of people, many of whom need help instead. While prisons and jails warehouse the most marginalized people with the fewest resources, probation and parole systems receive many of those same people who need social services, not strict conditions and outrageous fees. Supervision anticipates (and responds to) failure rather than success, resulting in a “revolving door” that burdens taxpayers and tears apart families.
But it doesn’t have to be this way. Probation and parole systems, in particular, can be redesigned to help people exit the mass punishment system for good. States should invest in strategies to make these systems tools for decarceration rather than engines for incarceration. Parole should be used as a tool for shortening lengthy sentences, probation solely as an alternative to incarceration, and both should successfully set people up for a stable life. If state lawmakers are serious about criminal legal system reform, they must commit to having people released to supervision being in the care of, and not the effective custody of, state and community-based social service agencies — and only for a limited amount of time, under the least restrictive conditions possible.
To reform probation, prioritize highest-need cases and end the rest
Probation is, by design, an important diversion from incarceration. In cases where incarceration is the only practical alternative, the use of probation should be encouraged to minimize the broad social and economic harms of being locked up. At the same time, probation must not be a knee-jerk response to very minor crimes and “quality-of-life issues” and should prevent incarceration rather than just delaying it.
And when probation is reserved for people who are at a high risk of committing a crime and who require the most support, the savings derived from a smaller probation population can allow for reinvestment in community-based, voluntary services that can coexist with someone’s work, education, or parenting obligations.
In addition to reducing the use of probation, states must also focus on conditions, length, and collateral consequences of probation. New York, for example, has shown that serious probation reform is possible, without compromising public safety. In the 1990s and again in the 2010s, New York City reformed its probation system, reducing its population by 60% between 1996 and 2014.14 Even with far fewer individuals under supervision, violent crime dropped by 57% over the same period.
Other state reforms have been chipping away at the harms of probation over the past few years. While these changes are just a start to reducing our biggest correctional population, it’s critical to understand how many different aspects of supervision are in need of reform. For example:
- California law now limits most misdemeanor probation to one year, and most felony probation to two years, reducing the probation population by 33% and saving the state a projected $2.1 billion;
- In Vermont, some people will benefit from a “presumptive discharge” halfway through their probation term;
- In Georgia, it’s now easier for some people to end their probation early, thanks to clarified procedures around early termination;
- Massachusetts and Oregon eliminated probation fees;
- In Texas, people who complete supervision have their driver’s licenses and professional licenses reinstated.15
Only with a thorough, equitable transformation of probation — and a reduction in the number of people under its control — can it be a true alternative to incarceration, rather than a system that expands its reach.
To reform parole, make it the rule, not the exception
Discretionary parole can — and should — be used to make earlier release possible for people serving sentences of incarceration. Whenever and wherever parole is granted, states should reduce its the length, conditions, and collateral consequences.
Instead of surveillance, states should focus on reducing the unnecessarily high barriers that people on parole face in securing education, employment, housing, and other vital resources. In most states, there is tremendous room for improvement, both in the availability and value of parole.
Fortunately, parole has become a major avenue for state-level criminal legal reform. For example:
- New York enacted major legislation intended to reduce unnecessary incarceration for noncriminal, “technical” offenses of parole, resulting in hundreds of people becoming immediately eligible for release, and thousands more no longer living with arrest warrants for these technical offenses;
- Maine formed a Commission to Examine Reestablishing Parole, whose final report in 2022 recommended restoring discretionary parole after over 40 years without this form of release. Lawmakers introduced a bill to the Maine legislature that would do so.
- California expanded its Elderly Parole Program, addressing the crisis of an aging prison population and acknowledging that older people are highly unlikely to commit new crimes;
- Louisiana legislation restored parole eligibility to certain people, and reduced the number of years others must wait to automatically be eligible for parole consideration.
Conclusions
Incarceration is easily our nation’s most punitive, harmful endeavor, tearing apart communities and families, and sending cascading ripple effects to all of us. But this report provides another metric for understanding where each state falls within the national landscape of mass punishment. Our state-specific breakdowns (below) suggest where state advocates and policymakers might start when developing proposals for meaningful justice reform, especially when probation and parole feed people right back into incarceration.
Additional graphs
The graphs made for this briefing are included in our profiles for each state:
and are available individually from this list:
Methodology and about the data
For all the data we use in this report and the 100+ pie charts, see our data appendix and read below for more information about how the data were compiled and prepared.
- State prisons: Bureau of Justice Statistics’ Prisoners in 2021 — Statistical Tables, Table 2 (jurisdictional population, by state).
- Federal prisons: The number of people in Bureau of Prisons (BOP) facilities comes from the BOP website on March 23, 2023. From this population, we removed the people under U.S. Marshals Service (USMS) jurisdiction held in BOP facilities, to avoid double counting. The number of people under USMS jurisdiction comes from their “Federal Prisoner Detention Summary Statistics, Fiscal Year 2011 through 2023 (projected). We used the FY2023 projected population. To estimate state-level counts, we used percentages for each state provided in a 2021 Freedom of Information Act state of origin request (using “Percent of inmates displayed”) column, multiplied by the total federal population (the combined BOP and USMS populations).
- Local jails: Bureau of Justice Statistics’ Census of Jails, 2005-2019. We subtracted those held for other authorities (Table 12) from all people confined in jails (Table 1).
- Indian Country jails: Bureau of Justice Statistics’ Jails in Indian Country, 2021, and the Impact of COVID-19, July-December 2020 provided a total count for the U.S. To get 2021 counts by state, we calculated each state’s percentage share of the total Indian Country jails population using the last available facility-level data provided by BJS, which is found in the 2017-18 version of Jails in Indian Country. We used these percentages to impute each state’s current population of people in Indian Country jails. Therefore, data for 2021 are not available by facility, and do not account for new facilities that may have been built in states not included in these counts.
- Youth confinement: Easy Access to the Census of Juveniles in Residential Placement (EZACJRP), 2019. We included all types of youth confinement (committed, detained, diversion, and other/unknown) for youth up to age 20. State counts may not sum to total for two reasons: To preserve the privacy of the juvenile residents, state level cell counts have been rounded to the nearest multiple of three. Additionally, state of offense was not reported for 1,895 youth, so we could not allocate those youth to specific states.
- Involuntary commitment: This category includes two populations: people in state psychiatric hospitals and people civilly committed due to conviction for a sex offense.
- Counts of people committed to state psychiatric hospitals by courts after being found “not guilty by reason of insanity” (NGRI) or, in some states, “guilty but mentally ill” (GBMI) and others held for pretrial evaluation or for treatment as “incompetent to stand trial” (IST) are found in the August 2017 NRI report, Forensic Patients in State Psychiatric Hospitals, 1999-2016, reporting data from 37 states for 2014.
- Civil commitment counts come from an annual survey conducted by the Sex Offender Civil Commitment Programs Network shared by SOCCPN President Shan Jumper. Counts for most states are from the 2022 survey, but for states that did not participate in 2022, we included the most recent figures available: Nebraska’s count is as of 2018, New Hampshire’s count is from 2020, South Carolina’s is from 2021, and the federal Bureau of Prisons’ count is from 2017. Note: In Massachusetts, civil commitment (via Section 35) refers to people committed for an alcohol or substance use disorder; those held under Section 35 are not included in this count.
- Parole: We adjusted the counts from the Bureau of Justice Statistics’ Probation and Parole in the United States, 2021, Appendix table 10. To adjust for double-counting, we added up all people who were on parole and also in jail, state prison, or federal prison (from Correctional Populations in the United States, 2021, Table 11), and subtracted them from the total population. Then, we took the ratio of this smaller population to the total parole population, which was 0.962, and applied it to each state’s reported parole population, in order to estimate state-level parole populations while not counting anyone twice. These counts exclude federal supervised release.
- Probation: We adjusted the counts from the Bureau of Justice Statistics’ Probation and Parole in the United States, 2021, Appendix table 6. To adjust for double-counting, we added up all people who were on probation and also in jail, state prison, or federal prison, or parole (from Correctional Populations in the United States, 2021, Table 11), and subtracted them from the total population. Then, we took the ratio of this smaller population to the total probation population, which was 0.978, and applied it to each state’s reported probation population, in order to estimate state-level probation populations while not counting anyone twice. We’ve chosen to include people on both probation and parole in the parole population, as parole represents a more restrictive status. These counts exclude federal supervised release.
- U.S. population (to calculate rates): U.S. Census Bureau’s Annual Estimates of the Resident Population, July 1, 2021 data for each state.
Footnotes
Throughout this report, we’ll use the terms “mass punishment,” “criminal legal system punishment” and “correctional control” interchangeably. We credit Prof. Michelle Phelps for developing the concept of “mass probation,” which informs much of our thinking about how these systems interrelate. ↩
It’s possible to be on both probation and parole at the same time. At yearend 2021, there were over 21,000 people reported to be under both types of supervision; since they’re counted in both populations separately, they do not add up exactly to the total community supervision population. ↩
We credit activist-researcher James Kilgore for his work shedding a light on “e-carceration,” or the reality that electronic monitoring devices and other technologies, used by many parole and probation agencies, extend surveillance and control beyond prison walls, creating prison-like environments in communities. As we explain later in this report, even without the constant presence of an ankle monitor, community supervision strips people of their liberty and functions like another form of incarceration. ↩
For some of these systems, data disaggregated by state are not publicly available; for others, the available data only cover some, not all, states (such as involuntary commitment for those deemed “Not Guilty by Reason of Insanity,” “Incompetent to Stand Trial,” or similar). The recency of available data also varies by system, although most data used in this report are from 2021. See our methodology section for more on how we determined state-level populations for each system. ↩
This figure is higher than what you’ll find reported in the Bureau of Justice Statistics’ report Correctional Populations in the United States, which counts only the number of people in adult correctional systems: prisons, jails, probation, and parole. In this report, as in our Whole Pie report, we take a more comprehensive view and include other types of confinement, like juvenile justice system “residential placement” facilities and prison-like “civil commitment” facilities. ↩
The Council of State Governments (CSG) Justice Center reported that 42% of state prison admissions in 2020 were due to supervision violations. Their figure is different from what the Bureau of Justice Statistics (BJS) published in their Prisoners in 2021 — Statistical Tables report, where 105,070 out of 319,146 (33%) admissions to state prisons in 2020 were due to “conditional supervision violations,” including probation and parole. We attribute the difference in these figures to differences in methodologies, but in our reporting we decided to use CSG’s more comprehensive measure of supervision violation admissions, which includes people admitted to prison from supervision regardless of whether they were previously in custody, while BJS’s measure only counts “postcustody” supervision violations. In addition, Florida did not report prison admissions for technical violations to BJS (and only 29 “conditional supervision violations” in all), while it reported over 8,000 admissions for violations to CSG’s survey — a notable difference in responsiveness to this question. ↩
Georgia is truly exceptional in its rates of mass punishment, and there are several contributing factors for this that are beyond the scope of this report. We do know that Georgia has one of the harshest versions of a “three-strikes” law and a separate “two-strikes” law, significantly increasing the amount of time people with multiple convictions spend in prison. The state is also not paroling eligible people from prison as early as it could, keeping prison populations high. In community supervision, Georgia is an outlier in its use of private probation, with dozens of for-profit companies tasked with supervising and relentlessly pursuing payments from people who are often only on probation because they are poor. ↩
From 2016 to 2021, probation populations grew by 8% in Wyoming, 4% in Montana, 1% in both Mississippi and Virginia, according to annual data from the Bureau of Justice Statistics. ↩
There is an abundance of research dedicated to the ways in which probation or parole fees, in addition to other court-imposed fines and fees, trap the poorest people in our country in cycles of debt, and impose undue collateral consequences and punishments like being put in jail. ↩
Other reasons for exits from parole and probation reported by the Bureau of Justice Statistics include: to serve a period of incarceration, including to receive treatment; absconding, detainment, or “other unsatisfactory reasons besides incarceration;” and death or “other” reasons. Every year, a percentage of exits from parole and probation are categorized as “Unknown/not reported.” In 2020 and 2021, the percentage of unknown or not reported exits from supervision jumped, to over one-third of exits from probation and 23% of exits from parole. ↩
For more information about this analysis of the cost of supervision violations and revocations, see the Council of State Governments Justice Center report The Cost of Recidivism: The high price states pay to incarcerate people for supervision violations. ↩
A 2015 law review article examining probation found a typical load of 18 to 20 “standard” and “special” conditions with which someone must comply. While far from an exhaustive list, standard and special probation requirements include:
- Paying supervision fees, fines, restitution or other fees ordered by the court, very often without considering the individual’s ability to pay;
- Regularly reporting to a parole or probation officer;
- Finding and maintaining full-time employment or education;
- Submitting to drug and alcohol tests, which the individual is often forced to pay for (this may be a special condition even if the offense was not related to drugs or alcohol);
- Abiding by strict curfews and submitting to electronic monitoring, which, again, the individual often must pay for;
- Not changing employment or residence without permission;
- Attending specific programs (such as an anger management class);
- Not leaving a designated area without permission (such as the city, county, or state); and
- Not associating with people with criminal records, including family and friends.
In 2020, an estimated 12% of adults in the U.S. identified as Black or African American alone, according to the U.S. Census Bureau. The Bureau of Justice Statistics uses the same definition (Black alone) in Correctional Populations in the United States, 2021, which we used to calculate the percentage of people under community supervision who are Black. When people who reported identifying as Black in combination with any other race are included in the full count of Black Americans, 14.2% of the total U.S. population is Black. ↩
In 1996, the New York City Department of Probation began to use kiosk reporting for people on probation deemed “low-risk” instead of requiring face-to-face reporting. As a result, re-arrest rates declined for both low-risk and high-risk clients (as a result of savings being reinvested in behavioral interventions and improved supervision). Then in 2010, the Department of Probation began to “aggressively” recommend early discharge for people who met certain criteria, leading to accelerated reductions (and even further shrinking rearrest rates). Finally, in 2014, an amended state law allowed judges to utilize shorter probation terms, charting a path for a smaller probation population in New York. The probation population of 68,000 in 1996 turned into 34,982 in 2006, and was down to 21,379 in 2014. ↩
Of course, no one should have their driver’s license or occupational license revoked simply for being on community supervision in the first place. ↩
Privacy policy
To customize this report with state data that you are most likely to find relevant, this report makes an educated but unrecorded guess about your location based on your IP address. Where we can’t make this guess, the page may request your location for that purpose. If you gave us this permission, we discarded your location data as the page finished loading. If you did not give us this permission — or if your browser was configured to decline permission automatically — this report simply gives a more generic experience.
Acknowledgements
This report was made possible thanks to the generous support of Public Welfare Foundation in addition to individuals across the country who support justice reform. While Prison Policy Initiative reports are collaborative endeavors, this report builds on the successful collaborations of the 2018 version. The author is particularly indebted to Wendy Sawyer for her support throughout the writing process, and she would also like to thank Alexi Jones for authoring the 2018 version of this report which provided a useful framework for this update.
About the author
Leah Wang is a Research Analyst at the Prison Policy Initiative. She is the author of the recent report Chronic Punishment: The unmet health needs of people in state prisons. She is also the co-author of the Prison Policy Initiative’s recent report Beyond the Count: A deep dive into state prison populations, which uses the Bureau of Justice Statistics’ Survey of Prison Inmates to show the social disadvantage of people locked up in state prisons. Her other work includes reports on diversion programs, how incarceration affects people’s experiences in the job market, and the importance of family contact for incarcerated people.
About the Prison Policy Initiative
The non-profit, non-partisan Prison Policy Initiative was founded in 2001 to expose the broader harm of mass criminalization and spark advocacy campaigns to create a more just society. The organization is known for its visual breakdown of mass incarceration in the U.S., as well as its data-rich analyses of how U.S. states vary in their use of punishment. Alongside reports like these, the organization leads the nation’s fight to keep the prison system from exerting undue influence on the political process (a.k.a. prison gerrymandering) and plays a leading role in protecting the families of incarcerated people from the predatory prison and jail telephone industry and the video calling industry.
