April 15-17, 2025: Sarah Staudt, our Director of Policy and Advocacy, will be attending the MacArthur Safety and Justice Challenge Network Meeting from April 15-17 in Chicago. Drop her a line if you’d like to meet up!
Not near you? Invite us to your city, college or organization.
Using a novel data source, we examine the flow of individuals booked into a nationally-representative sample of jails along lines of race, ethnicity, sex, age, housing status, and type of criminal charge.
Millions of people are arrested and booked into jail every year, but existing national data offer very little information about who these people are, how frequently they are jailed, and why they are jailed. Fortunately, we now have new data through a collaboration with the Jail Data Initiative to help answer these questions: In 2023, there were 7.6 million jail admissions; but 1 in 4 of these admissions was someone returning to jail for at least the second time that year. Based on the Jail Data Initiative data, we estimate that over 5.6 million unique individuals are booked into jail annually1 and about 1.2 million are jailed multiple times in a given year. Further analysis reveals patterns of bookings — and repeat bookings in particular — across the country: The jail experience disproportionately impacts Black and Indigenous people, and law enforcement continues to use jailing as a response to poverty and low-level “public order” offenses.
We first looked into these questions about repeat jail bookings in our 2019 report, Arrest, Release Repeat: How police and jails are misused to respond to social problems. In particular, our 2019 analysis found that repeated arrests are related to race and poverty, as well as high rates of mental illness and substance use disorders. While these new data don’t include as many contextual details as the survey we used in that analysis, the Jail Data Initiative data offer a more accurate accounting of unique versus repeat jail bookings — a number that the Bureau of Justice Statistics still does not collect or report. Our two analyses are not directly comparable: Our 2019 report uses data from a public health survey, the National Survey of Drug Use and Health, while the Jail Data Initiative data we use here are collected directly from online local jail records and updated daily.23 As a result, these reports have different strengths: this analysis can provide more accurate jail booking data because of the much larger sample size, while Arrest, Release, Repeat offers more descriptive data about people who have been jailed, including details regarding health, education, and income.
More than 1 in 5 people are jailed multiple times a year
While unique jail admissions (the number of individual people admitted to jail) account for three-quarters of jail bookings, more than 1 in 5 people (22%) booked into jail are booked again within 12 months. People who are jailed multiple times a year inevitably face exacerbated consequences of incarceration: As we have discussed before, there is no “safe” way to jail a person, nor is there an amount of time a person can be detained without escalating short- and long-term risks to themselves, their families, and their communities, including rearrest, legal debt, missed work, lost jobs, and health risks.
Racial disparities in jail admissions extend to repeat bookings
Black people are overrepresented in every part of the criminal legal system including jails, and this new data reveal that not only are Black people jailed at alarmingly high rates, but they are jailed again and again. Relative to their share of the total US population (14%), Black people are greatly overrepresented among the unique jail admissions in this sample (32%) and the people booked multiple times in a year (29%), while white people are underrepresented in both populations. This is consistent with what we know about the over-incarceration of Black people in this country, but the rebookings data add another layer of detail about their experiences with law enforcement, which often targets Black communities.4
Indigenous people account for only 1% of the total U.S. population, but 3% of the incarcerated population, with incarceration rates between two and four times higher than that of white people.5 In the Jail Data Initiative data, we find that Indigenous people are especially likely to be booked into jail multiple times: 33% of Indigenous bookings were people who had been booked at least once in the past 12 months, compared to 18-22% among other racial and ethnic groups.
Women are funneled into jails
Women make up about a quarter of individuals booked into jail each year, which is in line with annual arrest data showing 27% of arrests in 2023 were of women.6 While we found no significant difference between men and women in terms of multiple jail admissions, we do know that the jail incarceration of women is growing: From 2021 to 2022, the number of women in jail increased 9% while the number of men in jail increased only 3%. The jailing of women has a devastating “ripple effect” on families: At least 80% of women booked into jail are mothers, including over 55,000 women who are pregnant when they are admitted. Beyond having to leave their children in someone else’s care, these women are impacted by the brutal side effects of going to jail: aggravation of mental health problems, a greater risk of suicide, and a much higher likelihood of ending up homeless or deprived of essential support and benefits. So while women may account for a relatively small share of people booked into jails, those jail admissions have serious and long lasting consequences for the women, their families, and their communities.
1 in 10 people booked are 55 years or older
Older adults account for one in ten of all jail bookings, but a slightly smaller share of rebookings (7%). This is consistent with existing arrest data that show an increasing proportion of older adults caught up in the criminal legal system: In 2021, people 55 years or older accounted for 8% of all arrests, a four-fold increase from their share of arrests in 1991. The Bureau of Justice Statistics only began publishing the age ranges of people in jails in recent years, but from 2021 to 2022, the jail incarceration rate of people 55 and older increased by 8%, compared to a 3% increase in jail incarceration rates across all other age groups. Considering most older adults are arrested for low-level, non-violent offenses like trespassing, driving offenses, and disorderly conduct,7 it is likely that the older adults admitted to jail are in need of other systems of support outside of the criminal legal system, like substance use treatment, accessible medical care, and behavioral health services.
More than 40% of unhoused people booked into jail were booked again within the year
Poor people in the United States are a primary target for policing, especially those forced to live on the streets: In a 2022 analysis of Atlanta city jail bookings, we found that 1 in 8 admissions involved people experiencing homelessness, a proportion more than 30 times greater than the city’s total unhoused population. In this analysis of the Jail Data Initiative data, we find that across the 140 jails that include housing status on their online rosters, 4% of individuals booked are explicitly listed as unhoused, although this is almost certainly a significant undercount.8 While this is a relatively small portion of all bookings, unhoused people were the most likely to be jailed multiple times across all the demographic categories we looked at: Over 40% of unhoused people booked into jail were booked more than once in a twelve month period. This finding adds to the existing evidence of law enforcement’s ineffective but disproportionate and deliberatetargeting of people experiencing homelessness.
Most people are jailed for public order, property, or drug charges — not “violent” charges
The Bureau of Justice Statistics last collected charge data for jail populations in their 2002 Survey of Inmates in Local Jails. Given that the most recent jail offense data is over 20 years old, the Jail Data Initiative dataset offers a rare opportunity to analyze the top charges9 that people are booked under nationwide. Of course, the difference in data sources makes a fully apples-to-apples comparison of the 2002 data and the more recent Jail Data Initiative data impossible.10 The data provided in the Bureau of Justice Statistics survey reflects self-reported information from people detained in a sample of local jails on a single day in June 2002, while the Jail Data Initiative data is based on jail bookings across a two-year time period and relies on administrative data. Nevertheless, the overall trends since 2002 offer some valuable insights into the reasons people are detained in jails today:
Drug charges appear to play a smaller role now than they did two decades ago, when the “war on drugs” was in full effect. In 2002, a quarter of people in jail were held for drug charges, compared to 14% of people admitted to jail in our 2021-2023 sample.
Property charges also appear to represent a smaller portion of the jail population now than they did in 2002: Property charges are the top charge for 19% of jail admissions, compared to 24% of the jail population in 2002.
In 2002, public order charges were the top charge for 25% of people in jail, but now, 31% of people admitted to jail are booked for a most serious charge related to public order, such as disorderly conduct, loitering, and public intoxication.
We see very little change in the proportion of people in jail for violent charges: in 2002, 25% of people were in jail for a violent charge and in our analysis of more recent jail bookings, about 26% of jail bookings were for violent charges.
In our 2021-2023 sample, only one-third (33%) of people booked multiple times had a top charge categorized as violent in the study window, suggesting that the vast majority of people admitted to jail — including people booked repeatedly — are not accused of violent charges like homicide, assault, robbery, or sexual assault.
In their own analysis of a similar sample of the dataset, researchers at the Jail Data Initiative, Orion Taylor and Anna Harvey, found that rebooking rates vary by the type of initial booking charge. Looking closely at the rates of people returning to jail on serious violent charges11 within six months of their release from jail, they found the average rebooking rate for a serious violent charge was only 2% for people initially booked into jail on any other kind of top charge. The rate was only slightly higher (9%) if they were also jailed on a serious violent charge initially.12
Conclusion
The Jail Data Initiative offers a sorely-needed alternative source of information about jail admissions and about people who are jailed repeatedly. In many ways, our findings from this analysis support what we already know: people who are arrested and booked more than once per year often have other vulnerabilities, including homelessness, in addition to the serious medical and mental health needs of this population that we discussed in our 2019 analysis based on public health data. In addition, this dataset fills a serious gap in our knowledge about the demographics and charges of people booked into jails, given that comparable data has not been collected or published from the Bureau of Justice Statistics in over twenty years.
Methodology
The Jail Data Initiative (JDI) collects, standardizes, and aggregates individual-level jail records from more than 1,000 jails in the U.S. every day. These records are publicly available online in jail rosters — the online logs of people detained in jail facilities that often include some personal information like name, date of birth, county, charge type, bail bond amounts, and more. JDI uses web scraping — the process of automating data collection from webpages — to update their database of jail records daily.13 The more than 1,000 jails included in the Jail Data Initiative database represent more than one-third of the 2,850 jails identified by the Bureau of Justice Statistics’ Census of Jails, 2019 and are nationally representative.
Of course, not all of the jails included in the Jail Data Initiative database provide the same information. For the purposes of our analysis, we used data from 648 jail rosters for which there was available data for a two-year window (July 1, 2021 to June 30, 2023), plus an additional 365 days for a look-forward review of rebookings (to June 30, 2024). We looked at people who were both booked into jail and released within the two-year study period, and counted people as “rebooked” or “booked two or more times” if they were booked into the same jail system within 365 days of their first jail admission in the study time period. We elected to use a two-year time frame to capture a larger sample of bookings than we could in a single calendar year.
In all, there were 2.9 million jail bookings captured across these 648 rosters, representing almost 2.2 million unique individuals booked into jail: People who were booked more than once in the two-year window accounted for 26% of all bookings.14 For the more detailed analyses of jail bookings and rebookings by race and ethnicity, gender, age, housing status, and charge type, we had to use subsets of this sample of 648 rosters because the inclusion of these details was less consistent:
Race and ethnicity: Of the 648 rosters in this sample, 437 rosters (67%) included the relevant race and/or ethnicity data needed for this analysis.15 Often, the data included in these jail rosters are administrative decisions and may not reflect an individual’s self-identified race or ethnicity.16 The final sample of rosters with race information included 1,923,668 bookings from 1,437,730 individuals.
Gender: Of the 648 rosters in this sample, 517 rosters (80%) included the relevant gender data needed for this analysis.17 Out of the more than two million bookings in this subset, 75 bookings with values of “trans” or “nonbinary” were omitted because of the small sample size.18 The final sample of rosters with binary “male” and “female” gender identifiers included 2,180,992 bookings from 1,623,638 people.
Age: Of the 648 rosters in this sample, 529 rosters (82%) included the relevant age data (under 55 years of age or 55 years and older) needed for this analysis.19 The final sample of rosters with age information included 2,393,299 bookings from 1,775,721 people.
Housing status: Of the 648 rosters in this sample, only 140 rosters (22%) included housing information needed for this analysis. This is the fewest rosters included in any of our subsets of the Jail Data Initiative dataset because most rosters in the sample do not have clear indications of housing status. We categorized individuals as “unhoused” if a person was reported unhoused upon admission for any of their bookings in the two-year period,20 and all other housing statuses were considered “housed or unknown housing status.” The final sample of rosters with housing information included 599,423 bookings from 457,025 people.
Charge type: Of the 648 rosters in this sample, 554 rosters (84%) included the relevant charge data needed for this analysis.21 Charges were grouped into the following categories (in order of severity, from most severe to least severe): violent, property, drug, public order, DUI offense, and criminal traffic. Because the top charge category does not indicate whether it was the first, second, or subsequent booking that had the top charge, nothing should be inferred about release decisions. The final sample of rosters with charge information included 2,517,899 bookings from 1,869,156 people.
Jail bookings — or admissions — involve the administrative process of collecting and entering information about the individual into the jail system and subsequently detaining that person in a jail facility. Almost all arrests lead to at least some in jail. ↩
The jail records and data are collected from jail rosters — publicly available, online logs of all individuals detained in a jail facility on a given date. The jail rosters used by the Jail Data Initiative are updated at least daily, excluding any jail rosters that are updated less frequently. A single jail roster may contain information for multiple counties or facilities: for example, West Virginia provides a single online search portal for all jails in the state. ↩
While the Jail Data Initiative data includes individual-level jail data in approximately 1,300 local jails, representing over one- third of all local jails in the country, this current analysis is based on a subset of those jails: 648 jails rosters with available data throughout the study period of July 1, 2021 to June 30, 2023. See the Methodology for more details. ↩
People who are arrested and jailed are often among the most socially and economically marginalized in society. The overrepresentation of Black people among those who are arrested is largely reflective of persistent residential segregation and racial profiling, which subject Black individuals and communities to greater surveillance and increased likelihood of police stops and searches. Poverty, unemployment, and educational exclusion are also factors strongly correlated with likelihood of arrest. ↩
Throughout this briefing, “Indigenous” refers to people identified in jail rosters as Native American, American Indian, Alaska Native, or Indigenous. This is inevitably an undercount of Indigenous people in local jails, given the flawed single-race categorization system that frequently obscures data on Indigenous people throughout the criminal legal system. For more information, see our profile page on Native incarceration in the U.S. ↩
According to the FBI’s National Incident-Based Reporting System (NIBRS), Table 13: Arrestees Age by Arrest Offense Category, 54% of people 55 and older arrested in 2023 were arrested for “Group-B offenses” including trespassing, driving offenses, and disorderly conduct. ↩
“Unhoused” refers to people who were positively identified as unhoused on the jail roster. This is likely a significant underestimate because many more unhoused people may have chosen to list a shelter address, a family member’s address, or another location as their address when they were booked into jail. This estimate is based on only bookings from 140 jail rosters where housing status was indicated for at least one booking in the study time period. If a person was reported unhoused upon admission for any of their bookings, they were counted as “unhoused.” Because of the unique method required to standardize this indicator (it is extracted from a variety of fields by substring searching), and because it is only reported in the positive, we cannot assume that people who are not reported to be unhoused are housed; rather, we assume that they are either housed or have an “unknown” housing status. Unlike the larger sample used in other parts of this analysis, the final sample for this part included 599,423 bookings involving 457,025 individuals. ↩
The “top charge” category reflects the most serious charge from among all jail bookings for that individual. For example, if the first booking for an individual was for a criminal traffic offense and a subsequent booking three months later was for a violent offense, that person’s “top charge” category is “violent.” The charge categories are based on the CJARS Text-based Offense Classification (TOC) model and include, from most severe to least severe: violent, property, drug, public order, DUI offense, criminal traffic. ↩
In particular, the offense distribution of the static one-day population in jails is likely to differ from the offense distribution of all jail bookings over a longer time period, because charges are directly related to the likeliness of pretrial detention, and in turn, how long people stay in jail. For example, courts are likely to set higher bail amounts or deny bail for people booked on serious charges (especially charges of violence) and more likely to order release without monetary conditions for people accused of less serious charges. Additionally, less serious offenses carry shorter sentences that result in quicker release from jail even when people are convicted. Therefore, we would expect a higher proportion of “violent” and serious charges in the one-day jail population than we would across all admissions. ↩
In that analysis, the researchers considered “serious violent charges” to include murder, unspecified
homicide, voluntary/nonnegligent manslaughter, non-vehicular manslaughter, aggravated assault, kidnapping, rape, statutory rape, lewd act with children, sexual assault, and human trafficking. ↩
As the authors of that study write, “In other words, over a 6-month period, a recently released individual originally booked on a top charge not involving serious violence can be expected to be charged with 0.02 crimes of serious violence. A recently released individual originally booked on a top charge of serious violence can be expected to be charged with 0.09 crimes of serious violence.” ↩
For more information about the data collections and web scraping process, cleaning of the data, aggregations, and other relevant methodological details used by the Jail Data Initiative, please see their documentation and methodology at https://jaildatainitiative.org/documentation/about. ↩
Across the 648 rosters, some bookings were excluded from the analysis due to potential issues with date range overlap (12,413 bookings) and issues with unique person identification (15 bookings). ↩
In criminal legal system data, race and ethnicity are not always self-reported (which would be ideal). Police and jail administrators may report an individual’s race based on their own perception — or not report it at all — and the jail rosters used by Jail Data Initiative rely on administrative data, which may not reflect how individuals identify their own race or ethnicity. ↩
Gender is not always self-reported (which would be ideal) in criminal legal system data. Police and jail administrators may report an individual’s gender or sex based on their own perception — or not report it at all — and the jail rosters used by Jail Data Initiative rely on administrative data, which may not reflect how individuals identify their own gender. For more information on how the Jail Data Initiative standardized sex and gender across rosters, please see their documentation page at https://jaildatainitiative.org/documentation/glossary. ↩
While these 75 bookings could not be included in this analysis, we know that trans and non-binary are disparately impacted by the criminal legal system: In particular, Black trans people and other trans people of color face high rates of police harassment and high lifetime rates of incarceration. In jails and prisons, trans people face high rates of assault, are frequently denied healthcare, and are at high risk of being sent to solitary confinement. We suspect that because most jail systems likely operate on a gender binary (male/female), this likely represents a serious undercounting of trans and non-binary people admitted to jails. ↩
For more information on how the Jail Data Initiative standardized age across rosters, please see their documentation page at https://jaildatainitiative.org/documentation/glossary. For this analysis, we were interested in looking specifically at the jailing of older adults, so we collapsed all categories younger than 55 into one group, and all categories 55 and older into another. ↩
This ultimately results in a significant undercount of the unhoused population admitted to jail: administrative records of unhoused people may include previous addresses, shelter addresses, or addresses of family and friends and would therefore not be considered “unhoused” in jail records. ↩
Using the Criminal Justice Administrative Records System (CJARS) Text-based Offense Classification (TOC) algorithm, the Jail Data Initiative standardized the most severe charge reported for individuals into the following categories (in order of severity, from most severe to least severe):
Violent
Property
Drug
Public order
DUI offense
Criminal traffic
An overall top charge category per person was determined by selecting the most severe charge from among all bookings for that individual. For more information on how the Jail Data Initiative standardized the “top charge” — or the most severe charge reported — across rosters, please see their documentation page at https://jaildatainitiative.org/documentation/glossary. ↩
President Biden and three governors should use their clemency powers before they leave office to save the lives of people facing the death penalty, our nation’s cruelest punishment.
On December 31, 2024, North Carolina Governor Roy Cooper commuted the sentences of 15 people on that state’s death row to a sentence of life-in-prison without the possibility of parole. This is an important step, but North Carolina continues to have one of the highest death row populations in the nation.
Every November, it has become a light-hearted tradition for the president and some governors to “pardon” turkeys before the Thanksgiving holiday, sparing them from the dinner table. But when the nation’s political leaders take part in an annual turkey pardon, it’s hard not to think about the chronic underuse of clemency1 powers across the U.S., especially for people on death row.
If turkey pardons are about choosing life over death, using clemency powers to empty remaining death rows is a straightforward way for elected leaders to act on those values and reject a horrific practice. President Biden and the outgoing governors of North Carolina, Indiana, and Missouri in particular can use clemency for those facing a state-sanctioned death before they leave office early next year. More than a dozen other governors can stop executions in their states, too, by exercising their unilateral power to modify or reduce criminal convictions and sentences at any time.
In this briefing, we show that the outgoing president and some governors’ tactless traditions of granting relief to turkeys casts a harsh light on their records of granting relief to people condemned to die. Ultimately, their legacies won’t be shaped by crass Thanksgiving rituals, but by how they tapped their power to intervene in the moral atrocity that is the death penalty.
A national patchwork of policy and practice leads to a geography-based punishment system for people convicted of the most serious crimes.
Outgoing political leaders can turn the page on the death penalty
In addition to being the only irreversible punishment, the death penalty — a sentencing option still on the books in 27 states and at the federal level2 — is widely understood as the most cruel, discriminatory, and corrupt punishment, rife with due process and human rights violations. From deep racial injustice and legal misconduct, to horrific botched executions and shadowy methods of acquiring lethal drugs, to wide public opposition to many executions, the death penalty is an unpopular3 and grotesque public experiment.4Almost half of U.S. states have already abolished the death penalty, and many victims’ families oppose it, helping to lead the way in repeal efforts.
While the following leaders have no record of sparing anyone from the death penalty, they still have several weeks to change course; it’s customary to wait to use clemency powers until the end of a political term, as a final boost to one’s legacy without the risk of political blowback. (And former leaders following custom have used clemency for people on death row, sometimes with a blanket commutation, converting all death sentences to life in prison.) But as the holiday and family-gathering season kicks off, the choice to ignore death row and spare a turkey instead is no act of festive good will.
President Joe Biden
Although he’s extended pardons and commutations during his term, President Joe Biden has yet to use his clemency powers for a person facing the federal death penalty, despite openly opposing capital punishment at one time. Biden can still heed increasing calls from advocates to improve his minimal clemency record and clear federal death row of all 40 current death sentences.
But Biden does pardon condemned turkeys, issuing a pair of pardons each year he’s been President. These fowl, by the names of Peanut Butter and Jelly (2021), Chocolate and Chip (2022), and Liberty and Bell (2023), are greeted in Washington with pomp and circumstance, and are returned to their home pastures under the care of animal experts.
Governor Roy Cooper has only used clemency sparingly throughout his eight-year term.5 But even after issuing relief to several people just before Thanksgiving — including five people convicted of murder — the outgoing governor has withheld clemency from everyone on North Carolina’s death row, which has the fifth-highest death row population as of January 2024 with 138 people condemned to die.
Governor Cooper has, however, consistently pardoned turkeys, showing mercy toward at least eight birds since he took office. During the most recent pardoning event in 2022,6 Gov. Cooper told spectators that “Thanksgiving is a time to come together and appreciate the many blessings our families, friends and communities have to offer.” These words would be just as appropriate for sparing human life.
The North Carolina Coalition for Alternatives to the Death Penalty has been in Governor Cooper’s ear since 2022, when they launched a campaign calling on him to empty the state’s death row, commuting all sentences to prison terms before his term is over. He still has time to heed their advice.
Governor Eric Holcomb, Indiana
Indiana’s Governor Holcomb has a weak record for granting clemency,7 but could spare the eight individuals on Indiana’s death row with the stroke of a pen,8 including one man scheduled to be put to death in December — resuming executions in the state after more than a decade.
Notably, Holcomb governs a state with a legacy of rethinking death sentences: According to the Indiana Public Defender Council, more than half of all death sentences handed down in the Hoosier State since 1977 have been commuted, reversed, or dismissed, with Indiana governors taking clemency action as recently as 2005. And between 2000 and 2015, few cases that initially sought the death penalty actually resulted in a death sentence.
We couldn’t find evidence of Gov. Holcomb participating in a turkey pardon during his time in office. If he refrains this year, he should have plenty of time to acknowledge Indiana’s de facto moratorium on death sentences and extend clemency to the eight people on Indiana’s “X Row.”
Governor Mike Parson, Missouri
Governor Mike Parson of Missouri is leaving office after nearly seven years with a decent clemency record,9 having cleared a backlog of over 3,500 clemency applications.10 It’s unclear, though unlikely, whether Gov. Parson has ever commuted a death sentence; the clemency data produced by the governor’s office do not include crime or sentencing information. Nor could we find evidence of Parson participating in a Thanksgiving turkey pardon.
Considering Gov. Parson’s record of harmful policies, like bans on nearly all abortions and on gender-affirming care for minors, it seems unlikely that he would consider saving the lives of the dozen men on Missouri’s death row. Parson has overseen the executions of 12 people during his tenure as governor, including the execution of Johnny Johnson, a man with serious mental illness whose clemency was supported by his victim’s own father, and Marcellus Williams, whose advocates included prosecutors and the victim’s family.
As Parson considers his gubernatorial legacy, he should continue to use his unilateral clemency power for the Missourians who deserve better than the abhorrent practice of taxpayer-funded executions.
We applaud elected leaders when they use clemency to relieve people of excessive or unnecessary criminal sentences. But too often, they overlook those given the most draconian punishment on the books. Only a consistent practice of commuting death sentences and issuing pardons can combat the horrifying persistence of the death penalty. With Thanksgiving right around the corner, and their days in office numbered, outgoing leaders can spare human beings, rather than just birds.
Footnotes
Clemency is an umbrella term that refers to the ability of a governor or president to modify or reduce a person’s conviction or criminal sentence, typically via a commutation or pardon.
A commutation amends or reduces a sentence, usually of a person who is currently incarcerated. Commutations are extremely rare and, when granted, often do not result in immediate release. When someone is actually released, they may still have to go through a lengthy period of supervised release.
A pardon is an official expression of forgiveness for a criminal conviction. It can restore civil rights that were forfeit upon conviction, such as the right to vote or hold public office. A pardon can be granted prior to charge or conviction, or following a conviction, but the person may or may not have been incarcerated for that conviction. ↩
Six of those states — Arizona, California, Ohio, Oregon, Pennsylvania, and Tennessee — and the federal government currently have a hold on executions due to executive action. ↩
An increasing number of Americans believe that the death penalty is applied unfairly. Meanwhile, public support for the death penalty for murder convictions has held steady around 55 percent since 2017, but is sharply divided along partisan lines. ↩
In addition to the rich resources we’ve already linked from the Death Penalty Information Center, this overview from the Equal Justice Initiative summarizes the myriad issues associated with the death penalty, including sentencing innocent people to die, the arbitrary application of the death penalty, and the astronomical fiscal cost of death penalty cases. ↩
Our friends at Families Against Mandatory Minimums (FAMM) recently called on Gov. Cooper to utilize his clemency power during his final days in office; we encourage you to read FAMM’s letter, which contains more information about how clemency can serve as a “critical check on excessive sentencing” in North Carolina. ↩
North Carolina’s annual turkey pardoning in 2023 was canceled due to avian flu concerns. ↩
According to the Collateral Consequences Resource Center, Governor Holcomb issued seven pardons in 2017, his first year in office, but he hasn’t issued any others as of August 2024. ↩
Our friends at Families Against Mandatory Minimums (FAMM) recently called on Gov. Holcomb to utilize his clemency power during his final days in office; we encourage you to read FAMM’s letter, which contains more information about how clemency can serve as a “critical check on excessive sentencing” in Indiana. ↩
Our friends at Families Against Mandatory Minimums (FAMM) recently called on Gov. Parson to utilize his clemency power during his final days in office; we encourage you to read FAMM’s letter, which contains more information about how clemency can serve as a “critical check on excessive sentencing” in Missouri. ↩
Some sources actually call the pace of Gov. Parson’s clemency work “generous” and the number of pardons he’s issued during his term earned Missouri a spot as a “Frequent/Regular” grantor of pardons by the Collateral Consequences Resource Center’s Restoration of Rights Project. ↩
Update: Californians approved Proposition 36 in the November 2024 elections.
This November, Californians will see an initiative on their ballots proposing a way to curb retail theft and drug use. In reality, this measure would undo a decade of progress towards unraveling mass incarceration without any public safety benefit. Bankrolled primarily by major retail brands like Walmart and Target, the ballot initiative known as Proposition 36 would cut millions of dollars from reentry and prevention services in favor of more prison sentences for theft and drug charges. It would punish people with substance use disorder who relapse, increase penalties for many people who use and sell drugs by increasing penalties and makes some small scale thefts eligible for felony charges. Overall, by 2029, Prop 36 is projected to fully undo hard fought progress made in reducing California’s prison population.
Prop 36 is part of a wave of recent measuresacross the country attempting to resurrect “tough-on-crime” policies. But this one is particularly concerning because it directly repeals decade-old reforms that have been proven to reduce both prison populations and recidivism. Californians who are interested in basing their criminal legal system policy on facts, not fear, should reject the measure — and other states should be on the lookout for similar efforts in their legislatures and on their ballots.
Prop 36 defunds critical prevention and reentry services
The text of Prop 36 doesn’t say it defunds prevention and reentry services, but that’s exactly what it does. In order to understand Prop 36, it’s important to examine another ballot initiative from a decade ago: Proposition 47 in 2014. Sixty percent of Californians voted for Prop 47 that year, a transformative initiative that reduced certain drug possession and theft crimes from felonies into misdemeanors. Lowering charges to misdemeanors decreases the long-term impact of criminal convictions on people’s housing and employment, and misdemeanors have shorter sentences than felonies. Changing these common low-level charges from felonies to misdemeanors dramatically lowered the prison population over time.
The most innovative part of Prop 47, however, was its re-investment provision. It required that the money saved by incarcerating fewer people be calculated by the state and then re-invested in a grant program for local reentry, diversion, substance and mental health treatment and crime prevention programs. So far, Prop 47 has saved the state almost a billion dollars, which has been funneled directly into local programs.
Now, Prop 36 will grow prison populations by reversing the sentencing policy changes of Prop 47. However, because Prop 36 has no funding stream of its own, it will cut into those same Prop 47 savings that fund essential local programs. This will leave local communities without the resources they need to reduce recidivism, house people, treat mental health and substance use disorders, and help people reenter society successfully after incarceration. In other words, it will stoke many of the problems that have fueled tough-on-crime narratives in the first place: fewer reentry programs mean higher recidivism rates, higher homelessness rates, and lower employment rates. Re-conviction rates for participants in Prop 47 reentry programs were 15.3% — 2-3 times lower than the average for people who have served prison sentences. The proportion of Prop 47 reentry participants who were homeless decreased by 60%, and the proportion of people who were unemployed dropped by 50%. These programs are demonstrably effective and essential public safety measures that address homelessness and poverty while reducing crime.
Prop 36 will directly harm Californians, especially those who use drugs
Prop 36 would raise the prison population by filling jails and prisons mostly with people charged with low-level theft and drug possession, while also draining resources from local community programs, and providing less effective treatment for people with substance use disorders and lengthening prison terms.
Draining resources: Prop 36’s proponents claim that they are promoting treatment for drug use even though the proposition drains funding from substance use programs. Instead of helping increase the availability of desperately-needed substance use disorder treatment, Prop 36 is an unfunded mandate, allowing prosecutors to seek “treatment mandated felonies” for people who are charged for a third time with drug possession without providing the funding to make that treatment possible. People who successfully complete these treatment mandates could have their charges dismissed, but people who do not successfully complete these programs would be convicted of a felony and potentially sentenced to prison or jail. And remember, Prop 36 does not do anything to fund these mandatory programs, so cash-strapped county governments will be left to pick up the slack.
Less effective treatment: One concerning feature of drug courts and similar mandatory treatment programs is that they put the rules and regulations of treatment programs in the hands of the courts, not medical professionals. People in community-based voluntary programs work with medical professionals who understand that relapse is part of recovery, while people in court-mandated programs may be labeled as a failure for one relapse and incarcerated. The proposition’s language allows courts and prosecutors to declare that the person has “failed” the program for incredibly broad reasons, including, “If at any time, it appears that the defendant is performing unsatisfactorily in the program, is not benefitting from treatment [or] is not amenable to treatment.”
Mandatory treatment programs are significantly less effective than voluntary treatment programs, and they have higher rates of relapse and overdose deaths. A recent review of 45 studies linking incarceration records with overdose deaths found that, in the first two weeks of release from mandatory treatment programs, opioid overdose deaths were 27 times higher than the general population. People in mandatory treatment programs often spend time in jail, either while awaiting evaluation or as a sanction for relapse and other violations. Even one day in jail can trigger a cascade of problems that are particularly acute for drug users — including heightened risk of death and suicide. Jail also disconnects them from effective treatment: only 24% of jails provide medication assisted treatment (considered the “gold standard” for opioid use disorder care).
Longer sentences: Prop 36 also increases penalties for many people who use and sell drugs by implementing sentencing enhancements for distribution and possession with intent to distribute fentanyl. The impact of expanding these excessively long sentencing enhancements to fentanyl could be disastrous, because fentanyl is so prevalent in the drug supply that most people who buy, use, and sell drugs do not know whether their drugs contain fentanyl. In one recent study, 83% of the study cohort tested positive for fentanyl — but only 18% reported that they intended to use fentanyl. This means that these sentencing enhancements will not just target the people putting fentanyl into the drug supply — they will target the majority of drug users. Prop 36 is likely to simply increase drug offense penalties across the board for Californians, rather than aiming policy at “the worst of the worst”.
Prop 36 would make California’s already-punitive theft laws harsher, locking up more people for low-level theft.
Prop 36 claims to be a response to rising retail theft, and two of the biggest donors supporting the initiative are Walmart and Target. Although retailers have worked hard to claim they are losing large amounts of money and goods from retail theft, it is far from clear that this is true.
What Prop 36 would actually do is make thefts of less than $950 dollars — with no minimum — a “strike” for the purposes of future felony charges. In other words, stealing a candy bar at some point would be enough to enhance someone’s later charge to a felony. Incarcerating more people for retail theft is likely to have notably disproportionate impacts, since people arrested for retail theft are disproportionately young and Black despite white people being more likely to engage in shoplifting. Turning more theft and drug charges into felonies instead of misdemeanors also specifically harms immigrant communities by making more people deportable for minor crimes — even people who are legally in the United States.
These changes aren’t necessary, even according to their own logic. California already has one of the lowest thresholds for felony theft in the nation, and just last month, Governor Gavin Newsom signed a series of “tough on crime” retail theft bills that allow businesses to aggregate the total amount stolen in multiple thefts to reach felony charging thresholds. Prop 36’s draconian punishment for a non-violent crime — crime that is driven most often by poverty and need — is neither needed nor helpful.
Conclusion
Prop 36 is not an isolated policy effort. It is part of a wave of measures across the country that are trying to resurrect “tough on crime” policies that claim to improve public safety or combat drug use or homelessness. But those approaches didn’t work in the past and won’t work now. What communities all over the United States need is more investment in communities, treatment, and reentry — the exact kind of investment that Prop 47 provides in California today, and the exact kind of investment that Prop 36 would undo. If you are interested in learning more about the efforts to defeat Prop 36, California United for a Responsible Budget has compiled a set of resources and ways to get involved. Californians — and people around the country — should reject punitive policies that will simply reboot mass incarceration instead of investing in proven solutions.
We wrapped up another busy year at the Prison Policy Initiative, and are thrilled to share our 2023-2024 Annual Report with you. We released 7 major reports, 32 research briefings, and two guides for journalists to support further investigative work on issues related to mass incarceration. We also provided technical support to advocates at the state and local levels working on issues such as ending prison gerrymandering, parole reform and fighting jail expansion. Here are a handful of accomplishments we’re particularly proud of:
Releasing a report on how jails and prisons misuse money from “inmate welfare funds” on staff perks or to cover budgetary gaps, rather than use those funds on services that benefit incarcerated people. We released a companion guide for press to encourage journalists to further investigate welfare funds in state prisons and particularly in local jails.
This is only a snapshot of what we produced this past year. We are proud of our accomplishments and look forward to sharing new projects with you in the year to come.
Easthampton, Mass. — A new report from the Prison Policy Initiative provides one of the most comprehensive 50-state compilations of “standard” conditions of probation to date, shining a light on the burdensome rules that govern the lives of nearly 3 million people and that doom many to inevitable further punishments. The report, One Size Fits None, and accompanying data organize probation rules from 76 jurisdictions into topical categories — allowing readers to compare rules in their state to other states, and exposing how these systems turn even everyday behaviors into acceptable reasons for re-incarceration.
For those unfamiliar with probation, the report serves as an accessible introduction to “standard conditions,” the rules that everyone under supervision in a given jurisdiction must follow. One Size Fits None answers questions like:
What aspects of people’s lives do probation rules typically address?
In which states are standard conditions of probation set at the state versus the local level?
What types of probation rules are at the discretion of probation officers to define?
How do standard conditions intersect with the life circumstances of people most likely to be on probation, including low-income people and people with mental health conditions or substance use disorders?
“Our analysis of 76 jurisdictions finds that people on probation must abide by 12 standard conditions every day, on average, plus any special conditions that a judge or an officer imposes,” said report author Emily Widra. “These rules are rigidly applied across the board, and have serious consequences for people who are already marginalized along lines of race, class, and disability.”
The report dives into the most common themes that standard conditions of probation fall under, including:
Financial requirements: In 64 out of 76 jurisdictions analyzed by the Prison Policy Initiative, probation rules require people to make regular payments, including monthly fees, drug testing or other treatment fees, or mandated support of legal dependents.
Rules impacting employment: Despite more than 60 jurisdictions requiring people on probation to maintain full-time employment or the pursuit of “a course of study or vocational training,” most jurisdictions also impose rules that make it harder for people to get and keep a job.
Movement restrictions: Almost all of the 76 jurisdictions studied restrict where people on probation can go, and 21 jurisdictions restrict people’s movements to within a county or district.
Association restrictions: At least 31 jurisdictions in the sample have rules restricting social relationships with categories of people. Only one — Arkansas — clarifies that unavoidable associations via work or treatment programs are not prohibited.
Other, vague conditions that expand criminalization, including stipulations to “be good,” “be truthful,” and “devote yourself” to work or education.
One Size Fits None issues sweeping recommendations to state and local lawmakers who wish to ensure that probation rules work toward, rather than against, the goals of probation. The recommendations urge states to reduce their use of probation overall, change how rule violations are treated, and pare down standard conditions to the essentials — eliminating those that are unnecessary and ineffective. The report also includes a sidebar highlighting jurisdictions that are working to reduce probation revocations.
“Probation conditions today are not only burdensome; they are often in conflict with one another, which puts people in impossible situations where violations are unavoidable,” said Widra. “Rather than continue with this counterproductive system, states and counties must rethink their standard conditions so that people are allowed to succeed.”
In Indian country jails, populations have rebounded from pandemic lows, the detention of women and older adults is increasing, and new offense type data raise questions about why so many people are incarcerated on tribal lands.
Native people are consistently overrepresented in the criminal legal system, accounting for only 1% of the total U.S. population but 3% of the incarcerated population.1 More specifically, the national incarceration rate of Native people is between two and four times higher than that of white people. Now, newly released data on jails in Indian country in 2023 provide more detail on this disturbing disparity: the Bureau of Justice Statistics (BJS) reports that, much like other jails across the country, Indian country jail populations are quickly bouncing back from the lows of the COVID-19 pandemic, and this growth has disproportionately impacted women and older adults.2
The Bureau of Justice Statistics (BJS) collects and publishes data about jail facilities on Native land separately — and with differing kinds of details — from other locally-operated jails across the country.3 In this iteration of the BJS survey on Indian country jails, the bureau collected new, more detailed information about offense types that are crucial to understanding the role of jails on Native land. They also reveal the troubling overuse of jails in response to non-criminal behaviors for youth and adults.
Jail populations in Indian country — like in jails across the country — were generally trending upward before a sharp decrease during 2020, which was the result of fewer arrests and slowed court processes during the pandemic; they have quickly resumed their upward trajectories in the years since.
Indian country jail populations continue to rise after COVID-19
Jail populations across the country — including local and Indian country jails — dropped dramatically during the first year of the COVID-19 pandemic (30% from 2019 to 2020). This temporary decline was primarily explained by fewer people being arrested and booked into jails, as well as slowed court processes. In 2020, Indian country jails saw their first decline in total jail populations since 2013.4 But jail populations on Native land and across the country quickly surged after the first year of the pandemic: from 2020 to 2023, the Indian country jail population grew by 19%, consistent with the 21% growth seen in local jail populations nationwide over the same time period. However, from 2022 to 2023, other local jail populations only ticked up by 0.2%, while the Indian country jail population rose by 7% over that single-year period. In other words, while rebounds in local jail populations are slowing, Indian country jail populations are rising more dramatically.
Women and older adults increasingly incarcerated in Indian country jails
Much like other parts of the criminal legal system, the growth of the women’s and older adult populations in Indian country jails has outpaced the growth among men and younger adults.
Women: Native women are disproportionately affected by almost every part of the criminal legal system. They are incarcerated at higher rates than women of any other racial or ethnic group. Additionally, women account for a larger portion of the Indian country jail population than they do in other local jails across the nation: in 2023, women represented over a quarter (26%) of adults incarcerated in Indian country jails, but only 14% of people incarcerated in other local jails. In the last three years, the number of adult women in Indian country jails has grown 37%, compared to only 15% for men. Prior to the COVID-19 pandemic, however, we saw this dynamic in reverse: from 2016-2019, the number of women in Indian country jails only rose by 5%, while the number of men rose by 19%. This suggests an alarming shift in the incarceration trends of women in Indian country since the pandemic began, in line with the escalating incarceration rates of women throughout the nation.
Older adults: There are limited historical data on the age of people incarcerated in Indian country jails: the Bureau of Justice Statistics only began collecting and publishing this information in 2021. But over this three-year period, the rise in the number of older adults incarcerated in Indian country jails has been consistent with national trends: between 2021 and 2023, the number of people 55 and older in Indian country jails grew by 38%, while the number of adults under 55 years old only grew by 9%. To be sure, these populations are fairly small in scale — the overall population increase from 2021 to 2023 was 220 people — but any upward trend in the incarceration of older people is worth examining.
Jailing increasing numbers of older adults is part of a terrible national trend of policing unhoused people, poor people, people who use drugs and alcohol, and people with cognitive disabilities. Housing instability, chronic diseases, poverty, and substance use all disproportionately impact Native people, and older Native adults are particularly vulnerable to arrest, detention, and the serious and harmful consequences of incarceration.
New offense data reveals troubling trends on the overuse of jails in Indian country
This iteration of the Jails in Indian Country series provides more data than previous years, including more specific categorizations of the offenses for which people have been detained. These additional details are welcome, especially in light of the limited offense data among jail populations in general.5 In previous years, large portions of the Indian country jail population were lumped together in an “other unspecified” offense category. In 2022, for example, 29% of offenses reported to the BJS were “other unspecified,” and this catchall category has been as high as 37% of offenses in 2015. The inclusion of additional offense categories6 in the most recent survey significantly reduced “other unspecified” offenses to only 8% of the total. Additionally, this is the first iteration of the survey to include mental health and civil commitment holds, unspecified warrants, and status offenses for youth. These additions clarify what’s driving population growth in Indian country jails, while illuminating troubling trends about the overuse of these jails at the same time:
Holds: The addition of the mental health and civil commitment holds7 in Indian country jails offers new insight into how often jails are used for questionable reasons. As we’ve argued before, detainers and “holds” contribute to unnecessary jailing, often keeping people in detention longer than necessary while awaiting psychiatric treatment or substance use treatment. Given the heightened prevalence of substance use disorders among Native people,8 the fact that people are in jail for mental health and civil commitment holds instead of receiving crucial healthcare reflects a serious dearth of treatment access on Native land.
Unspecified warrants: About 20% of people in Indian country jails are detained for warrants without a specified offense. Many of these detentions are likely for bench warrants related to a “failure to appear” in court given the lack of specific offense data. We know that many court responses to “failure to appear” — including jailing — do not actually promote public safety and are often a misuse of resources. That’s because most people who “fail to appear” are not actually evading justice or threatening public safety: nationally, 87% of people who miss criminal court dates are facing “nonviolent” charges for property, drug, and public order offenses. Considering around a quarter of all cases are eventually dismissed, many people who miss court face punishment even though they would likely not be convicted of the alleged crime that brought them into contact with the system in the first place.
Youth status offenses: More than 1 in 10 youth in Indian country jails are held for a status offense, or a “noncriminal act that is considered a law violation only because of a youth’s status as a minor.” This can include missing school, underage drinking, violating curfew, or running away. Native youth are disproportionately represented in status offenses across the country: in 2021, Native youth accounted for 4% of all status offense cases in juvenile court, while only 1.3% of the total U.S. population is Native. Status offenses carry serious consequences beyond jail detention: in 2021, 1,400 youth with status offenses were ordered to out-of-home placements including youth prisons, residential treatment, or group homes, separating them from family and community support systems.
“Crimes against vulnerable populations:” In this iteration of the survey, a sample of jails in Indian country were asked to report if they had any admissions (but not the actual number of admissions) for “crimes against vulnerable populations,” including human trafficking, kidnapping, or elder abuse over the course of a single month (June 2023). The Bureau of Justice Statistics (BJS) characterizes these additional questions as responsive to the “interest expressed by Congress, tribal leaders, and federal agencies” to illuminate “the types of persons being held.” At least 17% of all Indian country jails report admitting at least one person for elder abuse and at least 6% of Indian country jails reported admitting someone for kidnapping, while no facilities reported admissions for human trafficking in that month.9 We hope to see further innovations in future iterations and in the larger national BJS surveys as well. For now, it’s hard to put these findings in any kind of context as there is little data on the prevalence of these types of victimization, nor any detail about the people held on these charges in Indian country facilities.
Conclusion
The inclusion of new, more detailed data on jails in Indian country offers the public important insights into the incarceration of Native people on tribal lands. While these trends mirror what’s happening in jails elsewhere across the country, having this level of detail is nonetheless crucial to understanding how the criminal legal system impacts Native people and communities.
More transparency must be provided in the coming years to better inform and target advocacy that reduces Native incarceration and confronts glaring racial disparities in the criminal legal system. This is especially true considering much of this data has only become available in recent years, unfortunately limiting the historical record of Native incarceration.
Ultimately, we hope the Bureau of Justice Statistics will continue and expand the collection and dissemination of such detailed information — including detailed offense and demographic data — for people in Indian country jails and jails across the nation.
Footnotes
Throughout this briefing, “Native” refers to people identified by the Census Bureau as “American Indian/Alaska Native.” For a detailed discussion of how the flawed single-race categorization system obscures data on Native people throughout the criminal legal system, see our profile page on Native incarceration in the U.S. ↩
“Indian country” — with a lowercase “c” — is a legal and administrative term used in federal law (18 U.S.C. §1151) to refer to Native lands, including reservations, trust lands, and restricted fee lands in order to define the boundaries of political and legal authority. For more detail about the differences between Indian country and other related terms, see this resource from the Center for Indian Country Development. ↩
Jails in Indian country include all known adult and juvenile jails, confinement facilities, detention centers, and other correctional facilities operated by tribal authorities or the U.S. Department of the Interior’s Bureau of Indian Affairs (BIA). The BIA Office of Justice Services staffs and operates about a quarter of jails in Indian country, while the remainder are operated by Tribes. ↩
These additional offense specifications are all in the “nonviolent and other holds” category, and include motor vehicle theft, malicious destruction of property/vandalism, status offense (for youth), warrants, and mental health/civil commitment holds. ↩
Mental health and civil commitment holds are not criminal offense types; people detained for involuntary mental health holds may have underlying criminal charges, but are jailed because of their mental condition. Such holds can be extremely dangerous because jails are no place for people in a mental health crisis. “Civil commitment” is a broad category that most often refers to the court-ordered treatment of people with mental health or substance use disorders; however, many people end up locked up in jail rather than receiving the relevant treatment ordered by the court. Civil commitment can also refer to the post-prison confinement of people convicted of sex-related offenses in prison-like civil commitment facilities.
For more information about what mental health and civil commitment holds can look like, and the disastrous consequences of jailing people in crisis, see ProPublica’s investigation of Phillip Garcia’s 2017 death in Riverside County Jail. ↩
Rates of substance use disorders — and alcohol use disorder in particular — are extremely high among American Indian or Alaska Native people: from 2015 to 2019, over 12% of Native people meet the criteria for a substance use disorder, compared to only 8% of white people and Black people. ↩
Only 69 of Indian country jails eligible for survey participation (86%) responded to the relevant questions about “crimes against vulnerable populations.” Out of the 69 facilities that responded, 20% reported admissions for elder abuse and 7% reported admissions for kidnapping in June 2023. Applying these percentages to all 80 Indian country facilities participating in the Annual Survey of Jails in Indian Country, we find that 17% of jails reported admissions for elder abuse and 6% reported admissions for kidnapping. ↩
Whether on the presidential debate stage or in races for governor, state legislatures, or city councils, candidates for elected office are falling back on an old tactic: Making spurious claims that “crime is up” and pitching more jail and prison time as solutions to social problems. Not only are claims of higher crime demonstrably untrue; incarceration is never the simple fix that it appears to be. Jails and prisons — even when they are rebuilt and branded as “humane” — are still places of punishment, and investing in them consistently fails to produce safer communities or, obviously, to dismantle mass incarceration.
The arguments for more jail can seem endless. But if candidates campaigning for office in your community or state push the narrative that more incarceration is a good idea — or even a necessary evil — we’ve got you covered. Below, we lay out facts you can use to oppose bogus claims about what criminalization can achieve, whether in regard to homelessness, the fentanyl crisis, or public safety in general.
FACT 1: Jailing people who use drugs is counterproductive.
Amid an overdose crisis, many lawmakers and candidates for elected office are campaigning on arresting more people for drug use, especially in public spaces. These reforms are a blatant repackaging of policies from the “war on drugs,” and a step backward for public health.
Importantly, although they push for police interventions as a means of getting drug users into treatment, public officials often ignore that there may not be enough substance use treatment resources in the community to begin with. Oregon, which re-criminalized drug possession earlier this year, only has 50% of the treatment resources that the state needs. Once in jail, people who have been engaging in harmful drug use are not likely to get treatment, much less genuine care. In a briefing earlier this year, we showed that less than one-fifth of all county jails in the U.S. initiate medication-assisted treatment for substance use disorder, and scarcely half of all county jails even provide medication for withdrawal.
What’s more, being in jail can make substance use dangerous or even fatal. Data from 2018 show that drug- and alcohol-related deaths in jails have increased nearly fourfold since 2000, and the median time spent in jail before an intoxication death is just one day. While arresting people who use drugs publicly may help move some of them into treatment, for others, it makes their addiction more deadly — not a sensible public health policy.
FACT 2: More housing, not criminalization, is the answer to the homelessness crisis.
Many local and state leaders are beginning to harshly enforce their anti-camping laws in the wake of the Supreme Court case Grants Pass v. Johnson, which held that states have the right to sweep homeless encampments even when shelter beds aren’t readily available. But contrary to what many of these lawmakers say, punitive responses to the homelessness crisis are not “common sense.”
A lot of unhoused people are already carrying criminal convictions, which can make it prohibitively hard to find a place to live. We’ve discussed before how public housing authorities have — and use — wide discretion to deny housing to people with records or even just histories of arrest. For these individuals, homelessness may be the result of past encounters with police. For others, a brush with law enforcement or a stint in jail could make finding future housing less likely. In our 2018 report Nowhere to Go, we found that people who had been to prison were more likely to be homeless depending on how many times they had been incarcerated — each lockup increasing the likelihood of ending up on the street without housing prospects.
As others have pointed out, rising rates of homelessness across the U.S. are the result of a genuine housing crisis. Formerly incarcerated people and those at risk of incarceration are particularly in need. But there are policy responses that work. In a 2023 briefing, we found that long-term supportive housing programs that aren’t conditional on people being sober or accepting treatment have incredible rates of success at keeping people housed and out of jail.
FACT 3: The solution to overcrowded, inhumane jails is pretrial reform and community healthcare.
In counties and cities where jails are crowded or facing a long list of maintenance and repair costs, local officials up for election this fall will likely be pressed to vote on whether to build new, often bigger jails. (And in some counties, jail construction measures themselves are on the ballot.)
Elected officials at the county and city level often claim they “have no choice” but to expand or replace their jails (for instance, recently, in Cleveland and Sacramento). But these hugely expensive projects can fail to produce the results local governments want. In counties with overcrowded jails, building a bigger jail is supposed to make the incarcerated population easier to supervise and care for. But all too often, these projects lead to more incarceration — and the new jail becomes overcrowded as well.
In fact, counties do have a choice in how they deal with issues in their jails. Local courts and county sheriffs can work together to reduce the jail population through pretrial reform, something that we have shown can be achieved at no detriment to public safety. And in the many, many counties where the majority of people in jail have a substance use disorder, expanding community healthcare options is a lower-cost — and more effective — way to tackle addiction that also reduces the number of people behind bars.
FACT 4: “Truth in Sentencing” reforms turn prisons into overcrowded nursing homes with little to no public safety benefit.
Earlier this year, Louisiana’s “tough on crime” governor, Jeff Landry, and its legislature pushed through “Truth in Sentencing” laws that eliminated parole in the state’s prisons and barred people from earning time off their sentences. His regressive reforms are part of a recent wave of legislation, mainly in the South. However, bills similar to Landry’s have come to states like Colorado and Iowa as well.
Calling for more people to spend decades and likely die in prison is a popular campaign strategy. But the reality of Truth in Sentencing is brutal and counterproductive. The U.S. prison system is already becoming geriatric as people sentenced in the ’70s, ’80s, and ’90s get older. Eliminating parole and other mechanisms for early release (like good time, which Landry dismissively called “a participation trophy for jail”) will accelerate that trend. It will also swell prison populations, as in Louisiana, where the Crime and Justice Institute projects that the regressive reforms will double the state prison population. And as a consequence both of overcrowding and of the “greying” of prisons, more people in prison will get sick, leading to the type of ghastly medical situations that prisons are known for.
Given these massive drawbacks, it may be surprising that forcing people to serve more time in prison does not, in fact, improve public safety. If candidates for state legislator or governor propose these “tough” reforms in your state, remind them that “Truth in Sentencing” reduces incentives for incarcerated people to complete programming that can help them and their communities. And the Vera Institute’s research on the ineffectiveness of longer prison sentences may be helpful to have on hand, too.
FACT 5: Crime is down, not up.
Crime is not surging — even though candidates for elected office, including Donald Trump and others from both major parties up and down the ballot, pretend otherwise. Claims of crime hikes can be very persuasive: In October 2023, 77% of surveyed Americans believed there was more crime in the U.S. than there was the year before. But as both old and new data show, this is simply not true. New data from the Bureau of Justice Statistics on criminal victimization in 2023 shows that crimes of almost all types were down from 2022, and many types of violent crime were equal to or lower than their reported rates in 2019.
To be sure, crime can fluctuate rapidly in short periods of time. But elected officials spend several years in office, and should be campaigning on their ability to protect public safety in the long term. So what do the long-term crime data say? In short, in 2023, crime hit a 60-year low. Candidates for office shouldn’t be centering their campaigns around increases in crime that, in this long view, are momentary and quite modest.
Ending misinformation about safety goes beyond ending bogus claims about crime, too. Lawmakers should take a broad view of public safety by addressing real, harmful trends, like the housing shortage, economic inequality, and public health concerns. The people we elect to govern our communities have a wealth of information about the diverse drivers of crime and safety — and they should use it.
Conclusion
Lawmakers pushing for Truth in Sentencing, bigger jails, and other policies that expand the criminal legal system tend to claim that there is no alternative to these methods for making communities safer. But the alternatives that have been shown to work — housing first, harm reduction, expanded parole and “good time” — are often passed over by these same lawmakers, or are not given the chance to serve more than a handful of people in a pilot program. Meanwhile, the criminal legal system continues to consume hundreds of billions of dollars, even as prisons appear to become more and more inhumane.
It’s never too late to push your elected officials — and the candidates running to replace them — to try public safety strategies that focus on care, not cages. More or less every elected official has a role to play in dismantling mass incarceration, and the movement for that change must start with pressure from below.
Instead of taking advantage of their possibilities, the companies that got rich off prison phone calls offer limited book selections on tablets, as part of their continued efforts to sap money from incarcerated people and their families.
Books have long served as a bridge to the outside world for incarcerated people. They allow people cut off from their normal lives — and often from their families — to engage with thinking and ideas that can open their mind and stories that transport them anywhere on earth and beyond. But carceral authorities have also always restricted access to books, and reading behind bars has only become harder in recent years.
This year’s Prison Banned Books Week highlights the role tablets are ironically playing in further restricting incarcerated people’s access to reading materials. To better understand these changes, we looked at data collected by the Prison Banned Books Week campaign on prison book bans, policies around books, and the availability of ebooks on tablet computers.1 What we found is that tablets limit access to important modern writing and knowledge behind bars.
Tablets are nearly everywhere
When we last looked at the availability of prison tablets in 2019, they were relatively new and rare behind bars. Only 12 states had them. Since then, the technology has quickly spread. Today, at least 48 prison systems indicate they have tablets or, as in the case of Alaska and Nevada, are in the process of implementing tablets.2
Nearly every prison system now has tablets — and two companies dominate the market
The two companies providing tablets to the most state prisons are Securus/JPay and ViaPath/GTL. Perhaps this should come as no surprise since these two companies have long been the largest providers of telecommunication services for incarcerated people. They control roughly 80% of both the phone and e-messaging markets behind bars.
Importantly, these companies have shifted their focus to tablets as the prison and jail voice and video calling market has come under increasing scrutiny and regulation. Tablets behind bars have not undergone the same oversight, leaving companies like these free to use the devices to continue squeezing money from incarcerated people and their families for services like e-messaging, digitized mail, and music streaming.
Physical books are increasingly rare behind bars
The rapid expansion of tablets behind bars has occurred at a time when access to physical books in prisons has become increasingly rare.
This situation has become even more dire in recent years as more states have implemented content-neutral book bans that restrict families and friends from sending books directly to their incarcerated loved ones. These policies mandate that books sent to people in prison can only come from a limited selection of approved vendors. This means that friends, family, churches, libraries, nonprofit organizations, and others who want to send books directly to people in prison can no longer do so. Instead, they must purchase titles from the vendor hand-picked by the prison and have that vendor send the books directly to the facility. A 2023 study by PEN America found 84% of prison mailrooms they surveyed had implemented these sorts of bans, even when it was not the statewide policy.
Of course, even facilities that still allow people to send books to their incarcerated loved ones dramatically restrict what they can read. A 2023 review by the Marshall Project found that state prisons explicitly ban over 50,000 books. However, that only tells a part of the story. At least 23 states, along with Washington, D.C. and the Federal Bureau of Prisons, do not have written lists of explicitly banned books but instead say they evaluate books on a case-by-case basis, providing mailroom staff with immense discretion to implement already vague rules, with little oversight.
It will come as little surprise that one of the most frequently cited reasons for a prison to ban a book is “security.” However, it is clear this reasoning is applied indiscriminately and often in situations where no reasonable security threat exists. For example, in 2022, Texas prisons banned the second edition of Merriam-Webster’s Visual Dictionary on security grounds because it contained a picture of a gun. And it would likely surprise many that the most banned book in American prisons is a cookbook. Prison Ramen details how incarcerated people can use ingredients often sold at commissaries to add flavor to ramen (another common item in prison commissaries). Perhaps prison authorities worry that the book’s recipe for “Shawshank Spread” might serve as inspiration for people behind bars. And of course, it goes without saying that there is little to no evidence that any of these books explicitly banned in prisons have ever led to any actual security incident.
Tablets aren’t filling the gap
Prisons often claim that the addition of tablets behind bars will increase access to books, despite other book bans they have implemented. Unfortunately, though, because of limited and outdated ebook selections, tablets are not living up to their potential and likely aren’t even filling the emerging book-gap.
The companies behind these tablets often boast that they offer access to tens of thousands of free books, which sounds quite impressive until you examine their offerings more closely. For example, none of the best-selling books released since the year 2000 are available on Securus/JPay tablets in Georgia. It is hard to imagine that prisons can attribute this to security concerns since many Harry Potter books — which are considered a rite of passage for many young readers — and The Purpose Driven Life — a bible study book written by Pastor Rick Wilson — are among those best-sellers that are not available.
Instead, most of the books that are available on tablets come from Project Gutenberg, a collection of free ebooks. Importantly, these books are free because their copyright expired when they reached 100 years old.3 Undoubtedly, this collection includes some important classic books. However, their age — and the companies’ decisions not to offer newer books — creates some significant problems. For example, you likely won’t find books by author and civil rights activist James Baldwin on these tablets. However, you’ll likely find Yankee Girls in Zulu Land, a book that is over 130 years old and is known for its racist ideas and sentiments.
Additionally, not all tablets even offer ebooks. Michigan’s tablets have no reading material and the state has a statewide approved vendor policy that limits incarcerated people’s book purchases to four booksellers, making reading costly and inaccessible in Michigan prisons.
Making tablets work for incarcerated readers
Prison tablets are not inherently bad, but the ways that facilities and companies have implemented them are. Tablets can and should provide new opportunities for incarcerated people to engage with high-quality books and other content in ways that don’t sap them of what little money they have.
The single most important step that prisons can take to make tablets work in the best interest of incarcerated readers is by forcing the companies to offer other apps that give incarcerated people access to the catalogs at their local libraries. Apps like Hoopla offer free access to selected ebooks, audiobooks, movies, and more from local libraries. Communities are already paying to provide access to these materials to people outside of the prison walls, it only makes sense to expand that access to people locked up in prisons, too.
The companies behind these tablets will certainly resist this effort because it would likely cut into their bottom line. Their track record shows that profit, not the well-being of incarcerated people, is their driving force. However, prison officials have the upper hand in contract negotiations. If a few states band together to demand access to materials from the local library on tablets, the companies would be forced to respond or else risk devastating revenue losses.
Of course, prisons all too often collude with telecom providers to make money by squeezing incarcerated people for goods and services they can’t refuse. But even if prisons aren’t moved by a desire to help the people in their care, state lawmakers should pay attention to prisons’ policies around reading. We know that when people who are incarcerated stay connected to the outside world, it improves their mental and physical well-being and prepares them for their release. States should do more to ensure that tablets are operating in the best interest of the people who use them.
Footnotes
It is important to note that this analysis only looks at prison policies, and does not look at local jails. Jails generally have fewer resources and offer fewer services to incarcerated people, so it is reasonable to assume that the issues raised in this briefing are likely even worse in local jails. ↩
Louisiana, Mississippi, Utah, and Oregon did not respond to FOIA requests for information about tablets inside their facilities. ↩
It is worth noting that tablet companies initially charged incarcerated people to access these free books. After public pressure, they ultimately made these books free, however the incident exemplifies the ways these companies attempt to unfairly extract money from incarcerated people and their families. ↩
Election Day is right around the corner. While presidential campaigns get most of the attention from the news media, many lesser-known down-ballot races can have a much more dramatic impact on criminal legal system reform in America.
For voters interested in ending mass incarceration, we’ve put together a guide to the most common offices for which they will cast their ballots this November. We also explore how those offices can make decisions to reduce the number of people behind bars, improve conditions in prisons and jails, and help turn the page on America’s failed experiment with mass incarceration.
It’s worth recognizing that there are significant differences in what an office might be called and its exact responsibilities from state to state and city to city, so readers should keep in mind that this might not be a perfect match for their area. Additionally, it would be impossible to list all of the complex and far-reaching ways some offices influence the criminal legal system. This guide focuses on the most common and consequential offices and responsibilities in this realm and is not intended to be all-encompassing. With this guide, we aimed to give people a starting point for their research to better understand the roles and powers of the offices they’ll be asked to vote for.
Readers should use this guide to evaluate their candidates for office, press them to take clear stands on how they’ll use their position to improve the criminal legal system if elected and hold them accountable for those commitments once they take office.
Local Offices
Most of the day-to-day interactions that people have with the criminal legal system involve local governments. Local governments are responsible for a wide swath of related activities, including policing and law enforcement, the prosecution of criminal laws, and conditions and policies at local jails.
District/County Attorneys
Because of their immense power, government prosecutors known as district attorneys (sometimes called county attorneys) loom large in any discussion about the criminal legal system and what can be done to reform it. And it is important to remember that the person who holds this office has immense discretion in how to use this power.
They oversee the vast majority of criminal cases in their jurisdiction. Not only do they determine which types of offenses to prioritize for prosecution, but in individual cases, they also determine whether to bring charges against someone and, if so, for what crime.
“You forgot an office”
Some states have unique offices that play a role in the criminal legal system. Here are a few.
In this guide, we tried to cover as many of the elected offices that can play a role in the criminal legal system as possible, but we know we didn’t cover everything. There are many offices that we did not include that are unique to one or a handful of states that can also take action on these issues. They’re still worth focusing on.
Here are a few examples:
Public Defenders: Some places elect their public defenders, including counties in Florida and districts in Tennessee, as well as the cities of Lincoln, Nebraska, and San Francisco, California,
High bailiffs: Vermont’s high bailiff office has often been overlooked as an opportunity for reform. However, recent candidates have seen this office as an opportunity to provide more oversight of law enforcement in their counties.
Police oversight boards: Some places, including Chicago, have elected police oversight boards. This board is designed to give the public more say over the activities and priorities of their local police department.
Governor’s Council: At least one state, Massachusetts, elects members to its Governor’s Council. This body has a long list of responsibilities, but of note, it is responsible for hearing pardon and commutation petitions and approving appointments of state judges. This gives the board considerable ability to decide when people are released from prison, as well as who the judges are that are overseeing criminal cases.
We encourage you to look at your ballot closely before Election Day to see what offices you’ll be asked to vote for. If you’re not sure what a particular office does, do some additional research to see if they, too, can help end mass incarceration where you live.
Additionally, while they don’t directly set bail conditions — judges generally do that — they usually recommend whether a person should be offered bail and, if so, whether they must pay money to go free before their trial. Their recommendations hold immense weight in these judicial decisions.
They also serve as gatekeepers to diversion programs. These programs allow people charged with crimes to resolve their cases without a criminal conviction and, in many cases, without incurring charges. The district/county attorney decides what those diversion programs look like, whom they are offered to, and what happens when someone completes it.
While this explanation covers the most prominent parts of the district attorney’s job, it is certainly not exhaustive. To learn more, we recommend reading Fair & Just Prosecution’s report, 21 Principles for the 21st Century Prosecutor, which goes into much greater detail.
Sheriffs
Sheriffs play many roles in the criminal legal system that can vary greatly from state to state and county to county. Generally speaking, though, their core responsibility is running the county jails, making them responsible for managing the conditions in which people are detained pretrial.1 Importantly, in this role, they’re responsible for the health and safety of people who are in their custody, including what health services they have access to while incarcerated. Additionally, they enter into contracts with private companies that provide services, such as phone calls, commissary sales, and tablet computers. They decide what people detained in their jails are charged for these services.
Additionally, many sheriffs also conduct law enforcement activities and criminal investigations. This gives them wide latitude in determining who is arrested and for what offenses.
Finally, some sheriffs also oversee probation programs and officers. In this role, they have a huge impact on the lives of people on probation. They can prioritize the person’s successful completion of the program in a way that keeps them from being arrested or incarcerated again, or they can prioritize punishment by strictly enforcing arbitrary and often expensive conditions that set people up to fail.
County Commissioners
County commissioners2 generally have two primary responsibilities when it comes to the criminal legal system.
First, they provide oversight of the county jail, including setting budgets and approving contracts for services. Notably, they are also often responsible for considering proposals for new jail construction. During debates about building a new jail or expanding an existing one, county commissioners have powerful leverage that they can and should use to ensure that prosecutors and law enforcement are doing everything they can to reduce the number of people stuck in jails unnecessarily.
Second, they allocate funding and, in some jurisdictions, provide oversight of the county sheriff’s department. This can influence the law enforcement presence in the community and the activities the department is tasked with prioritizing.
Mayors and City Commissioners
These offices are responsible for supervising the local police department. This includes determining its funding, providing some oversight of its activities, and selecting its chief. Through these choices, they determine the size, scope, and priorities of the police departments in their communities.
Additionally, they set funding levels for other community resources that can prevent law enforcement interactions in the first place. For example, they could direct funding to expand mental health services, drug treatment options, or pre-police diversion programs in their area.
City/County Auditors and Controllers
City and County Auditors do far more than just monitor the spending of agencies (although they can, in fact, do that). They also look at the overall performance of key departments. For example, they can look at how jails are administering their welfare funds, how police departments are responding to the needs of the communities, jail conditions, the administration of the county’s bail practices, how public housing and health care providers are delivering services, and much more. Through their work, auditors and controllers can act on behalf of residents of their community to provide much-needed transparency and ensure their government is properly and effectively serving them.
Local Judges (including Justices of the Peace)
Local judges play multiple roles in the criminal legal system. While they are intended to be unbiased arbiters between the prosecution and defense in criminal cases, their decisions can have a huge impact on whether a person is convicted and whether they serve time behind bars — both before and after a conviction. They preside over a person’s initial court appearance after their arrest, at which time they’ll determine whether they can be released from jail, whether they have to pay cash bail to be released, and if there are any other conditions of their release. They also oversee criminal proceedings in the courtroom when a person goes to trial. In this role, they participate in decisions around who is selected as jurors, what evidence can be admitted, how the trial is run, and determining their sentence (if convicted). Importantly, they also set conditions a person must abide by when they are on probation.
Coroners
When someone dies unexpectedly, coroners often conduct medical examinations to determine the person’s manner and cause of death. Their findings and reports are often pivotal in criminal investigations and hold immense weight in criminal trials. Coroners can help expose the truth in criminal cases. Conversely, though, their mistakes can also send people to prison for crimes they did not commit. Importantly, corners are also often responsible for investigating the deaths of incarcerated people.
City/County Clerks (sometimes known as Supervisor of Elections)
This office, which has many different names across the country, has a key interaction with the criminal legal system: jail voting. Most people in jails are still eligible to vote but are prevented from doing so by a complex set of barriers. This office can help clear those barriers. They can work with local jails to make it easier for people detained there to register to vote and cast their ballots. A growing number of places in the country have even established polling locations in jails to make it easier for incarcerated people to have their voices heard.
School Board Members
The intersection of education and incarceration is complex. In short, we know that people with lower educational attainment are more likely to be incarcerated. So, in essence, every choice school board members make can help reduce incarceration in the community in the long run.
There are additional — more direct — choices that school board members make related to the criminal legal system. The first is whether or not police have a presence in schools as school resource officers. Second, school boards also set disciplinary policies, many of which are directly linked to the “school-to-prison pipeline,” such as when a student is suspended or expelled and when law enforcement is called for disciplinary activities in the schools. Both of these choices can result in children being tangled in the criminal legal system at a young age. Finally, in some places, they also are responsible for ensuring students in the juvenile justice system have equitable access to quality education.
State Offices
State government looms large in the criminal legal system. Not only are state prisons the largest incarcerators in the country, locking up over 1 million people every day, but states also write and enforce the laws that most frequently result in people being locked up in the first place.
Governors
Governors lead their state’s government, so naturally, their power and responsibilities are far-reaching. However, there are several specific areas that have a particularly dramatic impact on the size, scope, and conditions of the criminal legal system in their state.
One of the most important things they do is appoint the head of their state’s Department of Corrections, which runs state prisons.3 This agency is responsible for the health and safety of people incarcerated, how those facilities operate on a day-to-day basis, and how much incarcerated people (and their families) pay for things like phone calls, commissary items, and more. It also shapes policies around the use of good time credits, parole, and compassionate release.
An underappreciated role of governors is appointing people to state boards and commissions. The people appointed to these bodies can have a huge influence on how state government runs, and their decisions often go unnoticed by the public and the media. Notably, in many states, governors appoint people to their state’s parole board, a body that determines whether people who have served time behind bars are released or not. Additionally, in states that have prison ombuds, the governor often appoints the person who serves in that position.
Similarly, governors have the power to issue pardons and commutations for people convicted of state crimes. These can result in a person being released from prison early or undoing some of the worst collateral consequences of their conviction. Unfortunately, though, governors have woefully underused this important power.
Finally, governors sometimes appoint state judges to the bench. We discuss the role of judges in other parts of this guide, but in general, they are responsible for presiding over criminal cases, including determining the sentence for people found guilty and, in some instances, determining whether laws passed by the state are unconstitutional.
Attorneys General
Attorneys General are often called the top law enforcement officer in the state, and for good reason. While the specific duties and responsibilities vary significantly from state to state, generally speaking, this office plays an oversight or coordinator role for county/district attorneys in their state, often helping to set standards for criminal prosecutions. In addition, they can investigate and prosecute some serious criminal cases on their own. If a person is convicted of a crime and appeals that conviction, this office generally argues against those appeals.
Importantly, this office also represents the state when it faces civil lawsuits. For example, if a family sued the state government over poor prison conditions, the attorney general would likely represent the state in that case.
An often overlooked responsibility of many attorneys general is enforcing their state’s public records law. Prisons, jails, and court systems routinely unfairly deny requests for public records that should legally be accessible. In many states, advocates and journalists who have had their requests denied can often ask the attorney general of their state to intervene and force the facilities to produce the records.4
Secretaries of State
Secretaries of State generally oversee elections in their state. In this role, they can take action to improve ballot access for people who are currently in jail (and, in a few states, for people in prison, too). A motivated secretary of state can prioritize voter registration in these facilities and proactively address problems people who are incarcerated may face when attempting to cast their ballot. Additionally, they often provide guidance to local election officials, which gives them the chance to further improve ballot access.
State Legislators
State legislators have one of the most important and often overlooked roles in the criminal legal system. It is not an exaggeration to say that the only constraints on their abilities are state and federal constitutions, money, and their imagination. Their primary responsibility is writing and passing laws. They determine what is a state crime, the punishment for those offenses, the conditions a person will face after they are released, and much more. State lawmakers have so much power, in fact, that we put out an annual report highlighting dozens of actionable steps they can take to reform the criminal legal system without making it bigger.
In addition to passing laws, state legislators are also responsible for developing a state government budget that allocates money to state prisons and many law enforcement agencies. Through this action, they can influence the size and number of prisons in their state, the conditions in those prisons, and the role of law enforcement in their communities.
Notably, state lawmakers also can serve on legislative oversight committees that review the activities of government agencies, including state prisons.
State Auditors and Comptrollers
While the exact responsibilities and titles differ significantly from state to state, state auditors and comptrollers are generally tasked with assessing how well state agencies are doing their jobs and spending money. This goes beyond simple accounting. They can look at any number of activities of their Department of Corrections or state law enforcement officials. For example, a 2020 audit by the Massachusetts State Auditor found the state’s Department of Corrections was not processing sick-call requests from incarcerated people as quickly as required and was not fulfilling its obligations to incarcerated people upon their release. Used correctly, these can be powerful offices for exposing the mistreatment of people in the criminal legal system and the mismanagement of public dollars.
Utility Commissioners
Utility Commissions are tasked with regulating the state’s utility companies, such as electric providers, phone companies, and similar businesses. While it may seem like this has little to do with prisons and jails, in some states, these officials have played a critical role in reducing phone rates behind bars. For example, changes made by the Iowa Utilities Board to jail phone rates saved the loved ones of incarcerated people roughly $1 million every year. While the Federal Communications Commission recently approved rules that will significantly reduce voice and video calling rates in prisons and jails, the work of Utilities Commissions is not done. They can still take action to address the rapidly expanding presence of tablets and other telecom services behind bars to ensure that incarcerated people are not taken advantage of.
Appellate Court Judges
After a person is convicted of a crime, they have a right to appeal their conviction. That’s where appellate court judges come in. They oversee these appeals to determine whether the trial was held in a manner that was fair and respected the constitutional rights of the person convicted of a crime. They have the power to affirm or overturn a person’s criminal conviction or sentence.
Supreme Court Justices
State supreme courts are generally considered the most powerful court in their state. If a person convicted of a crime is unsuccessful at appealing their case in front of the appellate court judge, they can ask the state supreme court to hear the case as well.
Additionally, these courts are tasked with assessing the constitutionality of laws and policies related to the criminal legal system. This can include a wide variety of issues, such as policing practices, prison and jail conditions, and whether state laws violate a person’s constitutional rights.
Federal Offices
The federal government’s role in mass incarceration is vast and complex. Even though the federal prison system holds only about one-quarter as many people as state prisons collectively do, the federal government is still responsible for 98 federal prisons and 142 immigration detention facilities. Also, through the Department of Justice, it oversees federal law enforcement and criminal prosecutions.5
President
Like governors, the ways the president can impact the criminal legal system are vast.
One of the most consequential decisions they make is who they appoint to be Attorney General of the United States. This person will oversee the Federal Department of Justice, which prosecutes all cases involving allegations of federal crimes. Similarly, the president appoints U.S. Attorneys who oversee those prosecutions. The Attorney General and U.S. Attorneys have considerable latitude on which cases to pursue, which crimes are prosecuted, and the desired punishment if a conviction is secured. Additionally, the Attorney General oversees the Bureau of Prisons (BOP), which operates all federal prisons. The BOP is responsible for a wide range of prison conditions, including the health and safety visitation policies and communication options for people incarcerated at its facilities.
Presidents are also responsible for signing (or vetoing) bills passed by Congress. And even before a bill makes it to their desk, they work with lawmakers to shape that legislation. These laws can have far-reaching effects, as we discuss below when talking about the responsibilities of members of Congress.
One of the president’s most long-lasting impacts comes through his or her appointments of federal judges, including U.S. Supreme Court Justices. In addition to hearing federal criminal cases, federal judges often also interpret laws to determine whether they violate the U.S. Constitution.
The president also appoints members to boards and commissions focused on a wide range of issues. For example, the president appoints commissioners to the Federal Communications Commission, which recently slashed calling rates in prisons and jails. The president also appoints members to the Federal Trade Commission, which oversees many consumer issues, including junk fees in prisons and jails. They also appoint members to the U.S. Sentencing Commission, which has a hand in determining the severity of sentences for people convicted of federal crimes.
Finally, presidents have the power to issue pardons and commutations for people convicted of federal crimes. Unfortunately, though, they rarely use this power. Through these acts, the president can either reduce the sentence of someone convicted of a crime or undo some of the worst consequences of that conviction.
Members of Congress
Like state legislators, the principal responsibility of members of Congress is passing laws. Through these laws, they determine what actions are considered federal crimes and the potential sentences for people convicted of those crimes. They can also pass legislation to address issues related to prisons and jails at the federal, state, and local levels of government. For example, members of Congress have brought forward a bill to end prison gerrymandering nationwide.
The other principal responsibility of members of Congress is developing and passing a budget that determines how much money is allocated to federal agencies, including the Department of Justice and the Bureau of Prisons. These budgets can have wide-ranging implications for the number of people incarcerated, the number and condition of prisons, and the availability of community-based services and health care.
Notably, members of the U.S. Senate are also responsible for considering and confirming many appointments made by the president — including the appointment of federal judges and the U.S. Attorney General. This allows them to affirm or deny whether a person has the experience, temperament, and priorities to serve in that position.
Making your voice heard
No single elected official built America’s broken system of mass incarceration. And no one officeholder can end it singlehandedly. Accomplishing that will require a wide focus on elected offices up and down the ballot.
This guide is not all-encompassing. America’s elections are diverse and complex, so it would be impossible to cover every office that influences the criminal legal system and every responsibility of those offices. Instead, as you prepare to head to the polls, we hope this guide helps you better understand how the offices you’ll be asked to vote for can use their power to reduce the number of people behind bars and improve conditions for those who remain incarcerated. After the election, we hope you’ll use it to hold those elected officials accountable, too.
With Election Day approaching, visit Vote.org to register to vote (or check your registration status) and make your plan to make your voice heard at the ballot box.
(Author’s note: We’d like to thank the team at Bolts Magazine for their insights as we put together their guide. Bolts is a nonprofit newsroom that covers issues related to elections and the criminal legal system.)
Footnotes
Some people who are sentenced to less than one year of incarceration are also held in jails, putting them under the purview of sheriffs. ↩
Some of the positions are called dramatically different things in different states. For example, in Texas they are call “county judges” and serve on the Commissioners Court — not to be confused with the judges we discuss below. And in Louisiana, the county commission is often known as the “police jury.” ↩
In the six states with “unified” systems — Alaska, Connecticut, Delaware, Hawaii, Rhode Island, and Vermont — the agency is also responsible for overseeing both the pretrial and sentenced populations. ↩
Students and teachers are heading back to the classroom. In addition to math, science, and language arts, many will also focus on the criminal legal system and mass incarceration. Unfortunately for them, the carceral system operates like a black box, making it hard to study what’s happening inside the walls of prisons and jails. Fortunately, we have made it our business to make the data that does exist as accessible and understandable as possible.
To better support the work of students and teachers, we’ve curated a list of publications and tools they can use to better study the carceral system and that can serve as launchpads for further research.
Where to start: The big picture
To start any lesson on mass incarceration, you have to understand the U.S. doesn’t have one criminal legal system; instead, it has thousands of federal, state, local, and tribal systems that incarcerate a combined population of nearly 2 million people.
Our flagship report, Mass Incarceration: The Whole Pie, puts these pieces together to give the “big picture” of mass incarceration by explaining not only the scale of our carceral system but also the policy choices that have driven its expansion. It provides the most comprehensive picture of how many people are locked up in the U.S., in what types of facilities, and why. In addition to showing how many people are behind bars on any given day in the U.S., it goes on to bust 10 of the most persistent myths about prisons, jails, crime, and more.
Additional reading assignments:
Our briefing on states’ reliance on excessive jailing explains the drivers of jail growth including the practice of renting jail space to state and federal agencies like the U.S. Marshals Service. The appendices include useful data on jail trends and population data over time.
Our Punishment Beyond Prisons report looks at how many people in each state are on probation or parole. Notably, some of the states that are the least likely to send people to prison are among the most punitive when other methods of correctional control are taken into account.
States of Incarceration: The Global Context shows how incarceration rates in the U.S. compare to countries across the globe. Although El Salvador has the highest incarceration rate of any country, the U.S. still has the highest incarceration rate of any independent democracy on earth — worse, every single state incarcerates more people per capita than most nations.
An essential lesson: Disparities in the system
No lesson about mass incarceration in America is complete without covering the stark racial disparities inherent in the system. Black people, for example, not only have higher incarceration rates than white people but are also more likely to receive harsher sentences, including life without parole and the death penalty.
To help teachers and students understand these disparities better, we produced a dataset containing over 100 state-specific graphics showing the number of people in state prisons and jails by race, ethnicity, and sex. Our data compares Black and white imprisonment rates by state, finding that every state locks up Black people at a rate at least double that of white people — and, on average, at six times the rate of white residents.
Every state incarcerates Black residents in its state prisons at a higher rate than white residents. For comparisons to other race/ethnicity categories, see individual state profile pages.
Additional reading assignments:
Our Native incarceration page contains current data on the incarceration of Native people in jails, prisons, and Indian country jails. In jails, Native people have more than double the incarceration rate of white people, and in prisons, this disparity is even greater.
Racial disparities aren’t the only disparities in the system. Our 2021 briefing on the system-involvement of LGBTQ people details how they are arrested, incarcerated, and subjected to community supervision at significantly higher rates than straight and cisgender people. This is especially true for trans people and queer women.
Gender studies: Women’s incarceration
Students and teachers looking to examine the carceral system must understand the unique ways that women experience mass incarceration in America.
Our Women’s Mass Incarceration: The Whole Pie report provides the most recent and comprehensive data on how many women are incarcerated in the U.S., in what kinds of facilities, and why. The report also includes rare self-reported data from a national survey of people in prison to offer new insights about incarcerated women’s backgrounds, families, health, and experiences behind bars. It examines why women’s incarceration has grown so rapidly in recent decades and explains that, because they are often primary caregivers to children, they’re not the only ones harmed by incarceration.
Additional reading assignments:
Our briefing on how the fall of Roe v. Wade impacts women on probation and parole includes state-level data on how many women are under community supervision in states with abortion restrictions.
Our 2020 briefing highlights the role that drug enforcement has played in the rise of women’s incarceration and makes clear why we need to pay attention to the ways that women are uniquely impacted by the legal system.
Care not cages: Incarceration and public health
People in prisons and jails are disproportionately likely to have chronic health conditions as well as substance use and mental health problems. Medical care in correctional facilities is notoriously inadequate, and because most prison systems charge copays for medical care, it also deters incarcerated people from seeking the care they need.
Our Chronic Punishment report shows that instead of “rehabilitating” people in prison (physically, mentally or otherwise), or at the very least, serving as a de facto health system for people failed by other parts of the U.S. social safety net, state prisons are full of ill and neglected people.
Additional reading assignments:
Jails and prisons are often described as de facto mental health and substance abuse treatment providers, and corrections officials increasingly frame their missions around offering healthcare. But as our briefing on the lack of drug treatment in jails and prisons makes clear, most systems fail to provide evidence-based treatment options and instead rely on punitive responses to substance use.
In our briefing on the aging prison population, we examine the inhumane, costly, and counterproductive practice of locking up older adults that is the consequence of a series of disastrous policy decisions in policing, sentencing, and reentry over roughly the last half-century.
Our briefing on environmental injustice in prisons highlights how toxic detention facilities put the health of incarcerated people at risk. From having contaminated water to being sited near federal Superfund sites, prisons expose incarcerated people to hazardous substances that create additional health issues behind the wall.
Extra credit
Our website is chock full of data that can be used to further explore incarceration trends or dive deeper into issues related to mass incarceration:
State Profile pages: contain current state-level data and visuals on a range of issues, including racial disparities and incarceration rates
Data Toolbox: provides links to our unique datasets, including national and state-level population data
Research Library: the nation’s largest online database of empirical and policy research about criminal legal issues, including mental health, community impacts of incarceration, and conditions of confinement
Data Sources guide: includes descriptions of data sources we use to produce research exposing the harms of mass incarceration
April 15-17, 2025: Sarah Staudt, our Director of Policy and Advocacy, will be attending the MacArthur Safety and Justice Challenge Network Meeting from April 15-17 in Chicago. Drop her a line if you’d like to meet up!
Not near you? Invite us to your city, college or organization.


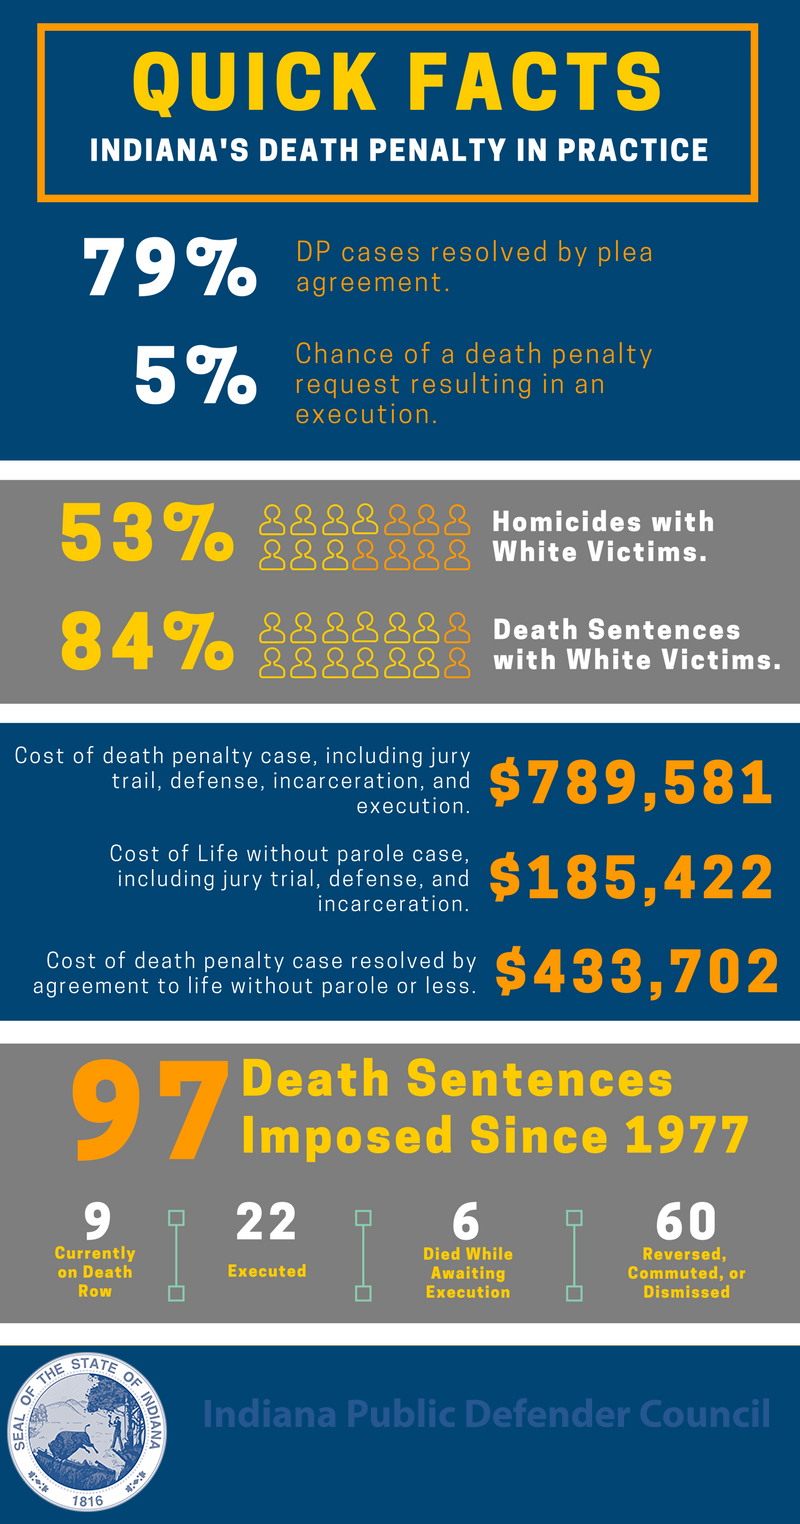