New data on the overuse of probation and parole, insights into the racial disparities in prisons and jails, and much more. Here are the highlights of our work in 2023.
2023 was a big year at the Prison Policy Initiative. We exposed how the overuse of probation and parole serves to extend the prison walls into our communities, produced new datasets and graphics that show just how vast the racial disparities in prisons and jails actually are, and highlighted how the same companies that profited off of over-priced prison phone calls have moved into the e-messaging industry. Didn’t catch everything we published in 2023? We’ve curated a list of some of our best work from this year below.
We released an update of our flagship report, which provides the most comprehensive view of how many people are locked up in the U.S., in what kinds of facilities, and why. It pieces together the most recent national data on state prisons, federal prisons, local jails, and other systems of confinement to provide a snapshot of mass incarceration in the U.S.
Women experience a dramatically different criminal legal system than men do, but data on their experiences is difficult to find and put into context. To fill these data gaps, we also released an updated Women’s Whole Pie report in partnership with the ACLU Campaign for Smart Justice, which includes richly-annotated data visualizations about women behind bars.
Our report shows the full picture of correctional control in the U.S., with a particular focus on the overuse of probation and parole. It includes data for all 50 states and D.C. on the number of people under correctional control, including community supervision. We’ve designed this report specifically to allow state policymakers and residents to assess the scale and scope of their entire correctional systems. Our findings raise the question of whether probation and parole systems are working as intended or whether they simply funnel people into prisons and jails — or are even replicating prison conditions in the community.
To better understand the explosive growth in e-messaging, we examined all 50 state prison systems, as well as the Federal Bureau of Prisons (BOP), to see how common this technology has become, how much it costs, and what, if anything, is being done to protect incarcerated people and their families from exploitation. Our review found that, despite its potential to keep incarcerated people and their families connected, e-messaging has quickly become just another way for companies to profit at their expense.
We released new data visualizations and updated tables showing the national landscape of persistent racial disparities in state prisons and local jails. Unlike other datasets, ours provides apples-to-apples state comparisons in three formats: counts, rates, and percentages. Using this data, we’ve updated over 100 of the key graphics on our State Profile pages, showing prison and jail incarceration rates by race and ethnicity, and how the racial composition of each state’s prisons and jails compares to the total state population.
Twenty states and the federal Bureau of Prisons detain over 6,000 people, mostly men, who have been convicted of sex-related offenses in prison-like “civil commitment” facilities beyond the terms of their criminal sentence. This deep dive into recently-published data from a survey of individuals confined in an Illinois civil commitment facility sounds the alarm about how these “shadow prisons” operate and the high rates of violence and trauma that people detained in the facilities are subjected to.
Our briefing examines the inhumane, costly, and counterproductive practice of locking up older adults. The U.S. prison population is aging at a much faster rate than the nation as a whole — and older adults represent a growing portion of people who are arrested and incarcerated each year. And while prisons and jails are unhealthy for people of all ages, older adults’ interactions with these systems are particularly dangerous, if not outright deadly.
Our briefing assesses the legislative action taken by 12 states and the federal government to address the growing crisis of family separation caused when a primary caregiver is incarcerated. All too often, incarceration destroys family bonds as parental rights are terminated or children end up in foster care. We explain how advocates across the country are fighting for creative and holistic solutions.
With parole board practices in the news, we thought it was important to look around the country and evaluate the direction in which state parole boards are moving. We surveyed 27 states and found only 7 saw an increase in their parole approval rate since the pandemic began, and almost every state held substantially fewer hearings than in years past.
In response to a move by New York prison officials in May to introduce a policy to effectively suppress prison journalism, we released a briefing building off of data from the Prison Journalism Project that detailed restrictions on prison journalism in prison systems across the country. Prison journalism affirms some of our most basic democratic principles — the exercise of speech free from government influence — and is an essential check on the extreme power these institutions wield over life and death.
Adding to our 50 State Profile pages, we’ve created a profile of Native incarceration in the United States to illuminate what data exists about the mass incarceration of Native people. Native people are incarcerated in state and federal prisons at a rate of 763 per 100,000 people. This is double the national rate and more than four times higher than the state and federal prison incarceration rate of white people. In publishing this profile of Native incarceration, we are hoping to make the existing information more accessible, while also acknowledging the layers of systemic oppression impacting Native people in the criminal legal system.
Prison gerrymandering is a problem created by the Census Bureau’s policy of counting incarcerated people as residents of prison cells rather than their home communities. In a May blog post, we reviewed a new National Conference of State Legislatures report that outlines the experiences and recommendations from states that implemented anti-prison gerrymandering reforms in the 2020 redistricting cycle. The report makes clear that state officials agree that prison gerrymandering is important, worth fixing, and the Census Bureau should be responsible for ending it. With roughly half of U.S. residents now living in a state that has taken action to end prison gerrymandering, the emerging consensus on this issue is clear. But will the Bureau listen?
This is only a small piece of the important and impactful work we published in 2023 and our work is far from over. We’ve got big things planned in 2024, when we’ll continue to expose the broader harms of mass criminalization and highlight solutions that keep our communities safe without expanding prisons, jails, and the carceral system.
Recently published data from the Bureau of Justice Statistics show growing prison and jail populations, but this has little to do with crime. Instead, the trend reflects court systems’ slow return to “business as usual” and lawmakers’ resurrection of ineffective “tough on crime” strategies.
The Bureau of Justice Statistics (BJS) recently released its annual reports on prison and jail populations in 2022, noting that the combined state and federal prison populations had increased for the first time in almost a decade and that jail populations had reached 90% of their pre-pandemic level. But what’s behind these trends? Do they just reflect another year of post-pandemic “rebound” or longer-term changes in crime or punishment? And what do these trends suggest about the road ahead for those working to end mass incarceration?
To answer these questions, we looked closely at the annual BJS data as well as 2022 crime and victimization data and criminal court case processing to get a better idea of the reasons behind the new numbers. We also looked at some more recent 2023 jail and prison data to see whether the 2022 uptick appears to have continued in 2023 (spoiler: it does). Finally, we looked at reports from over 20 states to see how states themselves understand these trends, and where they foresee their correctional populations heading in the future.
Ultimately, we conclude that these populations are increasing and can be expected to continue to climb in the next few years, not because of changes in crime but because (a) courts have largely recovered from the slowdowns caused by the pandemic and (b) many states have rolled back sensible criminal legal system reforms — or worse, have enacted legislation that will keep more people behind bars longer, despite decadesofevidence that such policies don’t enhance public safety.
Upward trends in prison and jail populations in 2022
Prisons
The new BJS data show that the total national prison population grew by over 2%, with 42 states and the federal Bureau of Prisons (BOP) incarcerating more people at the end of 2022 than 2021. In 14 states, the prison population grew by 5% or more,1 with just 9 states (mostly in the South) and the BOP accounting for 91% of all prison growth nationwide.2 The number of imprisoned women grew proportionally more than the number of imprisoned men (up 5% compared to 2%). At the end of 2022, 16 states held 90% or more of their pre-pandemic (2019) prison populations.
Just like the prison population changes we saw during the early and mid-pandemic (2020 and 2021), these increases were driven by changes in admissions more than anything else: 11% more people — about 48,000 more — were sent to prison in 2022 than in 2021. One narrow silver lining from this update: The number of people released from prisons increased for the first time since 2015; unfortunately, this was only a tiny increase of 1% compared to 2021. (As we recently reported, parole boards have been approving fewer people on discretionary parole in recent years, and compassionate release systems are woefully under-utilized.)
Local jails
Local jail populations grew at an even faster pace than prisons in 2022; jails held 4% more people at the end of June 2022 than at the end of June 2021.3 The women’s jail incarceration rate grew 9% compared to 3% for men, and Black, American Indian or Alaska Native, and Native Hawaiian or Pacific Islander4 rates all rose proportionally more than white and Hispanic jail rates.
As with prisons, jail growth was driven by a nearly 7% increase in admissions over last year. The pretrial population was almost back to its full pre-pandemic size (at 97%); more than 70% of people in jail had not been convicted of a crime. Another contributing factor to jail growth: the use of jail detention as a response to probation violations, up 5% compared to 2021. During the pandemic, many jurisdictions reduced their use of jails for punishing these typically low-level, noncriminal violations, but it appears that costly practice is “back to normal.”
A preliminary look at 2023 and beyond: Prison and jail populations continue to grow
In an effort to see whether the growth trend in jail and prison populations has continued since the BJS collected data in 2022, we looked for more recent data. While the data we found are neither complete nor perfectly comparable to those published by the BJS,5 we were able to look at year-to-date 2023 jail data from the Jail Data Initiative and at 2023 prison population data published by 42 states and the federal Bureau of Prisons (BOP). (For the 2023 prison data we found, see the Appendix table.)
What we found was troubling but not surprising:
The jail data, collected from 942 jails across the U.S., show another modest (0.7%) increase in the average daily population in 2023 compared to 2022.6
In two-thirds (28) of the 43 prison systems for which we found more recent prison data, it appears that even more people were incarcerated in 2023, with at least six states again showing increases of 5% or more over their 2022 populations.7
At least two of the eight states where prison populations shrank in 2022 showed increases in 2023 prison populations; in Massachusetts and Arizona, the growth in 2023 erased the population drops in 2022.
Many state prison systems with available 2023 data have already returned to — if not surpassed — their 2019 pre-pandemic sizes.
Explaining recent prison and jail growth
It wasn’t crime
There’s been a lot of ink spilled about relatively modest changes in crime trends over the past few years, but nationally, total crime has remained near historic lows. While the specific factors that influence changes in prison and jail populations vary from place to place and from year to year, we conclude that “rising crime” is among the worst explanations for the growth of incarcerated populations over the past couple of years.
In considering this possibility, we looked at national crime victimization data as well as officially reported crime data.8 We see that the rate at which people reported any personal victimization in 2022 (23.5 per 1,000 people aged 12 or older) was almost exactly what it was five years ago, before the pandemic. Similarly, when we look at crime statistics reported by the FBI over a timeframe longer than one or two years, the rate of violent crime has held remarkably steady (and actually declined). In general, the fluctuations that have made headlines are within the range of what we have observed for the past 15 years or so. We see a similar story with property crime (with the exception of auto theft), which has also remained near its historic low, and is trending more steeply downward overall:
We looked at two indicators of crime — self-reported victimization and officially-reported crime — and observed the same patterns in both.
Because we are attempting to uncover trends beyond 2022 in this briefing, we also considered preliminary 2023 crime data released by the FBI in advance of its official annual estimates. For this, we turned to crime analyst Jeff Asher’s recent analysis of the available data. Asher concludes:
“Murder plummeted in the United States in 2023, likely at one of the fastest rates of decline ever recorded. What’s more, every type of [FBI] Uniform Crime Report Part I crime with the exception of auto theft is likely down a considerable amount this year…. The quarterly data in particular suggests 2023 featured one of the lowest rates of violent crime in the United States in more than 50 years.”
We won’t know how accurate Asher’s analysis is for almost another year, when the FBI releases the 2023 year-end data, but we agree that all signs point to crime continuing to trend downward. Of course, incarceration trends do not track directly with crime trends, anyway; they have more to do with how law enforcement, prosecutors, and judges choose to police and punish certain people, places, and behaviors — and how efficiently they can do so.
Changes in court processes
The 2022 increase in incarceration is actually exactly what we have been anticipating since the dramatic drops we observed early in the pandemic. When populations shrank in 2020 and 2021, we noted that court data showed what happened when courts suspended jury trials and other operations to slow the spread of COVID-19: The number of incoming (new) cases dropped, dispositions (decisions) dropped, and overall case clearance rates (the ratio of new to disposed cases) dropped, creating massive backlogs in the court system. This was a major reason that prison admissions fell so dramatically in the early pandemic.
To see if these data could explain the increase in admissions in 2022, we revisited the same data source, and found that all of those measures have more or less recovered from the slowdowns. Many court systems are still not fully caught up, but by 2022, they had resolved much of the backlog, which in turn caused the shift of many people from pretrial status to disposition, sentencing, and ultimately, admission to jail or prison.
In 2020, many courts shut down jury trials and other in-person operations, creating a backlog of cases that are still being cleared in many states. As more cases work their way through the courts, more people are sentenced to incarceration, resulting in more prison admissions.
Indeed, when we looked through individual states’ own interpretations of their 2022 population changes, most cited slowdowns and backlogs in the court system:
Virginia: “From mid-March to mid-May 2020, an emergency order issued by the Chief Justice of the Supreme Court of Virginia suspended all non-essential and nonemergency proceedings in the state’s courts. During that time, significantly fewer sentencing hearings were held, resulting in fewer offenders being sentenced to a prison term. Reports suggest that court caseloads have not returned to pre-COVID levels.” (October 2022)
Wisconsin: “Populations have grown significantly in the past several months as courts are working to address the backlog of cases incurred during the pandemic.” (June 2023)
Michigan: “…[I]t is projected the prison population will continue rebounding through 2024 due to processing of the court backlog.” (November 2023)
Rhode Island: “[The Rhode Island Judiciary spokesperson] noted that ‘over the last year the courts were still hearing cases that were delayed or carried over due to COVID-19 procedures and protocols….’” (December 2023)
Minnesota: “Now, as courts catch up, the prisons are filling to levels not seen in about four years.” (March 2023)
State prison systems and the BOP predict future growth
We also found documents showing that at least 22 states and the federal Bureau of Prisons (BOP) have calculated projections for their prison populations, and they almost uniformly predict further growth. Nineteen states and the BOP expect to incarcerate more people in the years ahead. Only California, Hawaii, and New Mexico expect to incarcerate fewer people in the foreseeable future — and even then, New Mexico anticipates a slight increase in its incarcerated women’s population. (For a list of reports with projections, see the Projections Appendix table.)
This example of a prison system’s population projections, from Colorado, shows that correctional authorities expect the male prison population to return to its pre-pandemic (2019) size by 2026; the report also shows the total population is expected to return to its pre-pandemic size by 2027.
The explanations offered by the states that predict further prison growth share a common theme: in addition to courts catching up with any lingering backlogs, they point to recent changes in legislation that will lead to longer sentences. New laws enacted in the past couple of years have increased penalties for some offenses, created new felony offenses, and made it harder to shorten excessively long sentences.
A Wisconsin report puts this plainly: “one additional potential factor that may influence the population projection… is 2021 enacted legislation, which increased penalties and created additional crimes.” The Oregon Office of Economic Analysis was more specific, pointing to a law passed in 2019 that made it easier to convict defendants of unlawful use of a vehicle, which had resulted in an additional 92 people in the annual prison population so far. While we couldn’t find projections for Tennessee, advocates offered similar explanations for the state’s current prison growth: the “Truth in Sentencing” bill enacted in 2022 put the possibility of parole or early release out of reach for many people, even though the Sentencing Commission determined sentence lengths “with the understanding that people would be paroled.” As a result, people are now serving sentences much longer than intended in the original sentencing laws.
Of course, projections are often wrong, but these reports give us some insight into how state correctional and budgetary agencies are contending with the specter of “tough on crime” politics and policy changes. Having seen the results in the 1980s and 90s, these projections may not be far off.
Returning to ‘business as usual’
The increase in incarceration in 2022 was the predictable outcome of (a) the criminal legal system return to “business as usual” and (b) the return of 1980s- and 90s-style “tough on crime” legislation. It was not caused by a crime wave. We can expect further growth in prison and jail populations unless states and localities redouble their efforts to safely reduce incarceration through criminal legal system reforms such as abolishing cash bail, eliminating incarceration for lower-level crimes (including non-criminal violations of probation and parole), shortening sentence lengths and making those changes retroactive, and expanding access to earned early release and discretionary parole. State and local governments must also make greater investments in strategies that we know protect people from criminal legal system contact: reinvesting in communities impacted by crime, with a focus on jobs, housing, education, and access to community-based mental health and substance use treatment.
The states where prison populations grew by 5% or more in 2022 include: Mississippi (14%), Montana (9%), Colorado (8%), Tennessee (8%), Minnesota (8%), North Dakota (8%), Rhode Island (the “unified” prison and jail population grew by 7%), Kentucky (6%), Connecticut (the “unified” population grew by 6%), Maine (6%), Vermont (the “unified” population grew by 6%), Alabama (5.5%), Florida (5%), and Louisiana (5%). Texas’ prison system grew by 4% but this represented the largest number of additional incarcerated people (almost 5,900) in any one state in 2022. ↩
The federal Bureau of Prisons accounted for 8% of all prison growth in 2022. Nine states accounted for 83% of all growth: Texas (accounting for 23% of the total increase), Florida (17%), Mississippi (10%), Tennessee (7%), Georgia (6%), Alabama (6%), Colorado (5%), Louisiana (5%), and Kentucky (5%). ↩
The Bureau of Justice Statistics’ annual prison and jail data collections use different reference dates. The prison data typically reflect counts at year-end, or December 31, while the jail data use counts collected at mid-year, on the last weekday in June (typically June 30). Therefore the 2022 prison data cover the 2022 calendar year, while the jail data cover the 12-month period from July 1, 2021 to June 30, 2022. ↩
Concerningly, the Native Hawaiian/Pacific Islander jail incarceration rate increased by 51% in just one year, and surpassed the white rate for the first time since at least 2010 (we couldn’t locate rates for earlier years). ↩
We were only able to locate 2023 data from 42 states and the federal BOP, and the reference dates for these data vary quite a bit. Additionally, none are “year-end” data that would be comparable to what the BJS collects. The exact populations included in these counts may also vary from the “jurisdictional” population counts that we compared them to, published by the BJS. ↩
We examined daily jail populations collected by the Jail Data Initiative, which uses web-scraping to collect and aggregate daily jail information from online jail rosters. We compared year-to-date 2023 data with data for the same period in 2022 (covering the period of January 1 to November 30 for each year), from the same sample of 942 jails that had available data for those dates. As a point of comparison, the BJS jail data and estimates are based on a sample of about 900 jails as well. We were not able to create estimates of the total national jail population that would be comparable to the Bureau of Justice Statistics’ estimates, due to the limited data provided in jail rosters, but instead compared the raw numbers from this sample for each year to get an idea of the relative (percent) change. ↩
As of November 2023, the prison populations of Mississippi and South Dakota had grown about 8% since 2022; as of October, Tennessee’s prison population had grown 5%; and as of December, the prison populations of North Carolina, Wisconsin, and New York had also grown by 5%. ↩
We used both indicators of crime — self-reported victimization data and the more frequently-referenced FBI measures of reported crime — for two main reasons. First, the FBI’s data collection method has changed in recent years, and as a result fewer law enforcement agencies have submitted data (83% in 2022 compared to 95% or more before the change to the new system). That has made the annual FBI crime estimates less reliable in the last few years. Secondly, many crimes go unreported to police. Using data from a nationally representative survey that asks people about their experiences of crime victimization in the past year helps to fill that under-reporting gap. This is not a perfect substitute, since it necessarily excludes homicides and doesn’t capture crime that targets businesses or public property, for example. But for the types of crime that capture headlines (i.e., interpersonal violence, theft, burglary, etc.), the victimization data offer a much more reliable picture of people’s experiences. ↩
Among the 27 states we surveyed, only 7 saw an increase in parole approval rate, and almost every state held substantially fewer hearings than in years past.
Note: On October 18, 2023, we made two edits to this piece : (1) Added data from Massachusetts that was released shortly after our analysis was published, (2) Fixed minor transcription errors to the appendix table.
Earlier this year, Alabama’s Board of Pardons and Paroles made headlines when it denied parole to someone who had died ten days prior to their parole hearing. This is just one of many threads in the Alabama parole board’s tapestry of dysfunction. For months, their three-person parole board operated with just two members despite requiring a majority vote to grant parole. It is no wonder that Alabama is on track to have a parole grant rate — the percent of parole petitions approved — of just 7% for 2023. This also comes as studies show racial disparities in parole grant rates are widening: for example, non-white people in New York were released at a rate almost 29% less than their white counterparts in 2022 (up from a difference of around 19% between 2016 and 2021).
With parole board practices so much in the news, we thought it was important to look around the country and evaluate the direction in which state parole boards are moving. We filed dozens of records requests and curated the best research to explore whether state parole boards are helping reduce mass incarceration or whether they are disregarding the hard-learned lessons of the pandemic, when they released even fewer people than before the crisis as people died behind prison walls.
The state of parole
In the 29 states1 for which we collected 2022 parole approval data, only 8 had grant rates above 50% – Connecticut, Idaho, Massachusetts, Nevada, North Dakota, Utah, Vermont, and Wyoming. Wyoming had the highest grant rate of 78%. At the other end of justice’s sliding scale, Alabama (10%) and South Carolina (13%) have the lowest parole approval grant rates in the nation. And while we don’t yet have data from most states for 2023, South Carolina’s recently updated parole data show that the state’s parole approval rate has dropped to an astonishingly low 7% in 2023.
To see full information about parole grant rates by year in each state from 2019-2022, see the appendix.
With few exceptions, parole grant rates dropped significantly from 2019 to 2022
In the 27 states for which Prison Policy Initiative was able to track changes in parole approval rates from 2019-2022, only 6 — Connecticut (+29%), Georgia (+17%), Texas (+11%), Hawai’i (+8%), Massachusetts (+8%), South Dakota (+6%), and Nevada (+1%) — have seen any increase since 2019. In the remaining 20 states from which we received data, parole grant rates have seen either no change or have seen a marked decline, with South Carolina (-63%) and Alabama (-67%) seeing the biggest drop offs in grant rates.
But state parole boards did not only choose to release fewer people. They heard fewer cases as well. With the exceptions of Oklahoma, South Dakota, and Arkansas, parole boards continued to hear significantly fewer total cases in 2022 than they did in 2019. The result is that since 2019, the number of people released through discretionary parole has decreased across the board.
To see full information about the number of parole hearings by year in each state from 2019-2022, see the appendix.
Ironically, South Carolina’s Department of Probation, Parole, and Pardon Services’ website is quick to highlight the money the state has saved by reducing the number of parole revocations over the past decade. Of course, it would be difficult to have more revocations, given that they released 69% fewer people via discretionary parole in 2022 than they did in 2019. South Carolina is far from alone, however. Alaska has reduced the number of people released through discretionary parole by 79% since 2019; Alabama 70% and Maryland by 66%. In fact, with the exception of South Dakota, every state for which data was providedreleased fewer people through discretionary parole in 2022 than in 2019, with an average overall decline of around 41% fewer people released per state. South Dakota’s increase is also extremely modest – the state released just 62 more people in 2022 than in 2019.
To see full information about the number of people released on parole by year in each state from 2019-2022, see the appendix.
Why are parole boards releasing so few people?
Denial is often effectively the default disposition for parole boards, and the burden of proof is usually on the person who is incarcerated to justify their release. This is problematic, as the board often considers factors that are beyond the applicant’s control, such as the availability of programming or education in the prison, or factors that cannot be changed, such as the nature of the offense for which they were incarcerated. When release rests on these factors, there is very little a person can do to influence the outcome.
Another issue is the general outlook some politicians and parole board members have toward people who are up for parole. State Representative Matt Simpson defended Alabama’s abysmal grant rates, saying “We’ve gotten to a point where the people up for parole are the ones that don’t need to be out; it’s not like it used to be where we had a number of non-violent offenders.” While recent reports have cast doubt on this claim, it still begs the question: how can those with this viewpoint provide a fair hearing to those who come before them? There is nothing fair about a body that decides people’s fates before they ever appear. It’s important to note that the seriousness of an offense is taken into account when a judge first sets a prison sentence. When parole boards solely or exclusively make their release decisions based on the underlying charge, they are continually punishing incarcerated people for a factor they cannot change. Moreover, policies that provide relief only for those with non-violent offenses are simply not impactful enough to address the juggernaut of mass incarceration. And although parole boards are charged with looking at a person’s likelihood of rearrest, they often seem to ignore the fact that people sent to prison for violent charges have the lowest rearrest rate of any group.
Parole Boards are influenced by politics
In 2019, Mississippi had a grant rate of 74% — one of the highest rates in the nation. However, that same year, the parole board made the ethical but unpopular decision to parole a person who had been incarcerated for 30 years. That person had their death sentence commuted on the basis of intellectual disability but the board determined them not to be a threat to public safety. In the aftermath of this decision, Mississippi saw its grant rates freefall 42 percent by 2022. The political outrage at the decision led to increased scrutiny and political pressure which has undermined Mississippi’s presumptive parole system.2
Though parole boards are typically thought of as serving a judicial function (i.e., weighing evidence and rendering a judgment that results in freedom or continued incarceration), they are still bureaucratic bodies beholden to political good will. Parole board members are usually appointed by governors and confirmed by legislative hearings, which often makes their selection fundamentally political. More than a third of states with parole boards in the US mandate no qualifications to sit on the board, meaning no actual knowledge of law, prison, the judicial system, mental health, or even basic social dynamics are required to sit on boards that can prevent a person from ever again experiencing life outside prison walls.
Policy efforts to increase release rates are often stalled or undermined
Efforts to restore discretionary parole in Maine, Virginia, and Illinois led by groups like Parole4ME and Parole Illinois have come achingly close to success in recent years. Some states with discretionary parole have begun to implement presumptive parole in an effort to increase fairness and remove subjectivity and political pressure. While presumptive parole is a key strategy to reduce incarceration, in states that have implemented it, the efficacy of this policy is limited by carveouts — exceptions in policies that exclude certain categories of people from relief. Most states with some form of presumptive parole will not apply the presumption to people with certain offenses, those who have received recent disciplinary infractions, or those who haven’t completed relevant rehabilitative programming. As we noted, offense-based carveouts do not have a strong basis in policy, and programming-related carveouts are problematic because programming is neither universal nor guaranteed and can vary immensely from prison to prison.3Reports have also shown that Black and Brown people who are incarcerated are more likely to receive disciplinary infractions than their white counterparts, meaning they are more likely to be denied presumptive parole based on this carveout.
Conclusion
Despite the dangers of incarceration in a post-pandemic world and the efforts of many to make the parole system more just, fewer people are receiving parole hearings, and fewer still are released through discretionary parole. In fact, discretionary parole accounted for only a small fraction of total releases from prison in 2021.
Expanding access to discretionary parole won’t by itself end mass incarceration; however, expanding its usage in conjunction with presumptive parole while eliminating undermining carveouts could be a powerful tool for decarceration. Hopefully, a review of parole in 2023 will see incarcerated people given a greater chance to be paroled.
Footnotes
While we sought to collect data from all 34 states with discretionary parole as a primary mechanism of release, not all states make parole board data publicly available and several were not forthcoming with data via records requests. Arkansas has a residency requirement for records requests that prevented submission; Missouri denied having records responsive to our request, which strains credulity; New Hampshire cited the records as exempt. We are awaiting data for Nebraska, and West Virginia. Kentucky and Idaho provided some information, but were unable to provide statistics for 2019. In the appendix to this briefing, we provide details about each state’s response to our open records requests. ↩
Presumptive parole is a form of non-discretionary parole in which people are automatically released if they meet certain established criteria. ↩
New Census Bureau data show the U.S. population is getting older — and at the same time, our prison populations are aging even faster. In this briefing, we examine the inhumane, costly, and counterproductive practice of locking up older adults.
New data from the Census Bureau reveals that the U.S. median age rose to a high of 38.9 years: an increase of three and half years in the last 23 years. The U.S. prison population is aging, too, and at a much faster rate than the nation as a whole — and older adults represent a growing portion of people who are arrested and incarcerated each year. The aging of the prison population is the result of a series of disastrous policy decisions in policing, sentencing, and reentry over roughly the last half-century. And while prisons and jails are unhealthy for people of all ages, older adults’ interactions with these systems are particularly dangerous, if not outright deadly.
Aging throughout the criminal legal system
Older adults1 are increasingly ensnared in all parts of the criminal legal process: in arrests, pretrial detention, and imprisonment. In 2000, 3% of all adult arrests involved people aged 55 or older, and by 2021, this older population accounted for 8% of all adult arrests.2 According to the most recent available data on local jails across the U.S., from 2020 to 2021 — during the COVID-19 pandemic, which was particularly dangerous for older adults — the segment of the jail population aged 55 and older expanded by a greater proportion than any other age group, growing 24% compared to an average increase of 15% across all other age groups.3
Meanwhile, older people make up five times as much of the prison population as they did three decades ago. From 1991 to 2021, the percentage of the state and federal prison population nationwide aged 55 or older swelled from 3% to a whopping 15%.4 This growth is seen even more acutely when looking at people serving life sentences: by 2020, 30% of people serving life sentences were at least 55 years old, with more than 61,400 older adults sentenced to die in prison.
The dangers of aging in prison
Prisons are unhealthy places for anyone of any age, but keeping older adults locked up is particularly dangerous. A robust body of research shows that incarceration itself accelerates aging: people face more chronic and life-threatening illnesses earlier than we would expect outside of prison, and physiological signs of aging occur in people younger than expected. In addition, a conservative estimate of more than 44,000 people 45 and older experience solitary confinement in state prisons each year, in conditions that shorten lives and can be detrimental to physical, mental, and emotional health. Years of limited resources, inaccessibility, and understaffing in prison healthcare have created a situation in which each year spent in prison takes two years off of an individual’s life expectancy. The same scarcity of prison healthcare resources that jeopardizes older people’s health is not just ineffective-it’s also exorbitantly expensive.
The high costs of incarcerating older people
State and federal governments spend increasingly more money on consistently inadequate healthcare for their growing populations of older adults. While most studies on the steep costs of incarcerating older people date back at least a decade, their findings are consistently dramatic. For example, in California prisons in the 1990s, the state spent three times as much money to incarcerate an older person than someone of any other age group. Considering the proportion of California’s prison population over the age of 50 has risen from about 4% in 1994 to 25% in 2019, and that prison healthcare spending per-person has ballooned in the intervening years, the cost of incarcerating older adults only appears to be growing. In 2013, the federal Bureau of Prisons (BOP) spent 19% of its total budget — or $881 million — to incarcerate older adults. That same year, the BOP reported this group was the “fastest growing segment of its inmate population” with a 25% increase over the course of a single year (as the rest of the population decreased by 1%).
As long as people are in prison, they should receive the care they need to be safe and healthy. But especially at the state and local level, every dollar spent in prisons is a dollar that could have expanded and improved community health services — and provided superior care. It doesn’t make much sense to spend so much money locking people up in places that are not only dangerous to their health, but more costly to care for them — especially when there is little public safety argument to justify doing so.
Low risk of re-arrest and re-incarceration for older adults
The older someone is, the less likely they are to be arrested following release from prison, according to the most recent government study of recidivism. In fact, people released at age 65 or older are the least likely of any age group to be re-arrested in the five years following release:
Policing disproportionately targets populations that often include many older adults: unhoused people, people who use drugs or alcohol, and people with cognitive disabilities. Nationally, the unhoused population is growing older. From 2007 to 2014, the number of unhoused people over age 50 expanded by 20%, and in 2014, this age group accounted for more than 30% of people experiencing homelessness. Given that unhoused people are up to 11 times more likely to be arrested than housed people, the likelihood of arrest for older, unhoused people is undoubtedly growing over time. Drug-related arrests among people aged 50 and older nearly doubled from 2000 to 2018, indicating a dramatic increase in criminal legal system involvement.
The criminalization of mental illness among older adults is significant as well. One in nine people aged 65 and older have Alzheimer’s dementia (one of many kinds of dementia). The most recent national data available indicates that people with cognitive disabilities are overrepresented in jails and prisons: 31% of people in jails in 2012 and 24% of people in state prisons in 2016 reported a cognitive disability. As greater numbers of older adults with cognitive disabilities encounter police,5 older prison populations are likely to grow.
Sentencing
State and federal sentencing policies from the 1970s to the 2000s resulted in what researchers have called “a prescription for an increase in older inmates: more prisoners, more prison beds, more lifers, and less parole.” State and federal laws enacted in this time period resulted in more incarcerated people serving longer sentences via policies that:
Reduced the allowed time earned for good conduct,10 and
Instituted other “tough on crime” sentencing laws.11
Longer and harsher sentences top the list of the most obvious mechanisms by which the national prison population exploded in the 1990s and 2000s, but they also created the problem of today’s aging prison population: many of the people who received these sentences are still behind bars now that they are twenty or thirty years older.
Tools to reduce the aging prison population remain underutilized
While attention to this crisis has grown in recent years, many of the available tools — such as parole and compassionate release — have been underutilized. The failure to release older adults from prison has deadly repercussions: from 2001 to 2018, over 30,500 people aged 55 or older died in prison and almost all of these deaths (97%) were due to illnesses.12
Parole
In a study of parole in Maryland, the Justice Policy Institute found that between 2017 and 2021, parole grant rates are highest for people between the ages of 31 and 35 (43%) with rates declining as age increases: people over 60 are paroled at a rate of 28%. Older adults serving long sentences are often denied parole, with boards focusing on the nature of their original offense instead of their preparedness for reentry.13 That being said, parole is not even an option for large swaths of the prison population. Almost half of all people serving life without parole (LWOP) sentences are at least 50 years old, and one in four is at least 60 years old. Even some “geriatric” or “elder” parole laws, intended to facilitate the release of older incarcerated people, needlessly exclude many older people who would otherwise be eligible; for example, the Justice Policy Institute points out that the Maryland law only applies to older people with multiple convictions.
Compassionate release
Compassionate release (often called medical parole) is an important release mechanism for older adults, but is not used nearly often enough. The application process is cumbersome and opaque, and many people die before they ever receive a decision.14 In addition, decisions about medical eligibility for release are often filtered through state parole boards, whose membership often includes former corrections officials, former parole or probation officers, and formerprosecutors. These are not vocations particularly invested in release, much less promoting individual health and wellbeing outside of the carceral system. Parole boards’ lack of knowledge about serious and terminal illnesses, as well as the general aging process, can create significant barriers to release. Physician reluctance to offer a prognosis, parole board rejections of medical recommendations, offense carveouts,16 and barriers to discharge planning15 also factor into the underutilization of compassionate release. Some states (like Iowa) do not even have such a release program.
The result: Nursing homes behind bars
As a result of the disastrous failure to make use of existing release systems and increasing public pressure to address the aging prison population, prisons have adapted in very troubling ways. In Connecticut, Kentucky, Tennessee, and Wisconsin, departments of corrections have created “prison nursing homes” to keep people incarcerated even when they are far too sick or frail to represent any kind of public safety threat.17 The continued incarceration of people who would otherwise be receiving residential or long-term care reflects a troubling trend of prisons “gearing up to become nursing homes, but without the proper trained staff and adequate financial support.”
Re-entry barriers
Even when older adults are approved for release from prison, they often face a barrage of challenges in the community.
Many people released from prison — regardless of age — struggle to obtain adequate and affordable housing, employment, and healthcare. For older adults, these concerns can be magnified as any amount of time spent in prison disrupts healthcare services and increases the challenges of (re)connecting with them after release. Older adults also have fewer relationships with people on the outside, face discrimination in healthcare settings like nursing homes, and come up against legal and regulatory barriers to accessing benefits like Supplemental Security Income and Medicare.
The sheer number of complex and overlapping barriers placed before formerly incarcerated older people is staggering:
Barriers to admission for nursing homes and other necessary healthcare facilities are particularly awful for people who have a terminal illness and are released via compassionate release. In Connecticut, many nursing homes will not even consider admitting people released from prison, and in Florida, people who have been convicted of sex offenses and released from prison often live in motels because they are routinely turned away from nursing homes. Formerly incarcerated older adults facing chronic and terminal illnesses are often forced to rely on an “ad hoc network of care” for their medical needs.
Reducing the aging prison population
If we hope to address this crisis, more work needs to be done to curb arrests of older people, to divert them to better community support, and to reduce their numbers behind bars. The decriminalization of homelessness and substance use — as well as expanded diversion services for older adults — can reduce their risk of arrest and detention. States can also send fewer people back to prison by eliminating parole revocations for technical offenses that reincarcerate people for actions that, were the individual not on parole, would not be crimes at all.
To reduce the number of already-incarcerated older adults, state and federal governments can make use of presumptive parole, second-look sentencing, and the retroactive application of sentence reduction reforms, as well as the many other mechanisms to shorten excessive prison sentences outlined in our 2018 report, Eight Keys to Mercy: How to shorten excessive prison sentences. All states should have compassionate release or medical parole available to release older adults and those facing chronic and terminal illnesses. States can also reduce existing barriers to compassionate release by eliminating exclusions based on offense type, relaxing eligibility criteria, and simplifying the application, review, and approval process.18Elder parole policies that implement automatic parole consideration for older adults who have already served some portion of their sentence can further reduce the number of older people behind bars, simplifying the process of getting out of prison for some of the most medically vulnerable people.19
Finally, states and the federal government need to expand the social safety net to support older adults released from prison. There are numerous interventions to support reentry by reducing housing and employment barriers, encouraging access to healthcare and health insurance (including Medicare and Medicaid), and simplifying application and re-enrollment for Social Security benefits, as well as many more crucial supports outlined in this 2022 issue brief from Justice in Aging.
Conclusion
The crisis of our aging prison population is not an accident but the result of policy choices that hurt incarcerated people, their loved ones, families, and communities. Fortunately, we can address these policy missteps.
In order to provide older incarcerated people with adequate healthcare, end of life care, and dignity, we need to find ways to reduce their numbers in all parts of the carceral system. Existing tools — like compassionate release and parole — can help but are not enough to address this problem on their own. States should follow the lead of advocates who are fighting to reduce police encounters, end draconian sentencing like life without parole, and expand release mechanisms like elder parole. Reducing barriers to enrollment in Medicare, Medicaid, Social Security, and ensuring people have safe places to live in our communities can expand the safety net for older adults leaving prisons. Ultimately, the benefits of such changes will not be recognized only by older adults in the system but the broader population as well.
Appendix: State prison populations aged 55 and older, 1999‑2019
Throughout this report, “older adults” refers to people aged 55 or older. ↩
Arrests in the United States by age and sex, 2000-2021 from the Federal Bureau of Investigation’s Uniform Crime Reporting Program, Crime Data Explorer. ↩
At midyear 2020, there were 40,500 people aged 55 or older confined in local jails and by midyear 2021, there were 50,100 people 55 or older in local jails, representing an increase of 24%. Focusing on the oldest age group for which data is collected, the number of people 65 or older expanded from 7,400 to 9,400 (a 27% increase) from 2020 to 2021. See Table 2 in the Bureau of Justice Statistics’ Jail Inmates in 2021 — Statistical Tables for demographic data about people confined in local jails (age data only available in 2020 and 2021). ↩
An estimated 3.4% of sentenced people in state and federal prison in 1991 were 55 or older. This estimate is calculated based on the data reported in Table 1 of the Bureau of Justice Statistics’ Comparing Federal and State Prison Inmates, 1991: 6.8% of the 54,006 people in federal prison and 3.1% of the 704,203 people in state prison were 55 or older. As a percentage of the combined federal and state prison populations, 3.4% of people in state and federal prisons were 55 or older. An estimated 15.3% of the sentenced state and federal prison population in 2021 were 55 or older, based on Table 10 of the Bureau of Justice Statistics’ Prisoners in 2021 — Statistical Tables. ↩
Police encounters are often deadly for disabled people but often go unseen in media reports. A 2016 study notes that while disabled individuals make up a third to a half of all people killed by police, their disability often goes unmentioned in news reports. ↩
By 1995, eleven states had adopted truth-in-sentencing laws. By 1998, 27 states and DC met the eligibility criteria for the Federal Truth-in-Sentencing Incentive Grant Program. ↩
The federal 1994 crime bill and numerous statelaws were passed in the 1980s, 1990s, and early 2000s as part of a “tough-on-crime” campaign to lock people up for longer than ever before. ↩
The types of illness vary from terminal illness (such as cancer) to illnesses that are often preventable or treatable for some time outside of prison (such as “AIDS-related illnesses,” respiratory disease, liver disease, heart disease, and influenza). ↩
In some states, the reasons for parole denial can be based on the original offense, no matter how long ago an individual was convicted and regardless of the fact that the seriousness of the crime was inevitably taken into account at sentencing, and that discretionary parole is fundamentally about release based on personal transformation. ↩
According to The New York Times, between 2013 and 2017, the federal Bureau of Prisons (BOP) approved only 6% of the 5,400 compassionate release applications received; meanwhile, 266 other applicants died in prison. The Times’ analysis of federal prison data shows that it takes over six months, on average, for an incarcerated person to receive an answer from the BOP. In one tragic example, prison officials denied an application for someone because the BOP put aside prison doctors’ prognosis of less than six months and concluded that he had more than 18 months to live. Two days after receiving the denial, he died. ↩
A 2021 bill in Colorado streamlined the medical release process, but 23 incarcerated people who were approved for parole remained in prison because the state Department of Corrections “could not find a nursing home willing to admit them.” Similarly, in Florida, many older adults with sex offense convictions are denied by nursing homes. ↩
For example, a 2015 study found many states automatically exclude people convicted of murder (at least 7 states) or “sexually oriented crimes” (at least 11 states). Some states even exclude people based on prior offenses, regardless of the offense they are currently serving time for. Other states only allow compassionate release and medical parole for people who have parole-eligible offenses or for people who have already served a certain portion of their sentence. ↩
The ad hoc development of “prison nursing homes” is a waste of resources that would be better spent on medical, social, and emotional support outside of the carceral system for aging adults. In Pennsylvania, the state reportedly spends more than $3 million each year just to “medicate” the older adult population housed in their three long-term care prison units. ↩
For additional recommendations regarding compassionate release, see FAMM’s ongoing work to expand compassionate release across the country. ↩
Building on data from the Prison Journalism Project, we find that most states enforce restrictions that make practicing journalism extremely difficult and sometimes risky.
Last month, New York prison officials introduced a policy to effectively suppress prison journalism. It went unnoticed for a few weeks until reporters at New York Focus caught wind of it. A righteous backlash ensued, forcing the department to rescind the policy for the time being.
The incident left many people wondering: how common are restrictions on prison journalism? Building on data compiled by the Prison Journalism Project, we scoured handbooks, prison policies, and laws governing every corrections department in the U.S. to try and find out.
We found that while explicit bans on prison journalism are rare, a web of complex and vague policies make the practice extremely difficult and sometimes risky.
Prisons don’t want you to know what happens inside. That’s what makes prison journalism so important. As more news outlets publish incarcerated journalists, more departments will consider policies to control what information makes it out into the world.
The Federal Bureau of Prisons is the only agency we found that explicitly forbids any incarcerated person from acting “as a reporter.” But they are not alone in suppressing prison journalism.
For starters, the standard prison practice of censoring and surveilling snail mail, electronic messages, phone calls, and video visits violates basic principles of free expression and privacy. These principles are central to a journalist’s ability to maintain sources, work closely with editors, and report the news without interference. Only 4 states — Arkansas, Georgia, Michigan, and Texas — treat correspondence with the news media as “privileged communication,” meaning that letters between an incarcerated person and a media outlet cannot be opened or read by prison staff (although they may be searched in the presence of the incarcerated person for contraband).
However, the other 46 states and the federal government maintain the right to read and censor communications with the media. These policies are broadly explained as important to maintaining “security and order” — a vague justification left to the discretion of prison officials.
Other aspects of prison life, such as an incarcerated person’s limited ability to maintain property1, can also conflict with the practice of journalism. Papers, notes, books, and other materials that can be important to reporting are vulnerable to confiscation and destruction by prison officials during cell searches and transfers. Additionally, a lack of access to the internet and heavily restricted use of tablets and computers can make researching, writing, and editing much more difficult for journalists on the inside.
Prohibitions on business and compensation
Fourteen states prohibit imprisoned people from operating or engaging in a business, including being self employed, and from receiving compensation for their work. Even if an incarcerated person were to produce journalism for free, vague restrictions on ‘business activities’ are enough to threaten their work with media outlets.
Prison journalism, free speech, and privacy rights
The Supreme Court’s view on the rights of prison journalists
Unfortunately, the speech and property rights of prison journalists are an open question.
The Supreme Court has largely blessed prison censorship in a pair of decisions known as Turner and Martinez. Turner applies to incoming communications, permitting prisons to censor mail from the outside so long as it is “reasonably related to legitimate penological interests.” Under the ruling in Martinez, outgoing mail can be censored if doing so “furthers an important or substantial government interest,” although it must be “no greater than is essential to the furtherance of that interest.” In both cases, that “interest” is determined through vague legal tests that, over time, have come to heavily favor prison administrators.2
When it comes to property, the Supreme Court has pretty clearly ruled that incarcerated people do not have a right to privacy. Prison officials are within their rights to destroy property so long as there is a “post deprivation remedy,” such as a procedure for incarcerated people to submit grievances.
It is perhaps most important to note that these protections can only really be enforced if they are brought to court. This is not a given. As we note in our report, “Slamming the Courthouse Door,” the Prison Litigation Reform Act makes it extremely difficult for lawsuits initiated by incarcerated people to ever reach court, and reduces their likelihood of success if they do. This arrangement deters people in prison from filing complaints in the first place. The law requires courts to dismiss civil rights cases from incarcerated people for minor technical reasons before even reaching the case merits, requires incarcerated people to pay filing fees that low-income people on the outside are exempt from, makes it hard to find representation by sharply capping attorney fees, creates high barriers to settlement, and weakens the ability of courts to order changes to prison and jail policies.
Whether an incarcerated person is the subject of, or a participant in, reporting, the risks they face can be serious: they can lose access to communications services and the commissary, they can be placed in solitary confinement, and they can lose good time credits that factor into their release.
Most incarcerated people are only allowed to work in jobs that support prison operations, prison-approved work release programs, or prison industries. But 19 states allow people to work with outside businesses and organizations if they receive approval from the prison. In some rare cases, they may receive compensation for written work3 or publish writing so long as it is not a regular column.4
Prison journalism is essential work
For as long as there have been prisons, the public has benefited greatly from the work of incarcerated journalists and sources. Much of what is known about incarceration comes from people who have been on the inside and have told their stories at great personal risk.
Incarcerated journalists still face discrimination and rejection from media outlets, but there are some signs of change. Over the last decade, a growing movement of incarcerated journalists — some working with organizations like the Prison Journalism Project and Empowerment Avenue, others with prison newspapers like the San Quentin News — have had their work published. This work is often used in countless investigations, lawsuits, policy reforms, and organizing efforts. This is great news for transparency, accountability, and change. Importantly, it also helps people build relationships and skill sets that can support them once they are released.
There are too many examples of excellent prison journalism to cite, but some examples include:
New York’s anti-journalism policy is gone for now, but may return in a different form in the future. In response to media requests, the department said it will “engage [interested] stakeholders to revise the policy in order to encourage creative art projects, as originally intended.”
In the meantime, it must be said that the benefits of prison journalism are profound and the risks are few, and mostly confined to the system itself. Other states are likely watching what has unfolded in New York, and so a rigorous defense of prison journalism is required. Protecting and expanding prison journalism requires special considerations for incarcerated media workers. It also merits a critical examination of ordinary policies that shape prison life.
Prison journalism affirms some of our most basic democratic principles — the exercise of speech free from government influence — and is an essential check on the extreme power these institutions wield over life and death. It’s also a potent reminder of the agency and desires of incarcerated people, which are so easily dismissed because they are often largely out of view.
Footnotes
Most prisons have policies limiting the number and type of items an incarcerated person is allowed to keep. For example, according to policies set by the Bureau of Prisons, “Authorized personal property may be subject to numerical limitations” and, if a person is transferred, their property may be moved with them “at the discretion of the sending and receiving institutions’ Wardens.” Pennsylvania prison policies dictate that “limitations on the amount and variety of inmate property may be imposed for security,
hygiene, and/or safety reasons.” In the event of a transfer, PADOC policy explains that “An inmate may not exceed the property limits established by the Department. Excess property, as determined by the Facility Manager/designee, may be shipped out at the inmate’s expense or destroyed.” ↩
According to research by Emily Chiang, in the Turner case, “Justices Stevens, Brennan, Marshall, and Blackmun dissented, arguing that “if the standard can be satisfied by nothing more than a ‘logical connection’ between the [policy] and any legitimate penological concern perceived by a cautious [administrator,] it is virtually meaningless.” They cautioned that “[a]pplication of the standard would seem to permit disregard for inmates’ constitutional rights whenever the imagination of the [administrator] produce[d] a plausible security concern.” ↩
In Oregon, incarcerated people have an explicit right to publish, copyright, and be compensated for written work. However, “equipment, supplies, and other resources that are the property of the State of Oregon cannot be utilized in the production of items offered for sale or other disposition by the inmate.” A separate mail policy states that incarcerated people “shall not conduct business transactions by mail without the prior written consent of the functional unit manager or designee.” ↩
In Illinois, “a committed person may submit a manuscript for publication but shall not enter into contractual agreements with publishers for a regularly published column.” ↩
The percent of people in prison with HIV barely budged despite the heightened risks of COVID-19 to immunocompromised individuals. We review the evidence connecting the parallel epidemics of HIV and incarceration, which disproportionately impact Black men in the South.
The rate of new HIV diagnoses in the U.S. has been steadily declining for decades, but people in prisons are still disproportionately living with the virus. New data from the Bureau of Justice Statistics (BJS) report HIV in Prisons, 2021 indicates that some state prison systems are completely out-of-step with the rest of the nation and have experienced an increase in HIV prevalence since 1991.1 Some of this increase reflects vast improvements made in health care that allow people with HIV to live longer than in the early years of the epidemic. More concerningly, some of the increase appears to be tied to the mass incarceration of Black people and the oft-ignored epidemic of HIV among Black men in the South.
In addition to national and regional trends in HIV prevalence in prisons, and the twin epidemics of HIV and mass incarceration, this briefing highlights BJS data on prison testing policies and research on the criminalization of the virus in the U.S.
Figure 1.
Nationally, HIV rates in prison greatly outpace the general population
Overall, the percent of the U.S. prison population that is living with HIV steadily declined from the 1990s to 2016. At its peak in 1992, 2.5% of people in all state and federal prisons were HIV-positive.2 By 2016, this had decreased to 1.2%.
New 2021 data from the Bureau of Justice Statistics shows that, while the overall number of imprisoned people with HIV has declined, the portion of the prison population living with the virus has not changed in the past five years. In fact, the recent 0.1% change in the percent of the overall prison population living with HIV is entirely attributable to a change in the percent of HIV-positive people in federal prisons, which decreased from 1% of the federal prison population in 2020 to 0.9% in 2021.
And while we see little change in the prevalence of HIV in prisons in recent years, the comparison to the general U.S. population is startling. The prevalence rate of HIV in the U.S. in 2019 was 380 per 100,000 people,3 while the total U.S. prison population faces a rate that is more than 3 times as high: 1,144 per 100,000 people in prison had HIV in 2021.
In some prisons, HIV prevalence rose as COVID-19 pandemic advanced
The Bureau of Justice Statistics reports that 2019 to 2020 represented the largest one-year decline in the number of people in prison with HIV (down 15%) since data collection began and explains that this was “largely as a result of the COVID-19 pandemic.” Readers might optimistically interpret this as evidence that prisons were rightly concerned about the heightened risk COVID-19 posed to immunocompromised people, such as those diagnosed with HIV. Unfortunately, when we take a closer look at the data, it’s hard to say whether that was the case.
Figure 2.
In fact, some states seemed either oblivious to – or, less generously, unbothered by – the additional risks that COVID-19 poses to people with HIV. In 12 states, the number of HIV-positive people in prison actually increased from 2019 to 2020, suggesting significant state-by-state variation during the pandemic. And as states ended COVID-19 emergency responses in 2021, these variations did not improve: From 2020 to 2021, 20 states and the federal Bureau of Prisons saw an increase in the number of imprisoned people with HIV. This suggests that any positive changes made in reducing the HIV-positive prison population during COVID-19 are set to return to pre-pandemic levels.
Nationally, the 15% decline in the number of HIV-positive people in prison amounts to just over 2,000 people. If every one of them were actually released from prison directly as a response to COVID-19, this would be worth noting as an accomplishment in mitigating the risk of deadly disease among immunocompromised people. However, this decrease was proportionally the same as the overall drop in the prison population that year, and the actual percent of the prison population living with HIV did not change in any significant way. Therefore, it seems unlikely that the drop in the HIV-positive prison population was the result of a targeted effort to protect the health of these individuals.
Black men are hit the hardest by HIV and incarceration
The Bureau of Justice Statistics has not provided data on the race of imprisoned people living with HIV since 2004.4 The last time it published this data nearly 20 years ago, BJS reported that, among the more than 15,400 people in state prisons that self-reported positive HIV test results, 53% were Black, 22% were white, and 19% were Hispanic or Latino. Until more recently, the Bureau’s HIV in Prisons series also included a breakdown of HIV-related deaths by race; in 2019, the mortality rate for HIV-related deaths among Black people in prison was three times the rate of HIV-related deaths of all people in prison (1 per 100,000).5
Figure 3.
Unfortunately, while there is little other data on the overlap between incarceration, race, and HIV, we do know that Black people are disproportionately affected by both mass incarceration and HIV. This is not a coincidence, as our 2017 briefing on the subject explains. Black people are vastly overrepresented in the U.S. prison population: in 2021, Black people were imprisoned at a rate of 1,186 per 100,000 adults, more than five times the rate of white adults and more than twice the overall adult imprisonment rate of the U.S.
The racial disparities observed in prison HIV prevalence rates are mirrored in prison mortality rates.7 From 2016 to 2019, there were 114 deaths of people with HIV in prison (of any cause), and 74 of these deaths (65%) were of incarcerated Black people (see Figure 3). In 2019, 12 of the 17 deaths of people with HIV in prison (71%) were of non-Hispanic Black men, specifically. These racial disparities persist outside of prisons as well: 43% of people with AIDS8 who died (of any cause) in 2019 were Black.9
Regional differences: HIV prevalence in the South
In 2017, we summarized the limited existing research on the ways in which Black men face the parallel epidemics of HIV and mass incarceration, with a focus on the effect in Southern states. The HIV prevalence rate in the South10 is 379 per 100,000 residents, which is more than twice the rate in the Midwest and well above the national rate of 318 per 100,000.11
This pattern appears to hold true in prisons as well: All seven states with the nation’s highest rates of HIV in prison are in the South: Florida, Mississippi, Louisiana, Maryland, Tennessee, Georgia, and South Carolina. In fact, all of the states with more than 2% of their prison population living with HIV are in the South: Florida (2.8%), Mississippi (2.5%), and Louisiana (2.5%). These Southern state prison systems also have some of the most significant racial disparities in the nation, supporting the correlation between HIV and the incarceration of Black people.
From 1991 to 2014, the New York state prison system was the prison system with the highest HIV prevalence rate in the country.12 But starting in the mid-2000s, while Northern state prisons were seeing major decreases in HIV prevalence, Southern state prison systems witnessed the opposite. States like New York, Connecticut, and Massachusetts saw sizable drops of 12, 4, and 4 percentage points respectively in the last 30 years, while Louisiana, Tennessee, and Mississippi have seen steadily rising HIV prevalence in prisons.
Figure 4.
2015 was the last year that New York had the prison system with the largest portion of the population living with HIV. Since then, Louisiana (2016-2020) and Florida (2021) have had the highest in-prison HIV prevalence rates in the country: in 2021, 2.8% of people in Florida prisons had HIV.
HIV testing: Vast differences in prison policies
While most prison systems in the U.S. provide mandatory or “opt-out” HIV testing during admission,13 there are a few concerning gaps in testing policies across the country. Ten of the 50 reporting prison systems14 only offer tests if they are requested (“opt-in”) or based on a clinical medical evaluation. Only 18 states offer HIV testing during routine medical care for all imprisoned people, while all other states and the federal Bureau of Prisons only offer tests by-request during clinical visits for people the prison system has identified as vulnerable to HIV, or when someone is involved in “an incident.”15
Only one state – Texas – mandates HIV testing prior to release. Nine other states (accounting for a total of 20% of all 2021 prison releases) offer optional HIV testing to all people during their discharge planning process. Among the ten states with the highest HIV prevalence in prisons, nine of them offer HIV testing upon release; Mississippi – with the third highest rate of HIV – does not offer testing at all prior to release.
The criminalization of HIV across the U.S.
According to the Centers for Disease Control (CDC), 35 states have laws that criminalize HIV exposure and four more states have sentence enhancement laws for HIV or sexually transmitted infections (STIs). The criminalization of HIV refers to the existence and enforcement of criminal laws that rely on HIV status as the “foundation for criminalizing otherwise legal conduct” or for increasing punishments related to solicitation and sex offenses. The CDC classifies these types of laws in three categories:
HIV-specific laws that criminalize or control actions that can potentially expose another person to HIV. (21 states)
Sexually transmitted infection (STI), communicable, contagious, infectious disease laws that criminalize or control actions that can potentially expose another person to STIs/communicable/infectious disease. This might include HIV. (14 states)
Sentence enhancement laws specific to HIV, or STIs, that do not criminalize a behavior but increase the sentence length when a person with HIV commits certain crimes. (4 states)
Figure 5.
HIV disproportionately affects gay and bisexual men (and other men who have sex with men), Black and Hispanic people, and people who inject drugs. Similarly, people identifying as lesbian, gay, and bisexual, Black and Hispanic people, and people with substance use disorders are targeted for policing and overrepresented in the national prison population. We cannot draw conclusions about just how much effect HIV criminalization laws have on the number of people with HIV in prison, in part because HIV or STI-specific laws are not often considered the “most serious offense,” are often a “lesser offense” contributing to sentencing, and therefore are not denoted in most criminal legal system data. However, we know that many of the same people who are most vulnerable to HIV infection are also disproportionately affected by both HIV criminalization laws and mass incarceration.
HIV criminalization in the South: A closer look at Florida
In the South, the overlap between HIV prevalence in prisons, HIV criminalization, and incarceration is stark. Eleven of the 17 Southern states (as defined by the CDC) have HIV-specific criminalization laws on the books. An additional three states have enacted STI-specific laws. Florida presents a particularly egregious example of how these dynamics can coincide.
In 2021, Florida had the highest in-prison HIV rate with 1,800 HIV-positive people in prison (almost 3% of the state’s prison population). The state also has some of the most oppressive HIV-related criminal laws. The Williams Institute at UCLA has reported in-detail about specific statutes that criminalize HIV in Florida, including offenses that criminalize people living with HIV and other sexually transmitted diseases “in the contexts of sex work, donation of blood and other bodily products, and consensual sex without disclosure.” Florida also has sentence enhancements for “certain non-consensual sex offenses where the defendant has a previous positive HIV test.”
From 1997 to 2020, at least 154 people were imprisoned in Florida for HIV-related offenses,17 including those listed above. While this may be a small percentage of the overall Florida prison population (which was the third largest state prison system in 2021), it’s important to note that these 154 people did not have a “more serious offense” other than their HIV-related offense, and that the enforcement of such laws disproportionately targets women, Black people, and people who engage in sex work:
Sex work. Six-in-ten HIV-related convictions in Florida were connected to sex work.
In addition to the criminalization of already-vulnerable people living with HIV, the cost of incarceration associated with Florida’s HIV criminalization laws has been more than $15 million over the past 23 years.
Florida is not the only state that criminalizes HIV, as we discussed above. Other states with the highest rates of HIV in prison – Louisiana and Georgia – have HIV criminal laws on the books, too.
Conclusion
Though some states and the Bureau of Prisons have seen rising prevalence rates of HIV since the pandemic began, the portion of the overall prison population living with the virus has changed little since 2016. There are fewer people living with HIV in prison than there were in the early 2000s, but one-in-seven HIV-positive people still pass through the U.S. prison system each year. Thousands of people across the country who are facing chronic illness, and who require consistent medical care, are locked up in settings where health care is grossly inadequate. This is true not only for people with HIV but anyone with infectious, long-term, or chronic illnesses.
The fact that nearly three times as many imprisoned people are facing HIV compared to the general public creates a critical imperative for targeted public health interventions among these populations, including increased sexual health care and education in prisons, greater access to testing and treatment, and stronger post-release services that help people transition their care into the community. It also underscores the need to address the issue at the front-end of the system by ending the criminalization of people with HIV and addressing the targeted policing of populations that have been made particularly vulnerable to the virus.
Footnotes
Throughout this briefing, “prevalence” is defined as the percent of people living with HIV in the total population. While public health officials often utilize “incidence rate” – the number of new diagnoses per 100,000 – this is unfortunately not compatible with any of the HIV data published by the Bureau of Justice Statistics in the HIV in Prisons series. ↩
This is based on available data from BJS from 1991-2021. ↩
There is 2020 data available from the CDC, although the agency cautions against using this data “due to the impact of the COVID-19 pandemic on access to HIV testing, care-related services, and case surveillance activities in state and local jurisdictions.” In light of this, we opted to exclude 2020 HIV data from the CDC throughout this briefing, and use 2019 to represent the most recent data. ↩
In the 2021 iteration of HIV in Prisons, the Bureau of Justice Statistics states: “Data on deaths are no longer presented in this report. BJS ceased collection of detailed mortality data in state and local correctional facilities after the 2019 data year.” ↩
The HIV in Prisons series collected and published mortality data on HIV up until 2019, but has since stopped publishing this data. In addition, there is an information vacuum regarding deaths in custody, leaving advocates, researchers, reporters, and government officials with little-to-no data to understand trends in, and the causes of, deaths in U.S. prisons and jails. For more about this data gap, see Seven years after the deadline – still no complete data or analysis from DOJ on deaths in custody from the UCLA Law COVID Behind Bars Project and their newest project, the Carceral Mortality Project. ↩
These data – collected and published by the CDC – provide the number of deaths of “persons with diagnosed HIV infection ever classified as stage 3 (AIDS)” and that these deaths “may be due to any cause.” Of note, this is a different definition than the BJS prison death data, but it is the closest comparison we could find. Centers for Disease Control and Prevention, National Center for Health Statistics. National Vital Statistics System, Mortality 2018-2021 on CDC WONDER Online Database, released in 2021. Data are from the Multiple Cause of Death Files, 2018-2021, as compiled from data provided by the 57 vital statistics jurisdictions through the Vital Statistics Cooperative Program. ↩
Further evidence of the racial disparities and disproportionate effect of HIV among Black men in particular is evident in the 2021 CDC data as well: Black people accounted for 50% of the approximately 5,000 AIDS-caused deaths in the U.S. and 30% of all AIDS-caused deaths were of Black men in particular. ↩
The CDC classifies the South as Alabama, Arkansas, Delaware, District of Columbia, Florida, Georgia, Kentucky, Louisiana, Maryland, Mississippi, North Carolina, Oklahoma, South Carolina, Tennessee, Texas, Virginia & West Virginia. ↩
This trend is also present in the regional differences in incidence rates of HIV: the rate of new diagnoses of HIV is highest in the South, at 15.2 per 100,000 people, which is 60% higher than the incidence rate in the Northeast. ↩
This is not necessarily surprising, as New York City was one of the hardest hit cities by the HIV epidemic in the U.S. And while New York City – and the state of New York – have seen significantly declining rates of new diagnoses, the city “continues to have one of the largest HIV epidemics in the United States.” ↩
Opt-out testing refers to policies that mandate that everyone is offered a test and will receive a test unless they explicitly decline it. ↩
The 50 reporting prison systems include 49 state prisons and the federal Bureau of Prisons. Alaska did not report data on testing practices during the intake process for the 2020 or 2021 survey. ↩
The survey BJS disseminates to compile data for the HIV in Prisons series does not define vulnerable populations (or “high risk” in BJS parlance), nor does it explain what constitutes “an incident.” Instead, BJS permits the responding prison systems to check a box to indicate they offer testing after involvement in “an incident” without further clarification. There is likely significant variation between prison systems with regard to how they determine who is particularly vulnerable to HIV and what “incidents” trigger the offer of HIV testing. For example, the data does not indicate if people are offered HIV tests after working a shift in the infirmary, after having an injury, or after being assaulted by staff or other people in prison. We also cannot be sure who the prison systems are classifying as particularly vulnerable to HIV infection, such as people getting tattoos or people with histories of intravenous drug use.
For example, while we know HIV is transmissible through blood transfusions, the donation process involves thorough testing and it is extremely unlikely that anyone will contract HIV through blood or organ donation. Florida’s law criminalizing the donation of blood or organs for people who are living with HIV is unnecessary given the extent of testing conducted on donated blood and organs. ↩
This means that their “most serious offense” was an HIV-related offense, not something else that would be considered more “serious,” like homicide or burglary. ↩
As if serving a prison sentence wasn’t punishment enough, 20 states and the federal Bureau of Prisons detain over 6,000 people, mostly men,1 who have been convicted of sex offenses in prison-like “civil commitment”2 facilities beyond the terms of their criminal sentence. Around the turn of the millennium, 20 states,3 Washington D.C., and the federal government passed “Sexually Violent Persons”4 legislation that created a new way for these jurisdictions to keep people locked up — even indefinitely — who have already served a criminal sentence for a “sex offense.” In some states, people are transferred directly from prison to a civil commitment facility at the end of their sentence. In Texas, formerly incarcerated people who had already come home from prison were rounded up in the middle of the night and relocated to civil commitment facilities without prior notice. This practice, though seldom reported on, made some news in 2017 when the U.S. Supreme Court declined to hear a case from Minnesota after a federal judge deemed the practice unconstitutional. The Prison Policy Initiative has included civil commitment in our Whole Pie reports on U.S. systems of confinement, but here we offer a deeper dive, including recently-published data from a survey of individuals confined in an Illinois facility under these laws.
Two critiques of “civil commitment”
Some advocates call civil commitment facilities “shadow prisons,”5 in part because of how little news coverage they receive and how murky their practices are. In Illinois, for example, the Department of Corrections (DOC) facilities are overseen by the John Howard Association, an independent prison watchdog organization. But Rushville Treatment and Detention Facility, a civil commitment center that opened after Illinois enacted its own Sexually Violent Persons Commitment Act in 1998, is not subject to the same kind of oversight because it is housed under the Department of Human Services and is not technically classified as a prison.6 This is true in many states that have “Sexually Violent Persons” laws on their books, and consequently, horrific medical neglect and abuse proliferate in these shadowy facilities. For instance, a New Jersey civil commitment facility was one of the deadliest facilities at the beginning of the COVID-19 pandemic.
Similarly, Rushville is not held to the same reporting requirements as DOC facilities, so gathering data about people’s movement in and out of the facility is only possible by filing an open records request. Reportedly, the Bureau of Justice Statistics will take steps to begin collecting data about indefinite post-sentence ‘civil’ confinements in June of 2023. Until that happens, it’s only possible to get aggregated counts of how many people are civilly committed — nothing like the individual-level information prison systems are expected to provide in the service of transparency and accountability. This is true across the U.S., as civil commitment facilities are housed under different agencies from state to state, which makes it exceedingly difficult to measure the full scope of these systems on a national level. As a result, estimates about how many people are currently civilly committed vary from 5,000 to over 10,000 people.7 Increased accountability and oversight must be chief among efforts to address this broken turn-of-the-millennium policy trend.
A second critique of this system is reflected in another term advocates use to describe it: “pre-crime preventative detention.” Civil commitment (unlike other involuntary commitment practices, such as for the treatment of serious mental illness) can be seen as “double jeopardy” repeat punishment for an initial crime,8 or preventative detention for a theoretical future crime that has not occurred. Advocates rightly critique the fact that one of the primary justifications for civil commitment is the predicted risk that detained individuals will “re-offend,” even though people who have been convicted of sex offenses are less likely to be re-arrested than other people reentering society after incarceration.
Regardless, in many states, people who have been convicted of sex offenses are transferred from DOC facilities to civil commitment facilities at the end of their sentence and held pretrial, then re-sentenced by the civil courts. The length of these sentences is often indeterminate, as release depends on progress through mandated “treatment.” But neither “risk assessment” nor “progress through treatment” are objective measures. In fact, advocates and people who have experienced these systems argue that risk assessment tools are used to rationalize the indefinite confinement of identity-specific groups, and that assessing progress through treatment is a highly subjective process determined by a rotating cast of “therapeutic” staff.
New data: A survey of individuals held in a “civil commitment” facility
A recent report from Illinois (which I co-authored) goes beyond the numbers and reports that for many, civil commitment seems like a life sentence. This 2022 report, based on a 2019 study of residents at Rushville Treatment and Detention Facility (one of Illinois’ two civil commitment facilities), exposed demographic disparities, discrimination and abuses inside, and flaws with the broader framework of civil commitment. Like the broader carceral system, civil commitment disproportionately impacts Black and Brown people. In particular, the Illinois report noted an overrepresentation of Black, Indigenous, and multiracial people at Rushville. This is in line with the findings of the Williams Institute’s 2020 report, which found that, on average, Black people were detained in civil commitment facilities at twice the rate of white people in the states studied.
Biased admission criteria lead to disproportionate consequences for select groups
Further, the overrepresentation of LGBTQ+ and disabled people in these facilities reflects obvious biases that are “baked into” the civil commitment decision-making process. Many states use risk assessment evaluations to assess whether or not one should be civilly committed. These actuarial tools use outcome data from previously incarcerated people and conclude that, because past studies found groups with specific characteristics more likely to re-offend, individuals that match those criteria must be continually confined. Risk assessment tools are generally problematic and frequently make incorrect predictions. Chicago attorney Daniel Coyne says that in sex offense cases, risk assessment tools are 58% accurate, or “not much better than a coin toss.”
Illinois and many other states use the Static-99/99R, which predicts individuals’ risk using data about groups that come from overwhelmingly unpublished studies. This risk assessment tool is notably homophobic, as it assigns a point (and thus, a higher risk value) to those who have a “same-sex victim.”9 The Williams Institute writes:
In addition to normalizing violence against women, this a priori assigns gay, bisexual, and MSM [men who have sex with men], who are more likely to have a male victim, a higher score, marking them as more dangerous than men who have female victims regardless of any other characteristics of the offense.
The evaluation also considers those who have never lived with a romantic partner to be at higher risk of reoffending, which means that LGBTQ+ people who may not be able to safely live with a partner in a homophobic area and young people who may not have had the opportunity to live with a partner yet would receive higher scores. Accordingly, representation of LGBTQ+ people in Rushville was drastically higher than in the general public:
Criteria for detention usually include diagnosis with a “mental abnormality,” in particular, a personality disorder or a “paraphilic” disorder that indicates “atypical sexual interests.” “Paraphilic” is a problematic category that relies heavily on scrutinizing and pathologizing human sexuality.10 Further, the act of civilly committing people to a “treatment” facility implies that there is a mental health issue or “nonnormative” sexual behavior to be treated and/or cured. This is especially alarming given that the American Psychiatric Association completely disavows the practice, saying, “Sexual predator commitment laws represent a serious assault on the integrity of psychiatry.”11
Since having a “mental abnormality” is a criterion for admission, measuring the overrepresentation of disabled people in these facilities is challenging. By the logic of civil commitment, 100% of people inside have a psychiatric disability. In the Illinois report, 26% of Rushville respondents self-identified as having a disability, compared with 21% of the Illinois population. Low levels of educational attainment (i.e., having a high school degree or less) were also very high, at 48%. Anecdotally, survey respondents reported that many of their peers inside could not complete the survey because they were illiterate or had cognitive impairments that prevented them from reading and filling out a paper questionnaire, so disabled respondents’ voices are likely underrepresented.
Indefinite and punitive detention with no evidence of efficacy
Agencies that control civil commitment often insist that civil commitment is treatment, not prison. Texas Civil Commitment Center staff even went so far as to instruct detainees “to call their living quarters ‘rooms,’ not prison cells.” But advocates question whether or not civil commitment can be considered therapeutic. Can forced confinement inside facilities with high rates of violence, controlled by staff who use the same punitive measures that are common inside prisons, ever be healing?
Two-thirds of respondents inside Rushville in Illinois report that they have been sent to solitary confinement, a (potentially permanently) psychologically damaging practice. Rushville, like other civil commitment facilities across the U.S., also uses archaic treatment and evaluation technologies, including the penile plethysmograph, a “device [that] is attached to the individual’s penis while they are shown sexually suggestive content. The device measures blood flow to the area, which is considered an indicator of arousal.” Rushville detainees are subjected to chemical castration, or hormone injections that inhibit erection and have been linked to long-term health impacts. Further, their progress through treatment is measured using a variety of highly questionable evaluation tools, including polygraph lie detector test results which have been inadmissible in Illinois courts since 1981. The technologies that these facilities rely on look a lot more like medieval torture devices than the supposed “therapeutic tools” that they claim to utilize.
Even if we buy into the myth that civil commitment facilities provide the treatment they claim to offer, there is minimal evidence that this supposed treatment works, and moving through treatment tiers is difficult, if not impossible. Even staff inside report that they receive pushback when trying to advance people toward release. One review from a past employee of Rushville’s contracted mental health care service, Liberty Healthcare Corporation, reported, “The hardest part of the job is fighting for residents who should be on conditional release and dealing with the outcome when refusing to act in unethical ways.” Progress through treatment is dependent on a regularly fluctuating staff, often made up of graduate students who are finishing their residencies and then moving on to another facility. Residents inside report being demoted to earlier tiers of treatment by new residents who disagreed with previous staff members’ assertions.
With little transparency about or consistent standards regarding how to progress through treatment, many people inside say that civil commitment feels like a de facto life sentence. At Rushville, the average length of detention was 9.5 years and counting. According to a 2020 FOIA response from the Illinois Department of Human Services, more than twice as many people had died inside than had ever been released. Similar circumstances have been reported from Texas, where only five men were released in the facility’s first two and a half years of operation, four of whom were sent to medical facilities where they died shortly thereafter. A 2020 article about Rushville included the following findings:
Slightly more than half of the total population [has] been held for 10 years or more. Fifty-one people in Rushville have been held in civil commitment for 20 years or more, and 12 have been in civil commitment for 22 or more years, meaning they’ve been in civil commitment since the statute was implemented in 1998.
People inside reinforce these findings. One Illinois survey respondent reported, “This is a life sentence after the completion of a criminal sentence. We are treated worse [than] prisoners. This is a sentence of death by incarceration. Not a revolving door program.” Indefinite sentences that are contingent on progress through treatment that feels unhelpful and opaque contribute to distress inside. This distress can result in violence and a hateful culture, between detainees and from staff to detainees. Three-quarters of detainees report being discriminated against by staff, and one-quarter report being physically harmed by staff. 8% of detainees said they were sexually harmed by staff. Anecdotally, respondents shared a number of stories about experiencing physical or sexual harm from other residents. Though civil commitment facilities are tasked with “treating” sexual violence, they actually create physical environments that foster sexual, physical, and emotional violence.
Conclusions
Civil commitment facilities are not only legally and ethically dubious, they also fail to deliver on the very objectives that justified their creation. Even still, the trend toward preventative and “therapeutic” forms of detention that are fueled by biased and error-filled algorithms and risk assessment tools is growing. As one reporter from Texas notes:
Critics of private prisons see in the Texas Civil Commitment Center the disturbing new evolution of an industry. As state and federal inmate populations have leveled off, private prison spinoffs and acquisitions in recent years have led to what watchdogs call a growing “treatment industrial complex,” a move by for-profit prison contractors to take over publicly funded facilities that lie somewhere at the intersection of incarceration and therapy.
In an era where lawmakers frequently champion “evidence-based” punishment, the public must remain vigilant in questioning whether these practices actually accomplish their supposed goals. Do they reduce the mass incarceration of hyper-policed communities? Do they minimize the ongoing harms of the criminal legal system? Do they reduce the number of people entering prisons or increase the number of people exiting them? In the case of civil commitment, the answer to all of these questions is no.
Though under-resourced, the movement to address harmful civil commitment policies is longstanding. A variety of advocates12 are leading campaigns to address ineffective sex offense policies across the U.S. (including the sex offender registry system). Other organizations support ongoing litigation campaigns like the one that was considered by the U.S. Supreme Court in Minnesota. Advocates inside and outside agree that civil commitment facilities fail to deliver meaningful safety and healing.
This data was provided by the Sex Offender Civil Commitment Program Network. ↩
We use the term “civil commitment” throughout because it has widespread name recognition, and because it accurately characterizes the civil legal system’s commitment of individuals to various facilities, but as we will discuss further, advocates often use more descriptive terms such as “shadow prisons” and “pre-crime preventative detention.” ↩
These states include Arizona, California, Florida, Illinois, Iowa, Kansas, Massachusetts, Minnesota, Missouri, Nebraska, New Hampshire, New Jersey, New York, North Dakota, Pennsylvania, South Carolina, Texas, Virginia, Washington, and Wisconsin. ↩
We reference these laws by name so that they are easier for readers who want to look up the statute to find, but do not endorse using this language to refer to people. ↩
The Sex Offender Civil Commitment Program Network requests aggregate numbers from each state regularly — and these annual survey counts are what we use in our Whole Pie reports — but some advocates believe this is an underestimation because how one defines who is civilly committed varies between reporting agencies. For example, should those on “conditional release,” who are not confined but still subjected to stipulations of their state’s Sexually Violent Persons Act, be considered free? ↩
From the Williams Institute report: “Critics have also noted the potential misuse of paraphilic disorders, a group of psychiatric diagnoses related to ‘atypical sexual interest.’ This category is extremely broad and includes pedophilic disorder as well as consensual sexual ‘kinky’ behaviors such as sexual masochism and sadism. The critique is that such diagnoses can be used [as] justification for civil commitment for a wide range of offenders. Paraphilic disorders diagnoses are so broad that they could be used to characterize as mentally ill many practitioners of kink, bondage, sadomasochism, or any sexual practice perceived to be deviant. This may have important implications for gay and bisexual men and [men who have sex with men], whose sexual cultures may be viewed as kinky or otherwise nonnormative due to stigma and prejudice” (pages 2-3). ↩
Unique survey data reveal that people under community supervision have high rates of substance use and mental health disorders and extremely limited access to healthcare, likely contributing to the high rates of mortality.
Research shows that people on probation and parole have high mortality rates: two and three times higher than the public at large.1 That certainly suggests that our community supervision systems are failing at their most important — and basic — function: ensuring people on probation and parole succeed in the community.
With a similar approach to our recent series regarding the needs of peopleincarcerated in state prisons, we did a deep dive into the extensive National Survey on Drug Use and Health (NSDUH). The results of this survey, administered by the U.S. Department of Health and Human Services’ Substance Abuse and Mental Health Services Administration (SAMHSA), provide key insights into these specific — and often unmet — needs faced by people under community supervision. Because this survey asks respondents if they were on probation or parole in the past 12 months, this dataset comes closer than any other source 2 to offering a recent, descriptive, nationally representative picture of the population on probation and parole.3
The data that we uncovered — and the analyses of this same dataset by other researchers discussed throughout — reveal that people under community supervision have high rates of substance use4 and mental health disorders and extremely limited access to healthcare, likely contributing to the high rates of mortality. Moreover, the data show that people on probation and parole experience high rates of chronic health conditions and disability, are extremely economically marginalized, and have family obligations that can interfere with the burdensome — often unnecessary — conditions of probation and parole.
Who is under community supervision?
A brief demographic overview of the community supervision population
At the start of 2020, an estimated 4.1 million people were under community supervision, with the vast majority (80%) on probation. Most people on probation (75%) and parole (88%) were men and were serving a probation sentence for a felony offense (69%). Among people on probation, the “most serious offense” they were most often convicted of was drug related (26%). Among people on parole, most had a maximum prison sentence of a year or more (93%), and most commonly had been convicted of a violent offense (36%).5 Black people were overrepresented in both parole and probation populations: Accounting for 14% of the total U.S. population, Black people made up 30% of the probation population and 37% of the parole population. While most people involved in the criminal legal system — and under community supervision — are men, women serving criminal sentences of any kind are actually more likely than men to be under community supervision: in 2020, 86% were on probation or parole, compared to 67% of men serving sentences. In addition, people on probation (9%) and parole (10%) are twice as likely to identify as lesbian, gay, or bisexual when compared to the total population (5%).
Substance use and mental health
Three in 10 people under community supervision have substance use disorders, four times the rate of substance use disorders in the general population. Similarly, 1 in 5 people under community supervision has a mental health disorder, twice the rate of the general population.
In addition, NSDUH data illustrate that most people on probation and parole do not have adequate access to healthcare, implying that probation and parole offices are failing to match people with the services they need to succeed in the community. Nearly one-third of people on probation and parole with a mental health disorder report an unmet need for mental health treatment. Over two-thirds of people with substance use disorders report needing treatment, but not receiving it. Similarly, only about one-third of people on community supervision with opioid use disorder report receiving medication-assisted treatment (MAT), the “gold standard” of care.
Finally, many people on probation and parole have no health insurance, even though many people on probation and parole have incomes low enough to qualify them for Medicaid.6 25% of people on probation and 27% of people on parole were uninsured at the time of this survey. This lack of treatment access reported by people under community supervision represents a massive failure of probation and parole offices.
The community supervision population also has higher rates of disabilities, with particularly high rates of cognitive disabilities.7 Such disabilities can interfere with individuals’ ability to keep track of the 18 to 20 requirements a day people on probation must typically comply with. The particularly high rates of all types of disabilities among people on probation and parole also reflects the larger pattern of criminalizing people with disabilities.
Economic disadvantage, education, and children
The NSDUH data also indicate that people on probation and parole are extremely economically marginalized, which can interfere with probation and parole conditions. 3 out of 5 people on probation have incomes below $20,000 per year, with women and Black people having among the lowest incomes. More than half have a high school education or less. And people on probation and parole are three times more likely to be unemployed than the general population. Yet, as we have discussed before, people on probation and parole are required to payunaffordable fees and costs associated with their supervision conditions (such as drug testing or ignition interlock devices), even though many are living well below the poverty line.
Finally, the data reveal that many people — and more than half of women — on probation and parole have children. Yet, probation and parole requirements almost never consider childcare or eldercare responsibilities when setting supervision conditions, even as some states require courts to consider a defendant’s caretaker status when considering a sentence to incarceration.
General population
Probation population
Parole population
High school education or less
33%
52%
57%
Unemployed
3-4%
11%
15%
Have children
41-42%
46%
43%
Men
40%
43%
41%
Women
43%
54%
50%
Conclusions
Probation and parole systems are failing to link people to the healthcare they need, despite all the evidence showing disproportionate rates of serious illness and death within supervised populations. These “alternatives” to incarceration, ostensibly created to help people address the problems that led to their conviction in a community setting, also set people up to fail with burdensome, often unnecessary requirements that show little regard for people’s individual circumstances, including low incomes and childcare obligations. The clearest example of these counterproductive conditions is the requirement to abstain from drugs or alcohol; given that so many supervised people with substance use disorders do not receive treatment, what hope do they have of staying out of jail when a positive drug test may constitute a “violation”? Probation and parole systems can’t be seen as true “alternatives” until they are overhauled to support people’s medical and personal needs instead of simply monitoring and punishing their mistakes. Until then, state and local governments should double down on their investments in diversion programs that are proven to connect people with care — and, to that same end, keep people out of courts and jail as much as possible.
Footnotes
People on probation are also 3 times more likely to die than people in jails and state prisons over a given time period, adjusted for age (the study this was based on used data from 2001-2012). ↩
The Bureau of Justice Statistics conducts the Annual Probation Survey and Annual Parole Survey, which also provides a recent, descriptive, and nationally representative picture of the community supervision population. The demographic details available from the NSDUH are richer, however, going far beyond race, sex, age, and offense type. Moreover, the NSDUH presents self-reported data, while the BJS surveys present administrative data reported by probation and parole agencies. ↩
For the purposes of this analysis, we chose to use data collected in the 2019 NSDUH rather than the more recent 2020 survey results. In the 2020 NSDUH report, the authors cautioned that “care must be taken when attempting to disentangle the effects on estimates due to real changes in the population (e.g., the coronavirus disease 2019 [COVID-19] pandemic and other events) from the effects of these methodological changes.” Because of this warning, we elected to use 2019 NSDUH so that our results could be better compared over time. Researchers updating our work in the future, however, should note one important methodological change occurred in 2020: “2020 marked the first year in which substance use disorders (SUDs) were evaluated using criteria defined in the Diagnostic and Statistical Manual of Mental Disorders, 5th edition (DSM-5), as opposed to criteria specified in the Diagnostic and Statistical Manual of Mental Disorders, 4th edition (DSM-IV).” ↩
“Substance use disorders” in this analysis were evaluated by the using criteria from the Diagnostic and Statistical Manual of Mental Disorders, 4th edition (DSM-IV). See footnote 3 for more information. ↩
The data on offense type for people on probation and parole used here from the Bureau of Justice Statistics, defines “violent” offenses as domestic violence offenses, sex offenses, or other violent offenses. However, generally, the distinction between “violent” and other crime types is a dubious one; what constitutes a “violent crime” varies from state to state, and acts that are considered “violent crimes” do not always involve physical harm. The Justice Policy Institute explains many of these inconsistencies, and why they matter, in its comprehensive and relevant report, Defining Violence. ↩
In all states, Medicaid provides health coverage for low-income people who qualify based on income, household size, disability status, and a handful of other factors. Most people in contact with the criminal legal system are likely eligible for Medicaid: People in prisons and jails are among the poorest in the country and have high rates of disabilities, making them likely eligible for Medicaid in almost every state. People in contact with the criminal legal system have drastically lower pre-incarceration incomes than people who are never incarcerated. In fact, 32% of people in state prisons in 2016 who had insurance at the time of their arrest were covered by Medicaid (compared to about 19% of insured people nationwide). As an additional indicator of need among this population, 50% of people in state prisons were uninsured at the time of their arrest. ↩
In this dataset, “cognitive disabilities” are defined as “serious difficulty concentrating, remembering, or making decisions.” ↩
Family separation due to a parent’s incarceration has impacted over 5 million children and has profound negative impacts on a child’s well-being. But some states are addressing this crisis. We reviewed recent legislation and found that, in response to pressure from advocates to address the crisis of family separation by incarceration, 12 states and the federal prison system have taken legislative action to lessen parental incarceration’s disruptive effects.
Parental incarceration can have lasting effects on children into adulthood. Child development experts consider a child’s household member becoming incarcerated an “Adverse Childhood Experience,” which correlates to challenges throughout childhood development, negative effects on health, and adverse impacts on employment and educational outcomes. The state’s typical responses to parental incarceration often worsen this crisis, permanently changing a family’s relationships by placing children in foster care or terminating parental rights, but advocates are fighting for creative and holistic solutions.
As a result of tireless advocacy, often led by formerly incarcerated women, legislatures are finally addressing this problem. Four states and the federal prison system have implemented requirements that parents be detained within a specified distance of their kids, making it easier for children to access their caregivers. Eight states have passed legislation requiring a convicted person’s status as a caregiver to be considered a mitigation factor in their sentencing, or allowing parents priority access to diversion and alternative-to-incarceration programs. (Caregiver laws are also currently being considered in the Connecticut, Maine, and Rhode Island state legislatures.)
Caregiver mitigation and diversion laws: The best existing reform targeting family separation
Of course, the best way to maintain a bond between a parent and their child is to avoid separating them, so some states have implemented caregiver mitigation or diversion laws. Mitigation laws, like those in Illinois and Massachusetts, require judges to consider a person’s status as a caregiver when sentencing them. In other states, including California,1Louisiana, Oregon,2Tennessee, Washington, and Missouri, 34 caregiver diversion laws create specialty programs for parents or give parents priority access to diversion or alternative-to-incarceration programs such as drug treatment programs, electronic monitoring, or other community-based alternatives. The successful implementation of these laws in states with very different political climates suggests that this is a type of criminal justice reform which — since it places the welfare of children at the center — draws support from legislators across political divides. (For model legislation, see the original bill proposed in Tennessee.)
It’s worth noting that the strength of existing caregiver laws varies widely by state: Some laws merely suggest that judges take a person’s caregiver status into account, while Massachusetts, for example, outlines a clear and formal process that requires a judge to either give an alternative community-based sentence or write a justification for why they are not doing so.
Unfortunately, states that assign parents to alternative or diversion programs have faced limitations to funding, scarcity of available programs, and stipulations like sunset policies and “pilot programs” that leave programs precariously funded and vulnerable to ending. Nationally, diversion and alternative sentencing programs are underfunded. Demand often exceeds capacity in successful but resource-strained programs (for instance, in Seattle and Los Angeles). Unless caregiver mitigation and diversion laws include provisions to allocate funding for a new court, program, or alternative sentence, these laws risk enhancing the burden on already overburdened programs. (A federal bill, the FAMILIES Act, introduced by Sen. Ron Wyden and Rep. Pramila Jayapal, has the potential to alleviate some of this strain: The bill would not only offer primary caregivers in the federal system opportunities for diversion, but fund grants for states to create new diversion programs. The FAMILIES Act has unfortunately repeatedly died in committee.)
Even when diversion programs are available, not all are not created equal. Many diversion programs effectively funnel people into prison anyway,5 and strict eligibility policies often exclude deserving individuals — especially those with violent offenses (a problematic and fluid category) — from these programs. For maximum impact, diversion opportunities should not include broad exclusions (or “carve outs”) based on offense type.
Proximity laws: A promising reform facing major implementation challenges
Unfortunately, legislative and logistical challenges have limited the impact of these laws. Prisons isolate people by placing them in geographically remote areas, which makes it difficult for many states to implement their proximity legislation. For example, in Florida, “the measure originally encouraged the Department of Corrections to place inmates within 150 miles of their families, but [a legislator] amended the bill to widen the radius to 300 miles. ‘Our problem is, most of the prisons are in the Panhandle, and most of the people are down south.’”7 Similar challenges exist in New York; although 41% of incarcerated New Yorkers are from New York City, almost all of the facilities are upstate, hundreds of miles from the city.8Further, many states only have one women’s prison that is often located rurally. This limitation makes it hard to preserve bonds between incarcerated mothers and kids in major cities.
Quality proximity legislation must include funding and infrastructure for visitation and transportation for children of incarcerated parents. Traveling great distances is time-consuming and inaccessible for families who do not have cars and need to reach loved ones locked up in areas that aren’t accessible by public transit. While some non-profit organizations and social service agencies have attempted to remedy this by providing free “reunification rides,”9 such programs are a private sector band-aid fix to an issue that better legislation and policy could solve.
Case Study: A Look At Parental Incarceration in Illinois
The experiences of advocates in Illinois show effective implementation of laws is essential for success.
While Illinois advocates have won several reforms that expand incarcerated parents’ rights, many barriers have hindered their implementation. Observing this long uphill battle offers interesting insights about the limited value of passing legislation without effective implementation measures in place.
Illinois is one of seven states with a nursery where incarcerated new mothers can spend up to two years with their newborns, but there are often more than three times as many pregnant people in the Illinois Department of Corrections than there are spaces in the Moms and Babies program. Even though demand outweighs capacity, admissions requirements are so strict that spaces in the program often sit empty. At the beginning of the COVID-19 pandemic, all program participants were released, which is a promising reminder that simply releasing parents from prison is possible. As of April 2021, the program had not resumed accepting participants even though the DOC had started re-admitting people, including pregnant people.10
Additionally, the 1998 Women’s and Children’s Pre-release Community Supervision Program Act requires the state to create a community-based program where mothers and young kids can live together outside of prison, but according to 2021 reporting, “the directive has been underutilized … only one program, the Women’s Treatment Center in Chicago, has been contracted.”11An article in Truthout reported that over a four-year period, the Women’s Treatment Center received only three women from prison. Newer reporting from the Chicago Tribune indicates that this center has since closed.
In 2019, Illinois attempted to expand incarcerated parents’ rights by passing the Children’s Best Interest Act, inspired by legislation crafted by members of the National Council for Incarcerated and Formerly Incarcerated Women and Girls, such as the original Tennessee bill. The Children’s Best Interest Act requires that a court consider whether a defendant is the parent of a child or a caregiver for a relative who will be negatively impacted by the defendant’s absence. The act specifies that the following factors be considered:
If the parent is breastfeeding the child;
the age of the child, with strong consideration given to avoiding disruption of the caregiving of an infant, pre-school, or school-age child by a parent;
the role of the parent in the day-to-day educational and medical needs of the child;
the relationship of the parent and the child;
any special medical, educational, or psychological needs of the child;
\the role of the parent in the financial support of the child.
The Act also allows defendants to present another form of mitigation during sentencing: “a Family Impact Statement…which the court shall consider before imposing any sentence and may include testimony from family and community members, written statements, video, and documentation.”12
While the potential benefits of this legislation are promising, many limitations have stifled its impact so far. After going into effect in January 2020, the COVID-19 pandemic delayed sentencing hearings, pushing back implementation. Further, though advocates on the ground are organizing to spread the word, the legislation did not create an initiative to educate judges and attorneys about the changes that result from this legislation. Finally, the act does not change or bypass mandatory minimums, meaning there are limitations to the discretion that a judge can exercise during sentencing. Illinois advocates continue resisting these barriers to implementation, and their struggle can provide insights that advocates in other states might consider when pursuing legislation about incarcerated parents in their own state.
Considerations for successful policy and advocacy efforts
A criminal sentence should not equate to a termination of parental rights, and children of incarcerated parents should not bear the brunt of their parents’ punishment. Defending incarcerated parents’ rights and attending to the needs of the children are vital goals that more states should pursue. While caregiver mitigation or diversion and proximity laws are positive first steps, these laws are too often hindered by overreliance on under-resourced diversion programs, a failure to educate judges and attorneys on changes in the law, and a lack of transportation infrastructure for kids of incarcerated parents. Furthermore, some laws bar people convicted of any violent offense from benefiting from the reforms at all. Future laws should focus on making reforms applicable to as many people as possible, maximizing the time shared between parents and children, and minimizing the burden on families for pursuing that time together.
Further reading for advocates and policymakers interested in protecting incarcerated caregivers and their children:
Model legislation: the original draft of the Tennessee legislation, shared by the National Council for Incarcerated and Formerly Incarcerated Women and Girls, and a 2018 Louisiana bill drafted by Operation Restoration, which would have also allowed courts to vacate the judgment of conviction with successful completion of the program, and would broaden eligibility to include caretakers of people with mental or physical disabilities of any age who cannot take care of themselves.13
Are you aware of resources or advocacy efforts that aren’t mentioned in this briefing? Let us know through our contact page.
Footnotes
Most of these states’ laws create diversion programs that begin during the sentencing process, allowing defendants to avoid incarceration but not a criminal conviction. California’s law goes further: Its program diverts primary caregivers from incarceration during the pretrial period, and individuals who successfully complete the program avoid not just incarceration, but the collateral consequences of a criminal conviction. ↩
Oregon’s law, passed in 2015, established a “Family Sentencing Alternative Pilot Program,” to sunset in 2025 (or, presumably, to be replaced with more permanent legislation). Currently, the diversion program is only active in 5 of the state’s counties: Deschutes, Jackson, Marion, Multnomah, and Washington. The linked report includes more information about outcomes of the program. ↩
One more state — Minnesota — is not on this list but deserves a mention. In 2021, Minnesota passed the “Healthy Start Act,” allowing the Department of Corrections Commissioner to conditionally release people to community-based programming who are pregnant or immediately postpartum for up to 12 months. We did not include this among the states that have passed primary caregiver legislation because of how few caregivers are eligible for this program and for how limited the diversionary period is. However, it is a vast improvement on the previous law, which only allowed a 36-to-72 hour departure from the correctional facility for a mother to give birth and separated mothers from their newborns immediately. ↩
Texas and Arizona also introduced caregiver diversion bills that did not pass in 2019 and 2021, respectively. ↩
This study states that “Recidivism, the outcome variable, was measured two different ways in this study. It was operationalized as 1) a reconviction for a felony-level offense, and 2) a revocation for a technical violation.” We believe that how you measure “recidivism” is complex and that the equation of these two outcomes is problematic, as is outlined here. ↩
Operation Restoration also successfully passed a related Primary Caretakers Arrest Bill in 2021, which sets out training and procedures for arrests of people caring for minor children, to reduce the traumatic impact of primary caretakers’ arrests on children. ↩
Millions of people with criminal records likely meet the income eligibility requirements for public housing assistance. But needlessly strict local policies lock them out of housing. We explain how your public housing authority may be overly exclusionary.
by Selena Muñoz-Jones and Emily Widra,
February 15, 2023
Housing is a human right: the right to adequate housing is recognized by international law, including the Universal Declaration of Human Rights. But we know that in the U.S., hundreds of thousands of people face homelessness, and there are particularly high rates of homelessness and housing insecurity among formerly incarcerated people across the country. Our previous research found that people who have been to prison just once experience homelessness at a rate nearly 7 times higher than the general public. But people incarcerated more than once have rates 13 times higherthan the general public. Inevitably, part of the problem is that public housing policies — which should be a part of a crucial safety net against housing insecurity — actually discriminate against people with criminal legal involvement and criminal records.
Part I of this briefing delves deep into the policies of the U.S. Department of Housing and Urban Development (HUD) that give local public housing authorities (PHAs) overly broad discretion to deny housing to people with criminal records. We review how PHAs wield this discretion to deny people housing in more ways than required by federal law. Part II of this briefing is a guide to critically reviewing public housing policies to help you identify the criteria your local PHA has chosen to use to exclude people with criminal records and to help you evaluate whether those criteria are necessary or potential targets for local-level reforms.
Part I: An introduction to local public housing authorities’ exclusion of people with criminal histories
We know that access to safe, stable, and affordable housing is crucial for healthandwell-being, and for formerly incarcerated people, housing is also crucial for successful reentry. The transition from prison to the community is rife with challenges. But before formerly incarcerated people can begin to address health problems, find stable jobs, or learn new skills, they need a place to live.
Across the country, there is a shortage of affordable housing which gives landlords the option of denying housing to people with criminal records (most conduct criminal background checks on prospective renters), leaving public housing, Section 8 vouchers, and other assisted housing as their only choices. But even public housing sets up barriers for people with any involvement with the criminal legal system. At least 79 million Americans have a criminal record1 and more than a quarter of formerly incarcerated people are unemployed, meaning that millions of people with criminal histories likely meet the income eligibility requirements for public housing assistance:
While the available data do not allow us to determine exactly how many people would qualify for public housing if not for their prior criminal legal system contact, based on just how widespread housing insecurity and homelessness are among formerly incarcerated people, it’s safe to assume that public housing policies significantly impact formerly incarcerated people. The criminal legal systemdisproportionatelytargetspeople of color, so the individuals, neighborhoods, communities, and families facing the collateral consequences of incarceration are also facing the compounded effects of poverty and systemic racism enshrined in housing policies.
Introduction to public housing authorities
There are over 3,000 public housing authorities (PHAs) granting access to the more than 970,000 public housing units for low-income families and individuals across the country. PHAs are local agencies that determine public housing eligibility based on general guidelines published by the federal Department of Housing and Urban Development (HUD).
In 1968, the Fair Housing Act expanded the Civil Rights Act of 1964, prohibiting discrimination in housing transactions (renting, buying, and selling) on the basis of race, religion, sex, national origin, family status, and disability. Importantly, the 1968 Fair Housing Act — nor any subsequent revision — has not considered criminal history status as a protected class, meaning that housing policies can legally discriminate based on criminal legal system involvement.2
However, in 2016, HUD issued a memo to PHAs clarifying that while having a criminal record is not a protected status, criminal records alone do not justify an automatic denial without justification. Because PHAs’ use of criminal history as a disqualification for public housing has disproportionately impacted Black, Indigenous, and people of color, this memo clarified that the exclusion of people based solely on criminal legal histories was a type of race-based discrimination. Even without identifying people with criminal histories as a protected class, this memo should have created a pathway to hold PHAs responsible for denials of housing with discriminatory intent or effects as violations of the Fair Housing Act. But although the 2016 HUD memo shifted PHAs’ policies from allowing a blanket exclusion of people with any criminal record to a more focused exclusion of those with drug or ‘violent’ offense histories, the official guidelines leave so much to local interpretation that PHAs are still able to discriminate broadly on the basis of criminal legal system involvement, as we explain below.
Doubling down on its 2016 guidance, in June 2022, HUD published the most recent changes to federal public housing policies. These guidelines advocated for PHAs to make their 2023 public housing policies3as inclusive as possible for people with histories of criminal legal system involvement. It remains to be seen how PHAs will — or will not — incorporate this directive, as there is no evidence that HUD is limiting the amount of discretion permitted within the existing rules.
Denial of public housing assistance for people with criminal histories
HUD establishes two types of denials — mandatory and permissive — that local authorities use in making decisions about housing for people with criminal histories. The language in both sections leaves far too much room for discriminatory decision-making by local public housing authorities (PHAs).
Mandatory prohibitions
First, there are automatic reasons for which local PHAs must issue denials, as decreed by HUD (“mandatory prohibitions”) (24 CFR §982.553):
The PHA determines that any household member is “currently engaging in illegal use of a drug;”
The PHA determines that it has reasonable cause to believe that a household member’s “illegal drug use or a pattern of illegal drug use may threaten the health, safety, or right to peaceful enjoyment of the premises by other residents;”
Any household member has ever been convicted of “drug-related criminal activity for manufacture or production of methamphetamine” on the premises of federally assisted housing;
A household member has been evicted from federally assisted housing for “drug-related criminal activity” in the past three years; or
Any member of the household is subject to a lifetime registration requirement under “a State sex offender registration program.”
As you can see, throughout these reasons for mandatory denials, there is still significant room for discretion at the local level. For example, there is no definition of what “currently” means and each PHA has the authority to define this timeframe however they want: for example, “currently” could be defined as within the last week, the last six months, or within the last year.
Permissive prohibitions
The second kind of denial issued for people with criminal histories is not federally required, but instead, the PHA elects to expand the criteria for denial. These “permissive prohibitions” often build on the above federal requirements to make public housing access even more restrictive. PHAs “may prohibit admission” if the PHA determines that any household member “is currently engaged in, or has engaged in during a reasonable time before the admission” the following behaviors (24 CFR §982.553):
“Drug-related criminal activity;”
“Violent criminal activity;”
“Other criminal activity which may threaten the health, safety, or right to peaceful enjoyment of the premises by other residents or persons residing in the immediate vicinity;” or,
“Other criminal activity which may threaten the health or safety of the owner, property management staff, or persons performing a contract administration function or responsibility on behalf of the PHA (including a PHA employee or a PHA contractor, subcontractor or agent).”
Ultimately, the federal government offers PHAs freedom in determining how to define all of the terms used above, including “currently,” “reasonable time,” “threaten,” and “peaceful enjoyment,” essentially granting PHAs vast autonomy over denials of public housing assistance for virtually any criminal history they choose.
Addressing your local PHA policies
Local PHAs can — and do — exercise a great deal of discretion when crafting and implementing their policies that determine who is and isn’t eligible for low-income public housing. While HUD provides guidelines on criteria for access and denial (24 CFR §982.553), individual PHAs often make their policies even more restrictive than the HUD recommendations. In fact, almost all PHAs use permissive prohibitions to make their policies more restrictive.
Not all public housing policies are created equal, and we encourage you to investigate your local policies. To that end, because these policies often use the same general template, we have looked at general trends across these policies to outline key areas for local advocates to take a closer look at. In Part II below, we offer a guide for analyzing of public housing policies. If you find your local public housing authority is needlessly discriminating against people with criminal histories, we encourage you to advocate for changes to the policies for the coming year. These documents are public and are often updated annually with public comment periods (often in the first few months of the calendar year). This is an opportune time to view the documents, provide necessary feedback, and advocate for fair and just housing policies in your community before they are submitted for approval and implemented.
Part II: How to critically review your local public housing authority policy’s exclusions for people with criminal histories
Local public housing authority policies often limit or completely deny public housing assistance to people with criminal histories. Some of the reasons for exclusion are mandatory and determined by the federal Department of Housing and Urban Development (HUD) (see Part I for more information on these mandatory prohibitions). But most public housing authority policies are even more exclusionary than the federal regulations require, needlessly denying housing assistance to those likely to need it most.4
It’s not always clear how or why people with criminal histories are denied public housing assistance, nor which rules could be changed through advocacy efforts. We put together this guide to help local advocates and decision-makers identify questions to consider when looking for ways to make local public housing policies more inclusive and housing more accessible to residents with criminal histories.
Here are 5 major questions to look at in your local policy:
What actions and behaviors that exclude people from public housing?⤵
How does the PHA define “current” and “currently”?⤵
What evidence does the PHA uses to identify prohibited actions and behaviors?⤵
What kinds of actions and behaviors exclude people from public housing assistance?
There are five federally required “mandatory prohibitions”, or behaviors for which PHAs are required by HUD to deny public housing assistance. But there are far more “permissive prohibitions” — i.e., behaviors for which PHAs can choose to deny assistance regardless of federal guidelines — and we find that PHAs exercise significant discretion to make these policies more exclusive than necessary:
“Drug-related criminal activity.” HUD defines “drug-related criminal activity” as “the illegal manufacture, sale, distribution, or use of a drug, or the possession of a drug with intent to manufacture, sell, distribute or use the drug” (24 CFR §5.100). Federal regulations require denial of assistance if there is “current” engagement “in the illegal use of a drug” or “a pattern of illegal drug use [that] may threaten the health, safety, or right to peaceful enjoyment of the premises by other residents” (24 CFR §982.553). However, federal regulations do not require PHAs to look for any history of “drug-related criminal activity” nor does HUD require PHAs to deny assistance to people with such a history.
Importantly, throughout all public housing authority policies, “illegal drugs” refers to federally illegal drugs, including marijuana (the medical use of cannabis has been legalized in 37 states and D.C., and the recreational adult use of cannabis has been legalized in 21 states and D.C.). So, for example, while someone has not participated in the “illegal use of a drug” by using marijuana in the state of Colorado (where it is legalized), for the purposes of public housing assistance, a Colorado PHA can and will consider this “drug-related criminal activity” to deny assistance. At a minimum, PHA policies should be written to be in line with state law, specifying exceptions for drug-related activities in states where those drugs have been decriminalized. A more comprehensive step would be to pass H.R. 3212,5 a bill introduced in the House to resolve this discrepancy between state and federal marijuana laws in public housing assistance.
“Violent criminal activity.” HUD defines this as “any criminal activity that has as one of its elements the use, attempted use, or threatened use of physical force substantial enough to cause, or be reasonably likely to cause, serious bodily injury or property damage” (24 CFR §5.100). Federal regulations do not require PHAs to look for any history of “violent criminal activity” nor does HUD require PHAs to deny assistance to people with this history.
While HUD provides this loose definition of “violent criminal activity,” it does not actually specify which criminal offenses may or may not be included, allowing the PHA freedom, again, to decide what behaviors can be considered “violent criminal activity.” This matters because what constitutes a “violent crime” varies between jurisdictions,6 and HUD’s provided definition does not even try to clarify what offenses are encompassed by this vague definition. In some states, entering a dwelling that you do not own is a burglary, a “violent” offense.7 Similarly, several states consider “purse snatching” and theft of drugs to be “violent” offenses. The reality is that while these offenses may momentarily shock or scare someone, they are hardly indicative of a long-term pattern of “violence” towards people, and certainly not indicative of an inability to safely live in publicly assisted housing, but PHAs are still able to consider them when denying someone housing.
PHAs currently denying housing on the basis of “violent criminal activity” in an applicant’s past should reconsider. People convicted of violent offenses have among the lowest rates of recidivism, illustrating again that people who have committed a violent act are not inherently violent people and can succeed in the community. People convicted of violent offenses are less likely to be re-arrested in the years after release than those convicted of property, drug, or public order offenses.8 An act of violence represents a single moment in someone’s life, and shouldn’t be the only factor that determines their access to housing.
Other, unspecified “criminal activity.” HUD permits — but does not require — PHAs to deny public housing assistance if the PHA determines that a household member is engaged in “criminal activity that may threaten the health, safety, or right to peaceful enjoyment of the premises residents or persons residing in the immediate vicinity” (24 CFR §982.553).
HUD provides this purposefully vague language, allowing PHAs to determine what behaviors they consider to “threaten the health, safety, or right to peaceful enjoyment.” Without any definition of what a threat to “the right to peaceful enjoyment of the premises” refers to, PHAs are free to discriminate against people who participate in almost any “criminal activity,” no matter how innocuous.
What does it mean that the PHA is evaluating “current” actions and behaviors?
Some “lookback periods” (that is, the timeframe in which behaviors are evaluated in determining eligibility for public housing assistance) are mandated by HUD (see sidebar). But there are also lookback periods that the PHAs are able to determine on their own, with no minimum or maximum guidelines from HUD. When evaluating “current” behaviors, PHAs have the ability to define what “current” means. While to most people, “current” means “right now,” PHAs define “current” in a number of different ways:
For example, some PHA policies define “currently engaged in the use of illegal drugs” to include “any use of illegal drugs in the previous six months,” or any other period of time they choose.
Similarly, “any household member’s current use or pattern of use of illegal drugs, or current abuse or pattern of abuse of alcohol” can mean almost any range of time chosen by the PHA.
Some PHAs do not even try to define “currently” or “current” in their policies, shifting this significant amount of discretion to individual decision-makers within the PHA, leaving room for inequitable decisions even within the same agency.
Lengthy lookback periods are a serious problem because they cast such a wide net. Looking at drug convictions alone, almost 400,000 people are currently incarcerated for a drug offense, and law enforcement make over 1 million drug possession arrests each year (many of which lead to convictions). The number of people excluded by lengthy lookback periods for “current” or “patterns of” drug use when they apply for public housing is staggering, given these statistics. Stable, safe, and affordable housing is crucial to reducing recidivism for all types of offenses, including drug offenses. To enhance public safety, PHAs should be expanding access to housing for people with criminal histories, not limiting it.
What time limits does HUD specify for mandatory denials?
If any household member has ever been convicted of “production or manufacture of methamphetamine on the premises of federally assisted housing,” regardless of how long ago this occurred, the PHA must deny assistance. The federally mandated lookback period here is “lifetime”.
Similarly, if any household member has ever been subject to a lifetime registration requirement under a “sex offender registration program,” the PHA must deny assistance, no matter how long ago it was. The federally mandated lookback period here is “lifetime”.
HUD also requires the PHA to deny assistance if any household member has been evicted from federally-assisted housing in the last 3 years for “drug-related criminal activity,” but PHAs can extend this time period as much as they would like, and we have seen cases where this was extended from the federally required 3 years to upwards of 5 years. The federally mandated lookback period here is 3 years, but that is only a minimum.
Given what we know about substance use, harm reduction, and the importance of housing in recovery,9 HUD should consider removing drug use as a criterion for denial. Until then, local PHAs should interpret this rule as narrowly as possible, and add exceptions for people in recovery, to minimize the number of people denied housing for “current drug use.” Some PHAs rightly have policies in place to overlook possible drug use in the lookback periods if a person has completed a drug rehabilitation program. Another possibility is for PHAs to create a process of (1) informing applicants who are denied housing for this reason of the PHA’s policies regarding drug use, (2) connecting them with community resources for treatment or supportive housing, if desired, and (3) encouraging them to reapply for public housing assistance after participating in a drug rehabilitation program.
What evidence is the PHA using to identify prohibited actions and behaviors?
Federal guidelines grant PHAs significant discretionary power in determining an individual’s participation in “criminal activity” (whether “current” or within a specific lookback period). PHAs can — and do — use the following “evidence of criminal activity” to determine eligibility for public housing assistance:
Arrests. PHAs cannot use arrest history alone to deny public housing, but they can use a known arrest as a trigger to look for more “evidence of criminal activity” or to be used in conjunction with other “evidence of criminal activity,” like convictions.
Arrests can’t be used as the sole “evidence of criminal activity” because they are not reliable indicators of actual criminal behavior, as evidenced by the large number of criminal cases that are dismissed or otherwise result in non-conviction. For example, Measures for Justice found case dismissal rates (the percentage of cases filed in court that were dismissed) ranging from 14% (in Pennsylvania) to 46% (in North Carolina) in the 16 states for which they had access to the data. And even before cases are filed in court, many cases referred by law enforcement are rejected by prosecutors; Measures for Justice found that prosecutors rejected 20% of all cases in Missouri, and 22% in Florida (the two states for which they had these data).10
Convictions. PHAs can deny public housing assistance based on conviction records. Many PHA policies will state something indicating that a “conviction is more heavily weighted than an arrest,” but it’s important to note that arrests without convictions can — but shouldn’t — still be used in conjunction with a historic conviction to deny public housing.
Evictions. A history of eviction is not an indicator of “criminal activity,” but a PHA can use an eviction history “related to the use of illegal drugs or the abuse of alcohol” as a reason to deny public housing assistance. And that creates a loophole to the “arrests aren’t evidence enough” rule: Considering that the federal regulation disallowing the use of arrests alone to deny housing is relatively recent (dating back to the 2016 HUD memo), people who were evicted following an arrest prior to the rule change could still be barred from public housing today because of the past arrest and subsequent eviction (regardless of conviction).
In addition, evictions are used to determine whether a household can meet the financial obligations of public housing. But by definition, people applying to public housing are doing so because they have difficulty meeting current financial obligations for housing, so policies that use prior evictions to determine eligibility for housing support are particularly nonsensical.11
What happens when someone is denied public housing assistance?
When a PHA denies housing assistance for a reason other than “mandatory prohibitions”, the individual or family can petition for an informal review process. However, HUD offers a long list of reasons that the PHA does not have to grant an informal review, including “discretionary administrative determinations by the PHA,” which could include almost any reason for the PHA to deny assistance (24 CFR §982.554). Additionally, if an informal hearing is required to determine if the reasons for denial “are in accordance with the law” (24 CFR §982.555), individual PHAs create the parameters of the hearing, including how quickly a family needs to request a review or hearing and instances where the denial automatically stands if the individual or family is late to the hearing. For instance, we’ve found PHA policies that state denials will stand automatically if someone is more than 15 minutes late to the hearing.
The review and hearing process is often impossible for people with criminal histories and low incomes. People with low incomes are less likely to have reliable transportation or child care, and sometimes criminal legal system involvement itself can interfere with daily life in ways that can be disqualifying.12 For example, people on probation and parole are often required to submit to random, unannounced home or work visits, which could interfere with timely arrival at scheduled hearings.
A standardized, best practice outlined by HUD would offer consistency and clarity to the review and hearing process. Instead of permitting individual PHAs to determine what “discretionary administrative determinations” do not require an informal review, HUD should outline exactly what determinations are not subject to external oversight. Similarly, while certain timelines may inevitably vary between localities based on their infrastructure, it is important for HUD to restrict situations in which denials automatically stand despite the PHA agreeing to an informal review. People with criminal histories should not be forced to jump through countless extra hoops to have the PHA’s decisions reviewed. Again, housing policies should be working towards expanding housing access, not restricting it.
Who makes the decisions?
The decision-makers that determine who gets access to public housing assistance vary by locality, but are almost never specified in the policies. Often, these policies state that “the PHA decides to offer or deny assistance,” which provides no information about who, exactly, is making these critical decisions. While every PHA has a director — and we can assume most decisions go through them — there are often cases where a city or county board of commissioners can be heavily involved in the decision-making process.
Because of the variance — and often the obscurity — of who the decision-makers are, we encourage advocates to reach out to their local PHAs for clarity and to advocate for adding this information to the public housing policy.
Recommendations
The discretionary power of PHAs resides in the ability of these systems to work without much public investment and oversight. Wherever possible, we encourage advocates to participate in public comment periods when these policies are drafted annually and let the PHAs know that you are invested in expanding housing access for all.
While local advocacy efforts can’t change HUD’s mandatory reasons for denial, which of course, should be changed, local advocates can make important changes in how their local PHAs set, interpret, define, and measure criteria for denial:
Invest in expanding affordable housing and public housing. Currently, every state is facing a shortage of affordable rental housing, and inadequate funding leaves eligible families waiting years for public housing availability. A 2022 Human Rights Watch report finds that “policy decisions taken by the U.S. federal government have resulted in a housing assistance system that fails to ensure the human right to housing,” in part due to serious reductions in federal funding of public housing. The report proposes two practical recommendations: the federal government should increase funding for affordable housing, expand funding for public housing, and review other housing assistance programs to ensure they are adequately serving the lowest-income families, and state and local governments should allocate more financial support for public housing to maintain safe, affordable low-income housing regardless of federal funding.
Eliminate additional reasons for denial beyond those required by HUD. All of the “permissive” denials documented above that go beyond HUD’s minimum requirements are unnecessary barriers to housing and should be eliminated.
Remove local discretion to “look back” into criminal history further than HUD requires. There are two ways to implement this reform:
Require PHAs to provide evidence-based justification for lookback periods beyond the few minimums set by HUD. HUD could require PHAs to provide their reasoning and justification for lookback periods that go beyond the HUD requirements. We would encourage HUD to oversee these justifications and only allow those based in fact, rather than in stereotypes of people with criminal legal system contact.
A HUD mandated standard lookback period. A mandatory lookback period that is as short as possible — without permitting the PHA to extend the lookback period — would eliminate much of the discretionary, subjective power the PHAs hold over people looking for safe and affordable housing. HUD should provide reasoning and justification for whatever lookback period it imposes.
To reduce opportunities for mistakes or discrimination, require PHAs to always issue crystal clear explanations as to why they denied housing. At a minimum, PHAs should provide clear standards for denial, including specific disqualifying offenses, allowable types of evidence, clear and relevant lookback periods, and what person(s) or decision-making bodies have discretionary power.
Make the appeal process clear and fair. While HUD does require any denial to include a “notice of denial” that includes “a brief statement of the reasons for the PHA decision,” we know that the possible reasons for denial can vary a lot between localities and are often not evidence-based (24 CFR §982.555). Currently, HUD mandates that any denial “must notify the family that the family may ask for an explanation of the basis of the PHA determination, and that if the family does not agree with the determination, the family may request an informal hearing on the decision” (24 CFR §982.555). HUD provides guidelines on how reviews and hearings operate, but again, a lot of local discretion is built in: for example, the PHA determines the deadline for requesting an informal hearing. Furthermore, HUD states that the family may be represented by a lawyer or other representative “at [their] own expense” (24 CFR §982.555), but we know that people facing discretionary denials of public housing assistance for criminal legal reasons are unlikely to be able to afford an attorney. To make this process clear and fair, advocates should demand more than just a brief statement of the reasons for the denial and recommend a comprehensive explanation and information about how and when the individual or family can become eligible for public housing. PHAs should provide referrals to community-based legal aid or pro bono programs that provide free legal help for low-income people, or alternatively, direct applicants to a public service-oriented lawyer referral service (often run by state and local bar associations).
Footnotes
Not all people with a criminal record have been incarcerated in a jail or prison. ↩
A protected class refers to people who have “a common characteristic and who are legally protected from discrimination based on that characteristic.” Under federal law, people are protected from discrimination based on race, color, religion, sex, gender, sexual orientation, pregnancy, national origin, age, disability, and genetic information. People in protected classes can sue for discrimination based on their protected class status in housing and employment. In 2022, Atlanta added formerly incarcerated people to their list of protected classes, which “prohibits discrimination against individuals for criminal convictions, just as it offered legal protections against racial, age-based and other forms of discrimination.” For more information on making formerly incarcerated people a protected class, seeEnding Legal Bias Against Formerly Incarcerated People from the Haas Institute at UC Berkley. ↩
Throughout this briefing, we refer to the policies from public housing authorities as “public housing policies” that outline the criteria for access to housing assistance. These are often called Administrative Plans (APs) and/or Admissions and Continued Occupancy Plans (ACOPs), and serve to establish the local policies for the administration of public housing assistance. These plans are usually updated annually and these documents are often quite long and can range anywhere from fifty to five hundred pages in length. For an example of what to watch out for in these policies, see Part II of this briefing. ↩
As discussed in Part I and the 2018 Prison Policy Initiative report, Nowhere to Go: Homelessness among formerly incarcerated people, formerly incarcerated people are almost 10 times more likely to be homeless than the general public, and people who have been incarcerated multiple times are twice as likely to be homeless as those who are returning from their first prison term. ↩
In 2021, House of Representatives Delegate for Washington, D.C. Eleanor Holmes Norton introduced H.R.3212 to remedy this discrepancy between state and federal marijuana laws: “This bill specifies that (1) an individual may not be denied occupancy of federally assisted housing on the basis of using marijuana in compliance with state law, and (2) the Department of Housing and Urban Development may not prohibit or discourage the use of marijuana in federally assisted housing if such use is in compliance with state law.” (As of January 2023, there has been no movement with this bill since it was introduced in May 2021). ↩
The distinction between “violent” and other crime types is a dubious and subjective one; what constitutes a “violent crime” varies from state to state and from policy to policy, and acts that are considered “violent crimes” do not always involve physical harm. The Justice Policy Institute explains many of these inconsistencies, and why they matter, in its comprehensive and relevant report, Defining Violence. ↩
This statistic is based on re-arrest, which, as a measure, casts the widest net — and therefore estimates the highest rates of recidivism — but does not actually reflect anything about actual guilt or convictions. (For more information on recidivism and “violent” offenses, see our 2020 report, Reforms without Results.) ↩
With stable housing, people’s capacity to seek out regular healthcare, employment opportunities, and community support expands significantly. With a serious shortage of supportive sober or harm reduction housing options in the U.S., many formerly incarcerated people and many people who use drugs may not have access to stable, affordable housing. ↩
For a detailed discussion of how arrests are misused by non-criminal justice authorities to make decisions (such as those made by public housing authorities discussed here), see “Arrests as Regulation,” (Jain, 2015). ↩
Even in instances where PHAs offer remote informal hearings, this can still create a burden to the family for the same reasons, but in addition, low-income families may lack ready access to computers and other necessary technology. ↩


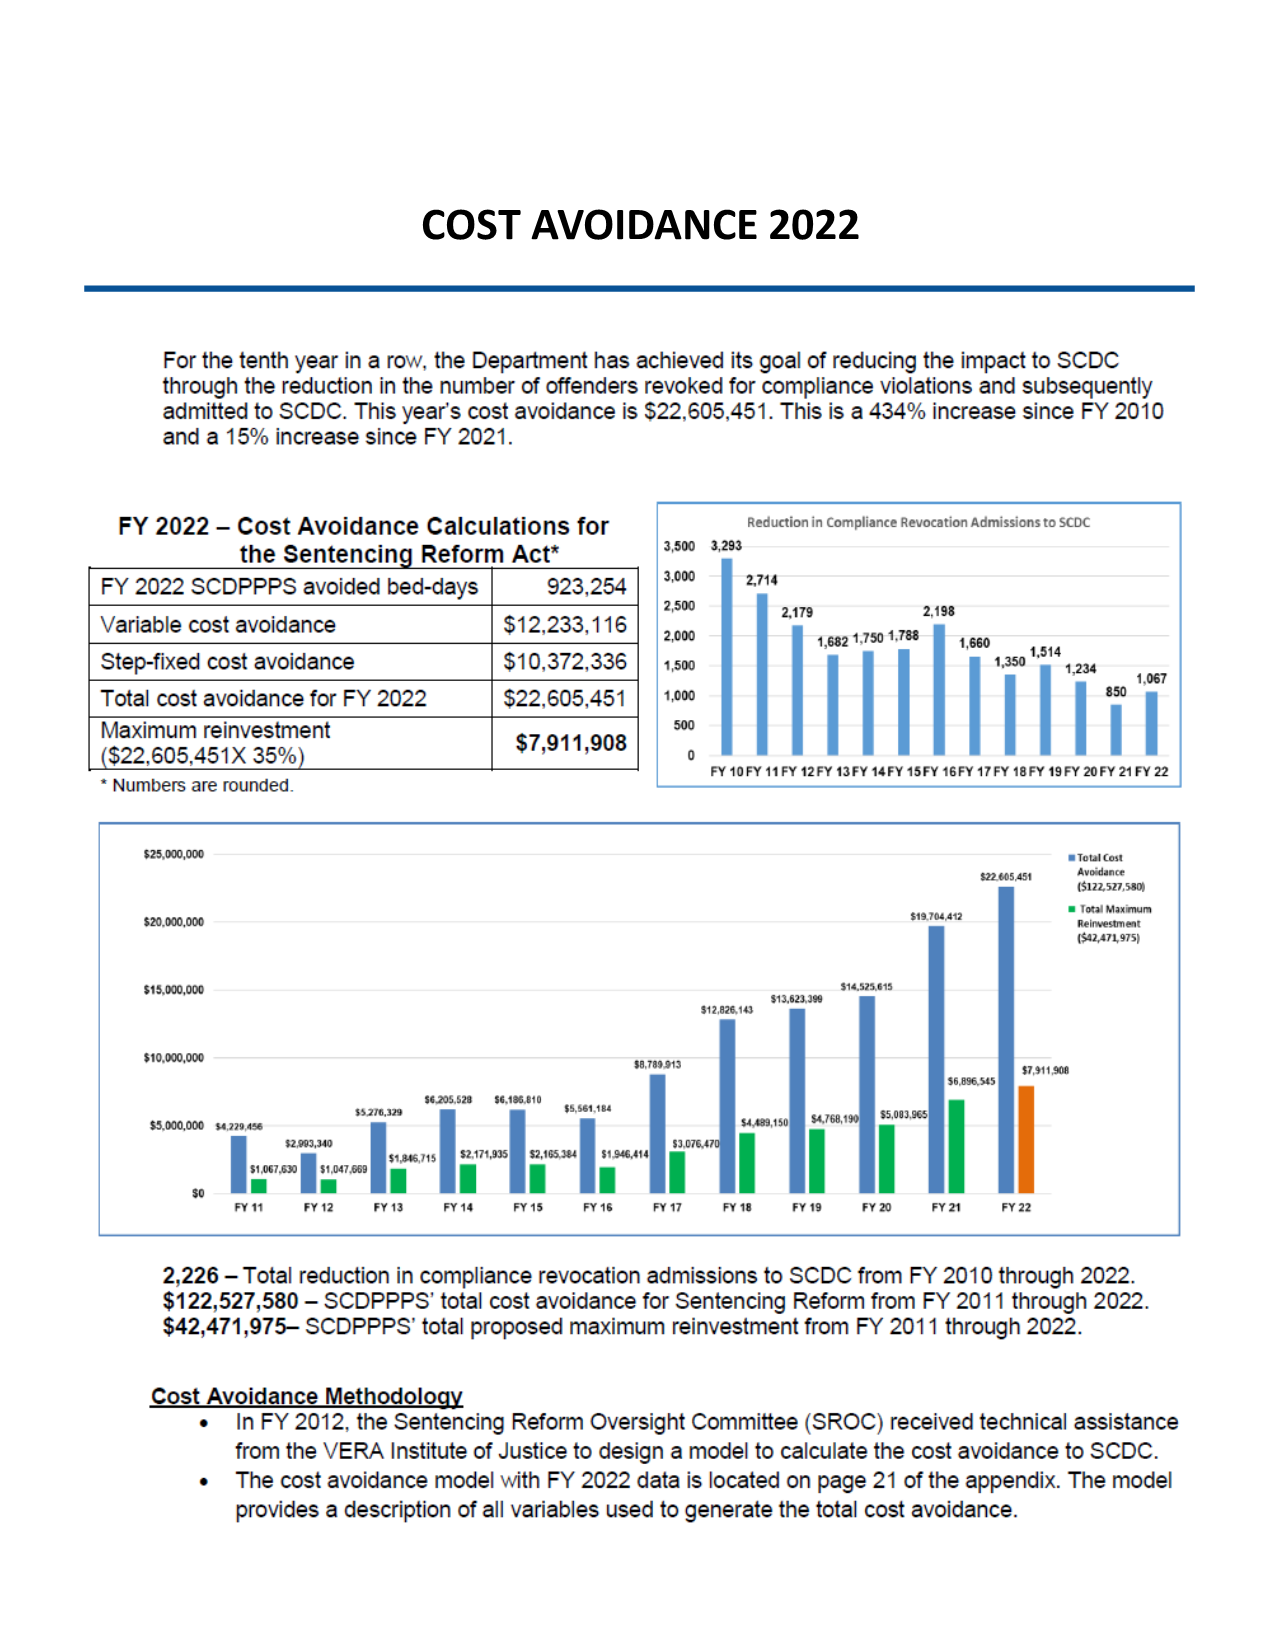