HELP US END MASS INCARCERATION The Prison Policy Initiative uses research, advocacy, and organizing to dismantle mass incarceration. We’ve been in this movement for 22 years, thanks to individual donors like you.

Can you help us sustain this work?

Thank you,
Peter Wagner, Executive Director
Donate

Uncategorized archives

Without consistent access to relief or safer environments, incarcerated people are punished with deadly heat, increased biological threats, and flimsy emergency protocols. We explain new epidemiological evidence confirming that heat and death are linked in prisons nationwide, and explain why the climate-change-induced plight of people in prisons deserves swift action.

by Leah Wang, July 19, 2023

Heatwaves and extreme weather events are now commonplace. States across the South and Southwest are experiencing record high temperatures (during the day and at night, which is a big deal). Meanwhile, the Northeast has been drenched in more frequent, torrential rainfall and flash flooding. Prisons and jails nationwide aren’t insulated from these events, yet we rarely see how bad the conditions are for the millions of people locked within them.

Hopefully, readers have seen our prior work — or any of several other powerful essays — explaining the ways in which extreme heat, combined with a lack of air-conditioned spaces and cooling measures, is especially harmful to people behind bars. Some have described the experience as being trapped in heat-retaining “convection ovens.”1 We’ve also highlighted some of the environmentally disastrous ways prisons are sited and operated.

bar chart showing that suicide, heart disease, and overall deaths increase when summer temperatures are hotter than average, and increase even more after a three-day heatwave

In this briefing, we present new findings from a nationwide, epidemiological study showing a strong relationship between extreme heat and deaths in prisons — especially in the Northeast. We also explain why extreme heat isn’t an isolated danger — it’s wrapped up in other hazards like pests and diseases guaranteed to make prison life miserable, if not fatal.


New research confirms what we already know: Extreme heat and deaths are linked in prisons nationwide

A group of researchers, led by epidemiologist Julianne Skarha, offer new evidence that the heat we’ve been experiencing is particularly deadly for incarcerated people across the U.S.2 Using two datasets — annual deaths in state prisons from the Bureau of Justice Statistics, and hourly temperature data from the North American Land Data Assimilation System — the researchers looked at unusually high temperatures occurring in the summer months at the geographic location of prisons.3

Using established public health research methods, the study’s authors were able to look at exposure to a “risk” or an event — in this case, hotter-than-average days or multi-day heatwaves,4 and observe an acute outcome — deaths in state prisons (categorized as suicide, heart disease, or death from any cause). They examined deaths that occurred up to three days after each heat event.

As expected, unusual heat was associated with higher overall mortality. The researchers found for every 10 degree increase above the prison location’s mean summer temperature, nearly 5% of deaths (from all causes) occurring there could be attributed to the heat. Even the days following a hotter-than-average day were associated with deaths, although the risk of heat-related death declined, suggesting that mitigating heat right away is crucial.

Further, an extreme heat day (one that falls within the hottest 10% of days for a particular location) was associated with a 3.5% increase in deaths. These extremely hot days had a delayed effect on suicides, which increased by 23% over the three days that followed. As if prison environments weren’t already damaging enough to mental health, the oppressive heat and a prison’s failure to provide relief from it can drive someone into unbearable distress.

Two- and three-day heatwaves (defined as consecutive days of extreme heat) were even more dangerous, increasing deaths by 5.5% and 7.4%, respectively. There were similar trends with deaths from suicide and heart disease, but they were not statistically significant.

map showing that a two-day heatwave increased deaths in state prisons by 21% in the Northeast, 8.6% in the West, 1.3% in the South, and 0.8% in the Midwest

The study’s authors also found that the impact of heat on mortality was highest in the Northeast region, 5 which tracks with evidence suggesting heat-acclimated populations might fare better in a hotter world. So even though states like Texas are rightfully scorned for failing to provide livable environments for people in prisons,6 more temperate states (like those in New England) aren’t off the hook either.

The results, as terrible as they are, likely underestimate the deadly effect of heat in prisons without A/C, as air conditioning data were not available for this analysis. The researchers also noted that they didn’t have data on the type of housing individuals were held in before they died, such as a solitary confinement cell.7 Despite these limitations, Skarha et al. offer the first nationwide, peer-reviewed publication showing that prisons, which are deadly places already, are heating people to death.


Prisons fail to provide desperately needed relief from heat and other emergencies

As we mentioned in our 2019 investigation, air conditioning is not a universal feature of prison buildings in famously hot states, even though it is nearly ubiquitous in homes across the South.8 Short of prison A/C — which states will spend more money fighting through lawsuits than they would installing — incarcerated people are seldom provided other forms of temporary relief. A survey conducted in California prisons by the Ella Baker Center found that most respondents didn’t have access to more water or showers on particularly hot days. Meanwhile, 62% of respondents reported experiencing heat exhaustion and 41% reported heat cramps due to extreme heat and/or nearby wildfires. Two-thirds (67%) of respondents said they were worried or extremely worried about their physical safety in the case of extreme heat at their prison.

And even though judges in multiple states have ruled that subjecting incarcerated people to extreme temperatures is unconstitutional, they haven’t mandated any relief measures. Public opposition to providing “comfortable” carceral spaces has further compelled prison officials to do nothing about this life-or-death issue.

screenshot of a federal prison's commissary price list showing that a fan costs $30.70

It would take more than a week’s worth of earnings at a federal prison in Texas for most people to afford this electric fan.

Even the mild relief of a fan or a towel can be hard to come by in prisons. These items might be available, though unaffordable, through a commissary: In one federal prison, where most people make less than $0.50 per hour, a fan costs $30.70. And in Oregon, where a heat wave brought 100-plus degree days in 2021, one prison offered special “cooling” towels for $18 — a nearly 100% markup.

Aside from placing the burden on incarcerated people to gather these threadbare comforts, prisons are largely unprepared to respond to facility-wide emergencies and disasters. There is no national mandate for correctional facilities to form emergency preparedness plans, to have evacuation drills, or to train staff on emergency protocols.9 The same Ella Baker Center survey found that the vast majority of incarcerated respondents did not know of any plan describing their prison’s emergency procedures for extreme heat (72% were not aware), extreme cold (88%), wildfires (88%), or flooding (92%).


Extreme weather is intertwined with other biological and social threats, leaving people in prisons highly vulnerable

As we and others have been saying for years, increasing heat is especially dangerous for people in prisons. But the heat itself is not the only issue. What other aspects of the prison environment will worsen as the climate changes?

Mosquito infestation

Mounting heat and humidity will lead to changes in pest populations nationwide, and incarcerated people will only fare as well as state mitigation strategies will allow. In Utah, for example, where a brand new prison recently opened near the wetlands of the Great Salt Lake, mosquito populations are thriving in ideal conditions. Despite great concern about this decidedly bad location, the mosquito problem at Utah State Prison has gotten so bad that prison officials have been scrambling for solutions.10

Utah prison officials’ ill-conceived responses include selling insect repellent in the prison commissary (instead of providing it for free) and training staff to use pesticides to kill mosquitoes, leading to unintended consequences for other parts of the sensitive ecosystem. Such consequences are also borne by the thousands of people who live and work in the area.11 Seeing as biological diversity is our best defense against climate change, it’s devastating to see how the new Utah prison is proceeding to destroy such an important, fragile place, while putting its incarcerated population at risk of mosquito-borne illness, flooding, and contaminated water.

Infectious diseases

As we detailed in our comprehensive report about the health of incarcerated people, and over three years of COVID-19 reporting, infectious diseases disproportionately impact those in prisons, where modern medicine and public health directives go ignored.

The number of infectious disease outbreaks (by growing populations of mosquitoes and ticks, for example) has risen along with average global temperatures. There is some emerging evidence, for example, that climate change is contributing to a rise in Valley Fever, a deadly fungal infection that has plagued people imprisoned in the Southwest for years. Based on decades of evidence, prisons and jails aren’t likely to be prepared for the increasing threats of bacterial, viral, and fungal infections.

Violence

As the weather warms, prisons will demonstrate the well-documented relationship between heat and violence. A July 2021 study found that unmitigated exposure to heat — even after accounting for dozens of other factors — increased violent events in Mississippi prisons. Aside from the physical harm of violence and the mental health damage caused by living in a violent place, the study’s authors predict that violence under “thermal stress” may perpetuate mass incarceration: People pushed to act violently in prison are more likely to have disciplinary infractions that delay their release, and the overall harsher prison conditions caused by heat may increase the odds of recidivism once released.12 Clearly, lawmakers should consider the immense social and financial benefits that a universal necessity like air conditioning could have in their state prisons.

Environmental emergencies are the norm in a climate-changed world. While we focused on heat-related dangers in this briefing, the kinds of failures we described are present in how prisons deal with other weather events as well: Floods, fires, hurricanes, cold snaps, and blizzards are all particularly threatening to the lives of incarcerated people. Deteriorating infrastructure and harmful policies around charging fees for medical care, privatizing care and commissary items, and failed emergency protocols are intensified by an increasingly volatile environment.

Even though incarcerated people regularly organize for their own survival needs, they face an especially daunting challenge building climate resilience. The deck that is stacked against them grows as our surroundings become more inhospitable. And the impacts of climate change on incarcerated populations will ripple out to surrounding communities, making this an issue we should all care about. Places of confinement and the people inside them must be part of any effort to reduce the harms of climate change. The status quo is nothing short of an overlooked crisis.


Footnotes

  1. Many people in prison are especially susceptible to heat-related illness, as they’re more likely than the general population to have certain health conditions or take medications that make them especially vulnerable to the heat.  ↩

  2. This study follows one published in late 2022 (for which Skarha is also the lead author) focused on Texas prisons, which are notorious for sweltering conditions. The 2022 study leverages the fact that air conditioning is provided in some Texas prisons, but not all. Those researchers found that some deaths could be attributed to heat in those prisons without A/C, whereas no deaths could be attributed to heat in climate-controlled prisons.  ↩

  3. The researchers note they were not able to complete their analysis for Alaska and Hawaii due to a lack of temperature data.  ↩

  4. The study’s authors used the mean summer temperature at each location for their analysis, and determined extreme heat events using a maximum temperature greater than the 90th percentile for the respective location over 1, 2, or 3 consecutive days. Under this definition of extreme heat, the cutoff point for some prison locations was quite mild, so the authors chose to exclude prisons in locations where the
    90th percentile was less than or equal to 77*F.
     ↩

  5. The researchers defined the Northeast region as Maine, New Hampshire, Vermont, Massachusetts, Connecticut, Rhode Island, New York, Pennsylvania, and New Jersey.  ↩

  6. On the other hand, since 1994, county jails in Texas are required to maintain internal temperatures between 65 and 85 degrees.  ↩

  7. However, the researchers did exclude deaths that occurred in 12 prison facilities across the U.S. that are specifically designated for medical treatment and operate similar to a hospital.  ↩

  8. According to the U.S. Energy Information Administration’s 2020 Residential Energy Consumption Survey, 94% of homes in the South (referring to Delaware, Maryland, Virginia, West Virginia, Kentucky, North Carolina, South Carolina, Tennessee, Georgia, Florida, Alabama, Mississippi, Arkansas, Louisiana, Texas, and Oklahoma plus Washington, D.C.) used air conditioning.  ↩

  9. According to Melissa Savilonis, who wrote a 2013 doctoral thesis on emergency planning in correctional facilities, prisons are entirely left out of emergency preparedness activities, even though the federal government “places emergency management at the forefront of government priorities.” The Stafford Act, which is the major federal law authorizing federal dollars for emergency disaster relief to state and local governments, and the Post Katrina Emergency Management Reform Act, which was intended to address the failure to adequately respond to communities impacted by Hurricane Katrina, are both silent on incarcerated populations and/or correctional facilities. The Stafford Act does mention pets as a vulnerable population, however.  ↩

  10. Overall, climate change is predicted to have a negative impact on biological diversity — in other words, many insects and other species will die off. But this doesn’t mean living blissfully free from bug bites: We’ll be losing insects that are critical to healthy, functioning ecosystems, as well as our global food supply. Yet some insect populations, like mosquitoes and ticks, are predicted to grow alongside changing conditions and decreasing populations of natural predators.  ↩

  11. Unfortunately, harmful chemical agents are overused and weaponized in the confined spaces of prisons and jails. Earlier this year, several people sued an ICE detention facility in Adelanto, Calif., claiming staff indiscriminately sprayed HDQ Neutral, a corrosive cleaning chemical, throughout the building. Ingesting the chemical led to rashes, respiratory issues, and headaches. And correctional officers regularly use chemicals like tear gas and pepper spray to incapacitate people, instead of using de-escalation techniques or trained mental health professionals.
    At the same time, corrections officials are quick to divert attention away from these harmful activities and claim that incarcerated people are the ones misusing chemicals. In one case, a Florida sheriff claimed the people in his jail were using roach spray to get high. Claims like this are often overblown and weaponized to restrict services, programs, and privileges, given the reality that actual drugs are fairly easy to obtain while behind bars (through staff, often).
     ↩

  12. Of course, violence in prisons during hot weather would only mirror increases in violence (and other behaviors considered crimes) outside of prisons. These increases will also fuel mass incarceration through more arrests, more jail admissions, and more people sentenced to prison.  ↩

See the footnotes


Report shows every community is harmed by mass incarceration

July 13, 2023

Today the Voice of the Experienced (VOTE), the Redistricting Data Hub, and the Prison Policy Initiative released a new report, Where people in prison come from: The geography of mass incarceration in Louisiana, that provides an in-depth look at where people incarcerated by the state’s Department of Public Safety & Corrections (DPS&C) come from. The report also provides nineteen detailed data tables — including neighborhood-specific data for New Orleans, Baton Rouge, Shreveport, and Jefferson Parish — that serve as a foundation for advocates, organizers, policymakers, data journalists, academics, and others to analyze how incarceration relates to other factors of community well-being.

The report shows:

  • Every single parish — and every state legislative district — is missing a portion of its population to incarceration in state prison.
  • While the state’s largest cities have the most people incarcerated, many of the state’s smallest communities have the highest imprisonment rates, including Bogalusa, which has an imprisonment rate of 1,661 per 100,000 residents in the custody of DPS&C. For comparison, Louisiana has an imprisonment rate of 451 per 100,000 residents.
  • There are dramatic differences in incarceration rates within communities. For example, in New Orleans, one of the most racially segregated cities in the nation, residents of B.W. Cooper are 47 times more likely to be imprisoned than residents of the neighboring Lakeview neighborhood.

Data tables included in the report provide residence information for people incarcerated by the Louisiana Department of Public Safety & Corrections in 2022, offering the clearest look ever at which communities are most impacted by mass incarceration. They break down the number of people locked up by parish, city, town, zip code, legislative district, census tract, and other areas.

The data show that the parishes with the highest state prison incarceration rates are Washington (901 per 100,000 residents), Franklin (788 per 100,000 residents), and Caddo (753 per 100,000 residents). For comparison, Ascension Parish has the lowest prison incarceration rate, at 195 people in state prison per 100,000 residents, four times lower than Washington Parish.

Map showing incarceration rates in Louisiana by census tract

“The nation’s 40-year failed experiment with mass incarceration harms each and every one of us. This analysis shows that while some communities are disproportionately impacted by this failed policy, nobody escapes the damage it causes,” said Emily Widra, Senior Research Analyst at the Prison Policy Initiative. “Our report is just the beginning. We’re making this data available so others can further examine how geographic incarceration trends correlate with other problems communities face.”

The report cites studies that show that incarceration rates correlate with a variety of negative outcomes, including higher rates of asthma, depression, lower standardized test scores, reduced life expectancy, and more. The data included in this report gives researchers the tools they need to understand better how these correlations play out in Louisiana.

“Louisiana has led the way on the use of incarceration as the solution to complicated social struggles, and this approach has specifically targeted Black communities since the beginning,” says Bruce Reilly, Deputy Director of VOTE. “This data illustrates the scope of mass incarceration, as every town and city feels the pain. Lawmakers have consistently chosen to fund the police and prison industry rather than invest in communities, as they routinely file more bills on criminal justice than any other issue area. We hope that continued education can put a stop to this trend that has spanned over two centuries.”

The report, which is part of a series of reports examining the geography of mass incarceration in America, is available at: https://www.prisonpolicy.org/origin/la/2022/report.html.


When these states, cities, and counties began releasing more people pretrial, there were no corresponding waves in crime.

by Sarah Staudt, July 6, 2023

Ending or limiting the use of monetary bail has become an increasingly common criminal legal system reform across the country. Reformers and researchers have long supported such measures, but opponents — including district attorneys, police departments, and the commercial bail industry — often claim pretrial reform puts community safety at risk. We put these claims to the test.

We found four states, as well as nine cities and counties, where data exist measuring public safety from before and after the adoption of pretrial reforms. All of these jurisdictions saw decreases or negligible increases in crime or re-arrest rates after implementing reforms.

Below, we describe the reforms implemented in each of these 13 jurisdictions, the effect these reforms had on the pretrial population (if available), and the effect on public safety. We find that whether the jurisdictions eliminated money bail for some or all charges, began using a validated risk assessment tool, introduced services to remind people of upcoming court dates, or implemented some combination of these policies, the results were the same: Releasing people pretrial did not negatively impact public safety.

About 83% of people held by jails are legally innocent and awaiting trial, often because they are too poor to make bail. The overall jail population hasn’t always been so heavily dominated by pretrial detainees. As we’ve previously reported, increased arrests and a growing reliance on money bail over the last three decades have contributed to a significant rise in pretrial detention. Any time spent in pretrial detention can increase rates of failure to appear in court and rates of re-arrest. And research shows that just a few days of pretrial detention can have detrimental effects on an individual’s employment, housing, financial stability, and family wellbeing.

In this analysis, public safety is measured through the narrow lens of crime rates. But pretrial reforms promote other types of safety that are more difficult to measure, such as the safety of individuals who can remain at home instead of in a jail cell, children who are able to stay in their parents’ care, and community members who are spared the health risks that come from jail churn. (Furthermore, research has found that pretrial detention actually increases the odds of a person being re-arrested in the future, which is clearly counterproductive from a crime rate-defined public safety standpoint.) Pretrial reform also alleviates jail overcrowding, and is a superior alternative to new jail construction for counties with overcrowded jails.

States and counties can and should build on these pretrial reforms. More progress can be made to continue reducing the number of people held pretrial, and address concerns such as racial bias inherent in pretrial risk assessment tools.1 But the data is clear: When it comes to public safety, these reforms are a step in the right direction.

State level reforms

  • New Jersey
    • Reform: In 2017, the New Jersey legislature passed a law implementing a risk-informed approach to pretrial release and virtually eliminated the use of cash bail.
    • Impact: The pretrial population decreased 50% from 2015 to 2018. Unfortunately, the pretrial population rebounded during the COVID-19 pandemic; rates of pretrial incarceration in 2023 are only 25% below what they were in 2015.
    • Public safety: Rates of violent crime fell between 2016-2018; homicides fell by 32% while rapes, robberies, assaults, burglaries, and thefts all fell by double-digit percentages. The percentage of people arrested for new crimes while awaiting trial changed by only 1 percentage point before and after reform, from 12.7% to 13.7%. In 2020, only 0.6% of people were re-arrested for a serious violent offense while awaiting trial.2

  • New Mexico
    • Reform: A 2016 voter-approved constitutional amendment prohibits judges from imposing bail amounts that people cannot afford, enables the release of many low-risk defendants without bond, and allows defendants to request relief from the requirement to post bond. (The Eighth Amendment already forbids excessive bail, but in practice, bail is regularly set at unaffordable levels in courts around the country.)
    • The impact of this reform on the jail population isn’t known.
    • Public safety: State-wide crime rates declined after the reforms took effect in mid-2017. Furthermore, the safety rate, or the number of people released pretrial who are not charged with committing a new crime, increased from 74% to 83.2% after the reforms took effect.

  • Kentucky
    • Reform: Kentucky began using a validated pretrial risk assessment tool in 2013. In 2017, the state began allowing release of low-risk defendants without seeing a judge. In addition, a statewide pretrial services agency is required to make a release recommendation within 24 hours of arrest, and reminds people of upcoming court dates via automated texts and calls.
    • Impact: Judges have released more people on their own recognizance since 2013.
    • Public safety: The new criminal activity rate, which measures the rate at which people commit new crimes while awaiting trial, remained consistent; there was a 1-2 percentage point increase in re-arrests for all charges, but no increase in the rate of new arrests for violent felonies.

  • New York
    • Reform: A law that went into effect on January 1, 2020 eliminated the use of money bail and pretrial detention for most misdemeanors and many nonviolent felony cases. Since 2020, there have been three waves of rollbacks to the law, in June 2020, May 2022, and June 2023, which have narrowed the impact of these reforms.
    • Impact: The pretrial population in New York City declined 40% from April 2019 to March 2020, directly after reforms were passed. Between January 2020 and January 2022, total jail populations fluctuated, but ultimately fell about 7%.
    • Public safety: The NYPD asserted in March 2020 that the original bail reform measures were a “significant reason” for increased arrests in six crime categories from February 2019 to February 2020. However, researchers from Human Rights Watch argued that the reforms had not been in place long enough to pinpoint them as the driving force behind a rise in crime. Unfortunately, misleading narratives about crime have continued to dominate news coverage about New York’s bail reform.

      However, a plethora of studies have shown that bail reform has had either a neutral or positive impact on public safety. They show:

      • People impacted by bail reform were no more likely to be re-arrested after reforms than they were before.
      • Bail reform has reduced re-arrest rates: prior to reforms, 50% of people were re-arrested in the two years following arraignment in court; after reform, 44% were re-arrested.
      • Between 2019 and 2020, violent crime rates rose around the country during the COVID-19 pandemic, just as New York began to implement its bail reforms. However, New York State’s violent crime rate rose by just 1% during this time, while violent crime nationally rose by 5%.

County and city level reforms

  • San Francisco, Calif.
    • Reform: Following collaboration between various judicial and public safety departments, the city has used a validated risk assessment tool since 2016. The San Francisco Pretrial Diversion Project also helps by offering alternatives to fines, dismissals of charges for “first time misdemeanor offenders” who complete treatment plans, and other forms of support for people navigating the system. In 2020, then-District Attorney Chesa Boudin announced his office would no longer ask for cash bail. After Boudin was recalled in 2022, his successor, Brooke Jenkins, revised the policy to reinstate the practice of asking for cash bail in some circumstances.
    • Impact: The San Francisco Pretrial Diversion Project reduced the jail population by 47%.
    • Public safety: Between 2019 and 2020, when cash bail was eliminated, San Francisco’s violent crime rate fell by over 15% while the national violent crime rate rose by 5%. The city’s new criminal activity rate, which measures the rate at which people commit new crimes while awaiting trial, is 10%. This puts it on par with Washington, D.C. which is often cited as a model of pretrial reform success.

  • Washington, D.C.
    • Reform: The District’s Pretrial Services Agency has used a risk assessment tool since the agency was created by Congress in 1967, but their reforms go much further: Judges cannot set money bail that results in someone’s pretrial detention, there are limits to the amount of time people can spend in jail after their arrest, and the Pretrial Services Agency can connect people to employment, housing, and general social services resources.
    • Impact: Over 90% of arrestees are released without a financial bond.
    • Public safety: In FY 2022, 93% of people were not re-arrested when released pretrial; in FY 2019, 99% were not re-arrested for a violent crime.

  • Philadelphia, Pa.
    • Reform: In 2018, the District Attorney’s office stopped seeking money bail for some misdemeanors and nonviolent felonies, which made up the majority of all cases.
    • Impact: Reforms led to an 11% increase in the number of people released on their own recognizance. Ninety percent of people charged with misdemeanors, and 32% of those charged with felonies, were released without having to post bail.
    • Public safety: Researchers found that the percentage of people re-arrested pretrial decreased slightly following reforms.

  • Santa Clara County, Calif.
    • Reform: Santa Clara courts began using a validated risk assessment in 2012, and their pretrial services agency sends court date reminders to those released pretrial. In addition, community organizations such as a churches partner with individuals to remind them of court dates, provide transportation, and offer other assistance.
    • Impact: The number of people released without cash bail increased 45% after the reforms.
    • Public safety: 99% of people released were not re-arrested.

  • Cook County, Ill.
    • Reform: As of 2017, as a result of a court rule, judges must consider what people can afford when setting bail amounts.
    • Impact: The pretrial population declined by about 16% between 2017 and 2022. The percentage of people released without cash bail has more than doubled, and the increase was most dramatic for Black people.
    • Public safety: In the year following the court rule, overall violent crime in Cook County dropped by more than 10%. There was no statistically significant change in the likelihood of re-arrest while awaiting trial or of re-arrest for a violent crime. Since 2017, 96.4% of people are not re-arrested for a violent crime while released pretrial.

  • Yakima County, Wash.
    • Reform: Yakima County began using a validated risk assessment tool in 2015, at the recommendation of local judicial and public safety stakeholders. The county also implemented a pretrial services program that offers services like helping people obtain mental health or drug treatment and sending automatic court date reminders.
    • Impact:Pretrial release rates increased from 53% to 73% after reforms were implemented.
    • Public safety: After reforms, the rate of re-arrest increased by only 2 percentage points, from 16% to 18%.

  • New Orleans, La.
    • Reform: A 2017 ordinance passed by the city council virtually eliminated money bail for people arrested on municipal offenses. Since then, the city has implemented a risk assessment tool and releases some low-risk arrestees without bail.
    • Impact: There was a 337% increase in the number of arrestees released without bail from 2009 to 2019 (1.9% to 8.3%).
    • Public safety: Only 3.1% of people were re-arrested in a pilot program that released low-risk accused people without bond.

  • Harris County, Texas
    • Reform: Since 2019, the majority of misdemeanor defendants automatically qualify for jail release on no-cash bonds.
    • Impact: After reforms in 2017, the pretrial release rate jumped from 60% to 87%.
    • Public safety: Re-arrest rates decreased slightly, from 23% to 21%.

  • Jefferson County, Colo.
    • Reform: Following a pretrial reform pilot study, Jefferson County eliminated its money bail schedule and began using a risk assessment tool in 2010.
    • The impact of this reform on the jail population isn’t known.
    • Public safety: People released without money bail were slightly less likely to have a new arrest or filing than those released on money bail.

This is an update of our 2020 briefing of the same name, which was authored by Tiana Herring.

For more information on pretrial detention, see our reports on jail growth and the ways money bail perpetuates cycles of poverty.


Footnotes

  1. Risk assessment tools base their results on existing criminal justice data, which in turn reflect years of biased policing and racial disparities. And ultimately, final decisions over detainment or release are made by people, who are subject to bias. Thus, while risk assessment tools give the impression of fairness, how fair they are in practice depends on the historical data they are based on, as well as the individual using the tools.  ↩

  2. It’s important to note that different jurisdictions have different definitions of what qualifies as a “violent” or “serious” crime, which may partially account for differences in re-arrest rates for “violent” crimes in different states.  ↩


Carveouts dramatically lessen the impact of criminal legal system reforms. In a new tool for advocates, we offer ways to resist carveouts when new reforms are proposed.

by Wanda Bertram, June 26, 2023

Today, the Prison Policy Initiative released its latest resource for advocates fighting for impactful reforms that shrink the footprint of the criminal legal system: a guide to avoiding harmful “carveouts” that appear in many reform bills. Carveouts are clauses that serve to exclude large categories of people — often the majority of those who stand to benefit — from reform, by reserving policy changes for people convicted of “nonviolent, non-sexual, and non-serious” offenses.

As our new guide explains, almost all major criminal legal system reforms in the last 20 years have excluded people charged with or convicted of violent or sex-related offenses. Many of these carveouts have been particularly unnecessary because they applied to programs already controlled by prosecutors, ironically limiting prosecutors’ discretion around things like diversion programs. The result has been to limit the impact of reform and further entrench mass incarceration.

graphic showing that reforms have largely excluded people classified as 'violent,' limiting the impact of reform

Our guide walks through common arguments in favor of excluding all but the “non, non, nons” from reform, offering counterarguments for advocates to respond with. Arguments (and responses) we discuss include:

  • “We have to start with reforms to nonviolent charges, and we’ll ‘come back’ for more serious charges later.” In fact, as we explain, decades of legislation with carveouts has not led to a wave of legislation “coming back” to address the majority of people in prison. Rather, carveouts make later reform harder by reinforcing the flawed logic of mass incarceration.
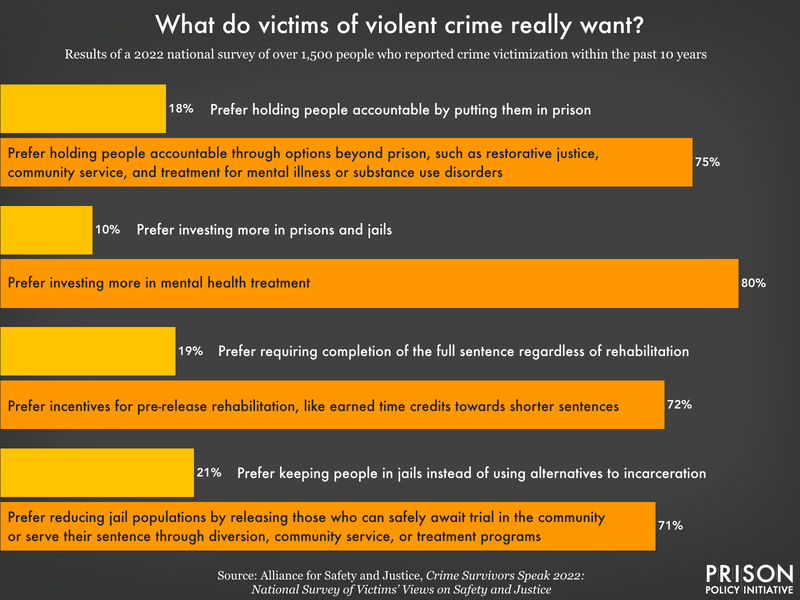
  • “Victims of violent crime want people with violent charges excluded from reform.” Data show that the reverse is true: Victims of violent crime are more interested in alternatives to incarceration than in keeping people locked up.
  • “Including people charged with violent offenses in reform will harm public safety.” In reality, re-arrest rates are lowest among people convicted of violent offenses, and research shows that only a tiny fraction of people convicted of serious violent offenses who are released from prison later come back to prison for another violent offense.
  • “People convicted of violent offenses don’t deserve mercy or reform.” This argument assumes that everyone convicted of a serious offense is the same, painting with an extremely broad brush. Even when the crime someone was convicted for was undeniably violent or serious, categorically excluding people from reforms ignores the immense change people can undergo following the worst thing they have ever done.

Recognizing that what counts as a “serious” offense is always changing, our guide includes a section on fentanyl carveouts, which in recent years have excluded people using or selling fentanyl from drug law reforms. For advocates in states where legislatures are considering these carveouts, we lay out a few reasons why they are an ineffective and unjust policy.

This is the newest addition to our Advocacy Toolkit, which shares resources, tips, and best practices we’ve picked up through our work to end mass incarceration. The Toolkit’s other resources include a guide to filing public records requests, a guide to sources of data about the criminal legal system, and resources for fighting jail expansion.

Our new guide is here: https://www.prisonpolicy.org/trainings/carveouts.html

Have questions? Contact our Policy and Advocacy Manager, Sarah Staudt, at sstaudt@prisonpolicy.org.


Building on data from the Prison Journalism Project, we find that most states enforce restrictions that make practicing journalism extremely difficult and sometimes risky.

by Brian Nam-Sonenstein, June 15, 2023

Last month, New York prison officials introduced a policy to effectively suppress prison journalism. It went unnoticed for a few weeks until reporters at New York Focus caught wind of it. A righteous backlash ensued, forcing the department to rescind the policy for the time being.

The incident left many people wondering: how common are restrictions on prison journalism? Building on data compiled by the Prison Journalism Project, we scoured handbooks, prison policies, and laws governing every corrections department in the U.S. to try and find out.

We found that while explicit bans on prison journalism are rare, a web of complex and vague policies make the practice extremely difficult and sometimes risky.


Table 1: Restrictions on journalism in prisons.
Explicit ban on journalism Total ban on business and compensation Partial ban on business and compensation Censored correspondence with news media Privileged correspondence with news media Links
Federal Bureau of Prisons X X https://www.govinfo.gov/content/pkg/CFR-2012-title28-vol2/pdf/CFR-2012-title28-vol2-sec540-20.pdf

https://www.law.cornell.edu/cfr/text/28/540.14

Alabama X http://www.doc.state.al.us/docs/AdminRegs/AR439.pdf
Alaska X X https://www.law.cornell.edu/regulations/alaska/22-AAC-05.525

https://www.law.cornell.edu/regulations/alaska/22-AAC-05.130

https://doc.alaska.gov/pnp/pdf/808.02.pdf

Arizona X https://corrections.az.gov/sites/default/files/documents/policies/900/0914.pdf
Arkansas X https://doc.arkansas.gov/wp-content/uploads/2022/10/Arkansas-Division-of-Correction-Inmate-Handbook-Revised-November-1-2022-Director-approved.pdf
California X https://www.cdcr.ca.gov/regulations/wp-content/uploads/sites/171/2023/05/2023-DOM.pdf
Colorado X X https://drive.google.com/file/d/1pc4XM1kBW0O40qjXmUZiQx2oAo3FwSoO/view

https://drive.google.com/file/d/1shc0GUkN0AxtkhVytDw-fOrA0a3XaC7H/view

Connecticut X https://portal.ct.gov/-/media/DOC/Pdf/Ad/ad1007pdf.pdf
Delaware X https://doc.delaware.gov/assets/documents/policies/policy_4-0.pdf
Florida X X https://www.flrules.org/gateway/RuleNo.asp?ID=33-602.207
Georgia X X https://rules.sos.ga.gov/GAC/125-3-5-.05?urlRedirected=yes&data=admin&lookingfor=125-3-5-.05

https://rules.sos.ga.gov/GAC/125-3-3-.03

Hawaii X https://dps.hawaii.gov/wp-content/uploads/2012/10/COR.15.02.pdf
Idaho X http://forms.idoc.idaho.gov/WebLink/0/edoc/283201/Mail%20Handling%20in%20Correctional%20Facilities.pdf
Illinois X X https://www.ilga.gov/legislation/ilcs/ilcs4.asp?DocName=073000050HCh%2E+III+Art%2E+7&ActID=1999&ChapterID=55&SeqStart=11600000&SeqEnd=12800000

https://casetext.com/regulation/illinois-administrative-code/title-20-corrections-criminal-justice-and-law-enforcement/part-445-committed-persons-business-ventures/section-44520-manuscripts

Indiana X X https://www.in.gov/idoc/files/02-01-101-Off.-Personal-Property-9-1-2021.pdf

https://www.in.gov/idoc/files/02-01-103-Correspondence-8-15-2022.pdf

https://www.in.gov/idoc/files/02-01-116_Offender_Business_Activities_5-16-06.pdf

Iowa X X https://www.legis.iowa.gov/docs/iac/agency/08-01-2018.201.pdf
Kansas X X https://www.law.cornell.edu/regulations/kansas/K-A-R-44-1-102

https://www.law.cornell.edu/regulations/kansas/K-A-R-44-7-108

Kentucky X https://corrections.ky.gov/About/cpp/Documents/16/CPP%2016.2%20-%208-11-21.pdf
Louisiana X https://www.doa.la.gov/media/4eufbn5k/22v01-15.pdf
Maine X X https://www.maine.gov/corrections/sites/maine.gov.corrections/files/inline-files/Adopted%20Rule%20DETENTION%20AND%20CORRECTIONAL%20STANDARDS%20FOR%20MAINE%20COUNTIES%20AND%20MUNICIPALITIES_3.pdf

https://www.maine.gov/corrections/sites/maine.gov.corrections/files/inline-files/39212241_0.pdf

Maryland X https://www.law.cornell.edu/regulations/maryland/title-12/subtitle-02/chapter-12.02.20
Massachusetts X X https://www.mass.gov/doc/cmr-131-news-media-relations/download

https://www.mass.gov/doc/cmr-464-work-release/download

Michigan X X https://www.michigan.gov/corrections/-/media/Project/Websites/corrections/Files/Policy-Directives/PDs-05-Institutional-Placement-and-Programs/PD-0503-Programs-and-Leisure-Time-Activities/05-03-118-Prisoner-Mail-effective-03-01-18.pdf?rev=df5171ef6b6b4039981fc9636f618c6d
Minnesota X X https://policy.doc.mn.gov/DOCPolicy/
Mississippi X https://www.mdoc.ms.gov/sites/default/files/Misc/Inmate%20Handbook%202023_0.pdf
Missouri X X https://doc.mo.gov/sites/doc/files/media/pdf/2019/04/Offender_Rulebook_REVISED_2019.pdf
Montana X X https://cor.mt.gov/DataStatsContractsPoliciesProcedures/Procedures/MSP-Procedures/3.3.4-Media-Access-to-Inmates.pdf

https://cor.mt.gov/DataStatsContractsPoliciesProcedures/Procedures/MSP-Procedures/3.3.6-Inmate-Mail.pdf

Nebraska X X https://www.corrections.nebraska.gov/sites/default/files/files/130/inmate_rule_book_0.pdf

https://www.corrections.nebraska.gov/system/files/rules_reg_files/205.01_2022_-_website.pdf

Nevada X X https://doc.nv.gov/uploadedFiles/docnvgov/content/About/Administrative_Regulations/AR 750 – 121713.pdf

https://doc.nv.gov/uploadedFiles/docnvgov/content/About/Administrative_Regulations/AR 722 Inmate Legal Access Final 11-15-16.pdf

New Hampshire X X https://www.nh.gov/nhdoc/policies/documents/cor-314-resident-mail.pdf
New Jersey X X https://casetext.com/regulation/new-jersey-administrative-code/title-10a-corrections/chapter-4-inmate-discipline/subchapter-4-inmate-prohibited-acts/section-10a4-41-prohibited-acts
New Mexico X X https://www.cd.nm.gov/wp-content/uploads/2023/12/CD-090100.pdf

https://www.cd.nm.gov/wp-content/uploads/2023/12/CD-151200-1.pdf

New York X X https://govt.westlaw.com/nycrr/Document/I4ef2a6a9cd1711dda432a117e6e0f345?viewType=FullText&originationContext=documenttoc&transitionType=CategoryPageItem&contextData=(sc.Default)

https://govt.westlaw.com/nycrr/Document/I4ef2a691cd1711dda432a117e6e0f345?viewType=FullText&originationContext=documenttoc&transitionType=CategoryPageItem&contextData=(sc.Default)

North Carolina X X https://public.powerdms.com/NCDAC/tree/documents/2045236

https://public.powerdms.com/NCDAC/tree/documents/2045023

North Dakota X X https://www.docr.nd.gov/sites/www/files/documents/friends_family/Facility_Handbook.pdf
Ohio X X https://codes.ohio.gov/ohio-administrative-code/rule-5120-9-17

https://codes.ohio.gov/ohio-administrative-code/rule-5120-9-06

https://codes.ohio.gov/ohio-administrative-code/rule-5120-3-04

Oklahoma X X https://oklahoma.gov/content/dam/ok/en/doc/documents/policy/section-03/op030117.pdf
Oregon X X https://oregon.public.law/rules/oar_291-119-0015

https://secure.sos.state.or.us/oard/viewSingleRule.action?ruleVrsnRsn=41402

https://secure.sos.state.or.us/oard/viewSingleRule.action?ruleVrsnRsn=281238

Pennsylvania X https://www.cor.pa.gov/About%20Us/Documents/DOC%20Policies/803%20Inmate%20Mail%20and%20Incoming%20Publications.pdf

https://www.cor.pa.gov/About%20Us/Documents/DOC%20Policies/009%20News%20Media%20Relations.pdf

Rhode Island X https://doc.ri.gov/news-info/inmate-life.php
South Carolina X X https://doc-dev.sc.gov/sites/doc/files/Documents/policy/PS-10-08.pdf
South Dakota X X https://doc.sd.gov/documents/1.5.D.3Offender Correspondence and Attachments (11.01.2022) REV 05.10.23.pdf

https://doc.sd.gov/documents/Inmate%20Living%20Guide4232021.pdf

Tennessee X https://www.tn.gov/content/dam/tn/correction/documents/103-04.pdf

https://www.tn.gov/content/dam/tn/correction/documents/507-02.pdf

Texas X X https://www.tdcj.texas.gov/documents/policy/BP0391.pdf

https://www.tdcj.texas.gov/documents/cid/Disciplinary_Rules_and_Procedures_for_Offenders_English.pdf

Utah X X https://public.powerdms.com/UtahDOC/tree/documents/1760258

https://public.powerdms.com/UtahDOC/tree/documents/2060763

Vermont X https://outside.vermont.gov/dept/DOC/Policies/Media%20Access%20Directive.pdf
Virginia X X https://vadoc.virginia.gov/files/operating-procedures/020/vadoc-op-022-1.pdf

https://vadoc.virginia.gov/files/operating-procedures/800/vadoc-op-803-1.pdf

Washington X X https://www.doc.wa.gov/information/policies/default.aspx
West Virginia X https://code.wvlegislature.gov/15A-4-7/
Wisconsin X X https://doc.wi.gov/DepartmentPoliciesDAI/3090052.pdf

https://doc.wi.gov/DepartmentPoliciesDAI/3090401.pdf

https://doc.wi.gov/DepartmentPoliciesDAI/3030004.pdf

https://doc.wi.gov/DepartmentPoliciesDAI/3000079.pdf

Wyoming X https://drive.google.com/file/d/1qOlxFgZYIY5N4pIarueO1HP1c9A04sCc/view
TOTALS 1 14 19 46 4


Chilling expression

Prisons don’t want you to know what happens inside. That’s what makes prison journalism so important. As more news outlets publish incarcerated journalists, more departments will consider policies to control what information makes it out into the world.

The Federal Bureau of Prisons is the only agency we found that explicitly forbids any incarcerated person from acting “as a reporter.” But they are not alone in suppressing prison journalism.

For starters, the standard prison practice of censoring and surveilling snail mail, electronic messages, phone calls, and video visits violates basic principles of free expression and privacy. These principles are central to a journalist’s ability to maintain sources, work closely with editors, and report the news without interference. Only 4 states — Arkansas, Georgia, Michigan, and Texas — treat correspondence with the news media as “privileged communication,” meaning that letters between an incarcerated person and a media outlet cannot be opened or read by prison staff (although they may be searched in the presence of the incarcerated person for contraband).

However, the other 46 states and the federal government maintain the right to read and censor communications with the media. These policies are broadly explained as important to maintaining “security and order” — a vague justification left to the discretion of prison officials.

Other aspects of prison life, such as an incarcerated person’s limited ability to maintain property1, can also conflict with the practice of journalism. Papers, notes, books, and other materials that can be important to reporting are vulnerable to confiscation and destruction by prison officials during cell searches and transfers. Additionally, a lack of access to the internet and heavily restricted use of tablets and computers can make researching, writing, and editing much more difficult for journalists on the inside.


Prohibitions on business and compensation

Fourteen states prohibit imprisoned people from operating or engaging in a business, including being self employed, and from receiving compensation for their work. Even if an incarcerated person were to produce journalism for free, vague restrictions on ‘business activities’ are enough to threaten their work with media outlets.

Prison journalism, free speech, and privacy rights

The Supreme Court’s view on the rights of prison journalists

Unfortunately, the speech and property rights of prison journalists are an open question.

The Supreme Court has largely blessed prison censorship in a pair of decisions known as Turner and Martinez. Turner applies to incoming communications, permitting prisons to censor mail from the outside so long as it is “reasonably related to legitimate penological interests.” Under the ruling in Martinez, outgoing mail can be censored if doing so “furthers an important or substantial government interest,” although it must be “no greater than is essential to the furtherance of that interest.” In both cases, that “interest” is determined through vague legal tests that, over time, have come to heavily favor prison administrators.2

When it comes to property, the Supreme Court has pretty clearly ruled that incarcerated people do not have a right to privacy. Prison officials are within their rights to destroy property so long as there is a “post deprivation remedy,” such as a procedure for incarcerated people to submit grievances.

It is perhaps most important to note that these protections can only really be enforced if they are brought to court. This is not a given. As we note in our report, “Slamming the Courthouse Door,” the Prison Litigation Reform Act makes it extremely difficult for lawsuits initiated by incarcerated people to ever reach court, and reduces their likelihood of success if they do. This arrangement deters people in prison from filing complaints in the first place. The law requires courts to dismiss civil rights cases from incarcerated people for minor technical reasons before even reaching the case merits, requires incarcerated people to pay filing fees that low-income people on the outside are exempt from, makes it hard to find representation by sharply capping attorney fees, creates high barriers to settlement, and weakens the ability of courts to order changes to prison and jail policies.

Whether an incarcerated person is the subject of, or a participant in, reporting, the risks they face can be serious: they can lose access to communications services and the commissary, they can be placed in solitary confinement, and they can lose good time credits that factor into their release.

Most incarcerated people are only allowed to work in jobs that support prison operations, prison-approved work release programs, or prison industries. But 19 states allow people to work with outside businesses and organizations if they receive approval from the prison. In some rare cases, they may receive compensation for written work3 or publish writing so long as it is not a regular column.4


Prison journalism is essential work

For as long as there have been prisons, the public has benefited greatly from the work of incarcerated journalists and sources. Much of what is known about incarceration comes from people who have been on the inside and have told their stories at great personal risk.

Incarcerated journalists still face discrimination and rejection from media outlets, but there are some signs of change. Over the last decade, a growing movement of incarcerated journalists — some working with organizations like the Prison Journalism Project and Empowerment Avenue, others with prison newspapers like the San Quentin News — have had their work published. This work is often used in countless investigations, lawsuits, policy reforms, and organizing efforts. This is great news for transparency, accountability, and change. Importantly, it also helps people build relationships and skill sets that can support them once they are released.

There are too many examples of excellent prison journalism to cite, but some examples include:


Conclusion

New York’s anti-journalism policy is gone for now, but may return in a different form in the future. In response to media requests, the department said it will “engage [interested] stakeholders to revise the policy in order to encourage creative art projects, as originally intended.”

In the meantime, it must be said that the benefits of prison journalism are profound and the risks are few, and mostly confined to the system itself. Other states are likely watching what has unfolded in New York, and so a rigorous defense of prison journalism is required. Protecting and expanding prison journalism requires special considerations for incarcerated media workers. It also merits a critical examination of ordinary policies that shape prison life.

Prison journalism affirms some of our most basic democratic principles — the exercise of speech free from government influence — and is an essential check on the extreme power these institutions wield over life and death. It’s also a potent reminder of the agency and desires of incarcerated people, which are so easily dismissed because they are often largely out of view.


Footnotes

  1. Most prisons have policies limiting the number and type of items an incarcerated person is allowed to keep. For example, according to policies set by the Bureau of Prisons, “Authorized personal property may be subject to numerical limitations” and, if a person is transferred, their property may be moved with them “at the discretion of the sending and receiving institutions’ Wardens.” Pennsylvania prison policies dictate that “limitations on the amount and variety of inmate property may be imposed for security,
    hygiene, and/or safety reasons.” In the event of a transfer, PADOC policy explains that “An inmate may not exceed the property limits established by the Department. Excess property, as determined by the Facility Manager/designee, may be shipped out at the inmate’s expense or destroyed.”
     ↩

  2. According to research by Emily Chiang, in the Turner case, “Justices Stevens, Brennan, Marshall, and Blackmun dissented, arguing that “if the standard can be satisfied by nothing more than a ‘logical connection’ between the [policy] and any legitimate penological concern perceived by a cautious [administrator,] it is virtually meaningless.” They cautioned that “[a]pplication of the standard would seem to permit disregard for inmates’ constitutional rights whenever the imagination of the [administrator] produce[d] a plausible security concern.”  ↩

  3. In Oregon, incarcerated people have an explicit right to publish, copyright, and be compensated for written work. However, “equipment, supplies, and other resources that are the property of the State of Oregon cannot be utilized in the production of items offered for sale or other disposition by the inmate.” A separate mail policy states that incarcerated people “shall not conduct business transactions by mail without the prior written consent of the functional unit manager or designee.”  ↩

  4. In Illinois, “a committed person may submit a manuscript for publication but shall not enter into contractual agreements with publishers for a regularly published column.”  ↩

See the footnotes


New research from the Atlanta Community Support Project finds 1 in 8 city jail bookings involve a person experiencing homelessness

by Luci Harrell and Brian Nam-Sonenstein, June 8, 2023

Poor people in the United States are a primary target for policing, especially those forced to live on the streets. But just how many people who are unhoused are caught up in the thousands of arrests made in cities each year? How many are criminalized for behaviors that stem directly from their extreme poverty? We combed through years of data from a variety of sources to answer these questions for the city of Atlanta.

Atlantans have long criticized their local governments’ reliance on policing over constructive community investments such as safe and affordable housing, medical and mental health care, food, employment, access to quality education, and accessible transportation. People who lack housing in Atlanta are punished for minor offenses that criminalize their survival. Missed court dates generate warrants for rearrest, and criminal records built through aggressive policing erect barriers to housing and employment, which in turn produce barriers to obtaining health care. The ensuing dynamic destabilizes access to what few community services are available. In the end, people who are unhoused are sucked into a gyre of poverty, arrest, and incarceration.

With the goal of informing interventions that will make such policing obsolete through support-oriented responses, the Atlanta Community Support Project (ACSP) set out to explore the scale and nature of policing for those battling homelessness at the city level. The following research represents the first stage of this project, in which we examined two years’ worth of Atlanta Department of Corrections’ daily jail logs to estimate just how disproportionately Atlanta’s unhoused residents are policed, especially for the “low-level,” quality-of-life violations that the Atlanta City Detention Center (ACDC) processes. Then, we matched local court records to a dataset of about 3,000 of these residents to better understand their interactions with the criminal legal system and the kind of access to support resources afforded to them. Using this dataset, we see that Atlanta’s unhoused population is among the most arrested in the city. For details about this study’s data sources, see the Methodology.

image showing homelessness rate of people arrested and the offenses diverted to by police to a diversion program

Most strikingly, we find that 1 in 8 Atlanta city jail bookings in 2022 — or 12.5% — were of people who were experiencing homelessness.1 That’s more than 30 times greater than the proportion of the city’s full population that is experiencing homelessness. The Atlanta Community Support Project’s analysis of our dataset of people who had recently faced homelessness also found that:

  • Policing further indebts the unhoused: 41% had outstanding fines and fees in Fulton County and/or Atlanta Municipal Court averaging $536.
  • Most people who are unhoused struggle to attend court hearings, often because they don’t even know about them: 86% of those who had been incarcerated at the city jail also had bench warrants for failure to appear in court.
  • People living unhoused and known to law enforcement were disproportionately Black, women, and/or transgender:
    • 78% were Black
    • 30% of those who had been recently incarcerated were women
    • Of those in the dataset who were able to self-report race and gender identity, 5.7% self-identified as trans, and 89% of trans individuals also identified as Black.2
  • Service providers don’t have the funding to reach enough people: Only 28% had received wraparound assistance as an alternative to incarceration through a local organization known as the Policing Alternatives & Diversion Initiative (PAD).


Who is most impacted by poverty policing?

As is the case with most other cities, the vast majority of arrests in Atlanta are for minor offenses committed by people with the fewest resources. The Atlanta Police Department (APD) reported arresting nearly 19,000 people in 2021, with approximately 3,000 people detained in the overcrowded Fulton County Jail on any given day. More than half of APD arrests between 2013 and 2021 were for “low-level offenses” most often classified as misdemeanors and exemplifying quality-of-life issues such as mental illness, substance use, homelessness, and/or sex work.

Meanwhile, nearly 1 in 5 Atlantans live in poverty. Last year, 18.5% of Atlanta residents were living in poverty and 2.2% of those living in poverty were experiencing homelessness.3 While gentrification created a steady rise in the city’s median household income, the poverty rate rose steadily alongside it, as did the housing crisis.

While we are considering the extent of the poverty crisis in Atlanta, it’s important to note that available data on homelessness does not capture the extent to which people are dealing with the broader issue of housing insecurity. These data do not account for people living in temporary housing, on the verge of losing their housing, or those living in inadequate conditions.4 That means the real level of precarity is far worse than reflected in available data on homelessness.

Nonetheless, the data show that Atlanta’s policing of homelessness is extensive and deeply concerning. As we mentioned, nearly 13% of all city jail bookings in 2022 were of people who reported or presented as experiencing homelessness even though the homeless population accounts for less than half of a percent (0.4%) of the total citywide population.

We also found that homelessness in Atlanta intersects with age, race, and gender in such a way that concentrates the impact of poverty policing among people who are already experiencing severe neglect and marginalization.

Older people are targeted as their homelessness rate rises

People over the age of 50 composed the largest age group in the Atlanta Community Support Project (ACSP) dataset of people who had recently faced homelessness. Ten percent of this group are or will be 62 years old or older in 2023. This is noteworthy because older adults are the fastest growing group of people experiencing homelessness nationwide.

Criminalizing the homeless elderly population produces significant collateral consequences, compounding health issues for people who are already at higher risk of illness, injury, and disease. Policing the elderly is also deeply disruptive to their receipt of services that can have the biggest impact on their survival, such as Social Security and Medicare benefits.

Black people are overrepresented among those living unhoused, arrested, and jailed in Atlanta

Black people are impoverished and policed at the highest rates throughout America, and that reality was apparent in our research on the city of Atlanta. Among those represented in the ACSP dataset, 78% were Black, compared to 48% of the total city population. The racial disparities are even more extreme among people arrested and jailed: Black people account for 90% of all arrests made by the Atlanta Police Department and more than 90% of the Fulton County Jail population.

Even when taking into account systemic failures to accurately record the ethnicity or race of those who are policed — especially individuals who report two or more races — Black people are disproportionately represented at every step of the criminal legal system.

On the streets, women and trans people are targeted for arrest

Women compose roughly 15% of jail populations nationwide,5 but in Atlanta, they account for nearly a third of those who are both criminalized and homeless: 30% of people in the ACSP dataset who had experienced both homelessness and local incarceration in the past two years identified as women.

As is true with data collection on race and ethnicity, gender identification in the ACSP dataset is imprecise because law enforcement routinely misgenders people. However, 512 people in the dataset self-reported their demographic information with the Policing Alternatives & Diversion Initiative; of these, 29 (5.7%) identified as transgender. These self-reported data also give us a partial view of the intersections of race and gender among people targeted for poverty policing in Atlanta: Of the 29 people in the dataset who self-identified as trans, 89% also self-identified as Black.


Punishing survival: Policing quality-of-life issues

Why this research focuses on the Atlanta City Detention Center

The notorious facility is not the only jail in the city, but it is ground zero for poverty arrests

For this briefing’s analysis of poverty arrests, the Atlanta Community Support Project focused on people arrested and processed at the Atlanta City Detention Center (ACDC).

Our focus on ACDC is intentional: Comparatively, ACDC is primarily used to process and/or detain individuals facing minor misdemeanor charges and city ordinance violations, while the larger county jail system is supposed to handle more serious state offenses, including felonies. People who are arrested and brought to ACDC are often facing city public order violations, such as public intoxication, camping, or urination, and traffic-related state offenses, such as driving with a suspended license or without insurance. The policing of such offenses is historically concentrated on Black and poor communities, including people who lack housing, which is reflected in the data on the city’s jail.

ACDC has long been the de facto facility for processing and incarcerating some of the city’s poorest residents. It was built just before the city hosted the 1996 Olympics and accompanied the passage of quality-of-life ordinances, including one banning “urban camping.” In anticipation of the games, the city cleared and renovated a local park where many people experiencing homelessness had encamped, locked many of them up, and quickly filled ACDC before and during the summer games. In 2003, the city transferred responsibility for people charged with higher level state offenses to county jails, leaving ACDC to handle lower-level offenses, largely related to quality-of-life (i.e., criminalization of the city’s poorest residents). From 2010 to 2018, ACDC also leased some bedspace to the federal government to detain immigrants. In 2019, community advocates, largely led by the Communities Over Cages campaign, successfully pushed the city council to close the facility, spurring the creation of the Reimagining ACDC Task Force. The task force’s Policy Workgroup provided recommendations including reclassifying many of the offenses for which people are brought to ACDC as civil infractions to drastically reduce the facility’s population for closure. Three years later, however, the county approved plans to lease some of ACDC’s bedspace to the Fulton County jail system as a supposed remedy to overcrowding, jeopardizing ACDC’s closure.

We did not include Fulton County data in our analysis, though it must be noted that the Fulton County Jail is part of the larger picture of criminalization and punishment in the city, and also jails people experiencing homelessness. Some people facing misdemeanors and what the local courts consider “diversion-eligible” offenses are held there. However, compared to ACDC, the county jail has a much larger population charged with a broader range of state offenses. According to a report to the Atlanta city council by the Jail Population Review Committee, 854 people experiencing homelessness were booked into the Fulton County Jail in 2022, accounting for just under 7% of that system’s bookings. The fact that people living unhoused made up a much smaller share of the county jail’s bookings than the ACDC bookings makes sense, given the city’s reliance on ACDC to process arrests for less serious and quality-of-life related offenses that target people in extreme poverty. Our study does not attempt to reconcile the data from Fulton County jail bookings with the data from ACDC because of the qualitative differences between the two populations and this study’s focus on poverty arrests in particular. However, if we combine all reported bookings of people experiencing homelessness in 2022 across both jail systems, we see that these individuals account for nearly 1 in 10 bookings (9.4%) citywide.6

The 2022 Jail Population Review Committee report provides some context for the findings of our study, insofar as it underscores the aggressive criminalization of people living in poverty. That report showed that people who are unhoused and were arrested for a “violent” offense made up just 1.8% of Fulton County’s total bookings in 2022 — and the number of such arrests had dropped by 23% since 2018. The large number of arrests of people without housing reflected in the ACDC jail logs seems particularly egregious given the minimal public safety threat this population appears to pose in the Fulton County Jail booking data.7

See the Methodology for details on the data used in this analysis.

Although a complete analysis of charge data for people who were unhoused when arrested and processed at the Atlanta City Detention Center (ACDC) was out of scope for this study, 2022 data from the Policing Alternatives & Diversion Initiative (PAD) give us a sense of how this population is routinely criminalized for minor offenses, many of which amount to basic survival, having nowhere to go, and asking others for help.8 In fact, 99.6% of all law enforcement assisted diversions to PAD involved offenses that would have been considered misdemeanors if charged. In 2022, referrals made by law enforcement to PAD for diversion9 were most frequently related to allegations of:

  • Trespassing (37%)
  • Panhandling or soliciting (12%)
  • Theft or shoplifting (10%)
  • Public drinking (9%)
  • Disorderly conduct (7%)
  • Pedestrian violations (7%)
  • Urban camping or loitering (6%)
  • Indecency (5%)

Despite the high level of need, the frequency of police contact in response to these minor violations, and the efforts of the city to divert more people away from arrest, our analysis of ACDC bookings shows that poverty arrests are still all too common. Only 28% of people in the ACSP dataset — all of whom have likely been eligible for diversion — have actually received assistance from PAD. Greater interventions are needed to meet the level of need. PAD’s monthly report for April 2023 shows immense gaps between the number of diversion-eligible arrests and pre-arrest diversions. For example, APD Zone 2 — which includes some of the city’s wealthiest and whitest neighborhoods — saw 105 arrests that were eligible for diversion that month, but only one pre-arrest diversion took place. Trespassing and panhandling made up the majority of charges at the time of diversion, and housing and food were the services most often provided.

It’s worth noting that, nationally, public order offenses account for over half of all rearrests, which is to say that people are repeatedly arrested for a broad category of offenses that includes driving while intoxicated and disorderly conduct. Relatedly, misdemeanors were the most serious charge for nearly 40% of all bookings at Fulton County Jail in 2022.

The Superior Court of Fulton County has a “Familiar Faces” initiative aimed at identifying people who “frequently cycle through jails, homeless shelters, emergency departments and other crisis services.” According to PAD, people in the initiative are defined as those who have been “booked three or more times within 24 months for non-violent offenses, who do not have violent offenses in their booking history in Fulton County, and who have a mental health screen score of 5 or greater.” PAD notes that the jail had designated nearly 4,000 people as “Familiar Faces,” amounting to just over 9,000 bookings between 2020 and 2022. The average length of incarceration was 20 weeks.

It’s easy to see how a rise in stigmatizing campaigns led by city and county officials that center “repeat offenders” almost exclusively targets Black Atlantans living in poverty.10 In its 2022 Annual Report, the Atlanta Police Foundation’s “Repeat Offender Commission” disclosed that, of the 1,500+ people it profiled and targeted in 2022, 93% were African American.


Reproducing poverty through criminalization

Making it harder to house people

Arrest and incarceration present significant barriers to housing. Even a recent White House plan to reduce homelessness 25% by 2025 recognized the criminalization of homelessness as a key contributor to the 3% rise in people experiencing unsheltered homelessness across the country.

Nationally, people who have been to prison one time experience homelessness at a rate nearly 7 times higher than the general public, as the Prison Policy Initiative found in a previous study. People incarcerated more than once have rates that are 13 times higher.

Part of the problem is that federal guidelines give public housing agencies — which have the potential to be a much more substantial bulwark against housing insecurity — the discretion to discriminate against people with criminal convictions. While most renters find a place to live in less than a month, the process can take years for those relying on the Housing Choice Voucher program.

Even in Atlanta, where an anti-discrimination ordinance passed last year to protect people directly impacted by the criminal legal system, background checks are still a routine part of the public housing application process. And if someone is arrested during the lengthy and complicated application process, they may have to start all over again so that the new arrest can be scrutinized.

For those living on the brink of homelessness, pandemic-related housing protections like eviction bans and rental assistance have all expired as of July 2022. Though most states require a waiting period before a landlord can move forward with an eviction, Georgia law allows landlords to proceed “immediately” after a tenant has been given notice to vacate. That’s a sharp blow in a state where the minimum wage is one-third of the roughly $21 an hour wage necessary to afford a 2-bedroom apartment.

Struggling to attend court

Poverty makes it exceedingly difficult to make court appointments, but homelessness makes it even harder. Of those in our ACSP dataset who had ever been incarcerated at the Atlanta City Detention Center, 86% also had at least one warrant on record for failing to appear in court.

If someone accused of a crime misses court, a judge can issue a “bench warrant” for their arrest. In Atlanta Municipal Court, a “failure to appear” entry is automatically accompanied by a bench warrant and a $50 fine (which may be waived at a later time at a judge’s discretion). While there is currently no firm national estimate of the number of active bench warrants, it is widely understood that they make up a significant portion of overall warrant activity.

Bench warrants are a blunt tool that are often unnecessary. Most people who miss court are charged with minor crimes and are not trying to avoid the law; more often, they forget, are confused by the court process, cannot read the handwritten citation, or have a schedule conflict. To complicate matters further, people who are unhoused cannot afford to miss work and often cannot obtain reliable transportation, childcare, and keep consistent cell phone service which would allow them basic communication and access to online resources.

Atlanta, like most cities, chooses to notify people of their court dates via snail mail, which makes it virtually impossible for an unhoused person to reliably comply. Once a warrant is issued for failure to appear, those accused frequently end up living as “low-level fugitives,” quitting their jobs, becoming transient, and/or avoiding public life (including hospitals) due to the risk of police interactions that could further upend their lives.

Existing oppressive practices do not seem to be enough for local lawmakers. A new law in Georgia (SB44, Section 3), passed in 2023, requires cash bail for anyone who has had a failure to appear bench warrant in the past five years. The year before, an in-depth review of case files for 250 people found that 30% were at Fulton County Jail because they couldn’t pay a bond of $15,000 or less. One individual spent nearly 500 days in jail because he couldn’t afford his freedom. As poverty obstructs a person’s ability to make court appointments, unaffordable cash bail essentially ensures that those who are unhoused will be jailed.

Nickeled and dimed

It’s expensive to be poor. Poverty policing assigns fines and fees to the people who can least afford them. Our Atlanta dataset bears this out, as we found 41% of people have outstanding criminal legal debts in Fulton County and/or Atlanta Municipal Court, averaging $536 each.11 This does not include cash bail amounts levied against just the individuals in our dataset by Fulton County State and Superior Courts, which amount to roughly $20 million in total.12


Conclusion

Policing homelessness in Atlanta is essential to maintaining a precarious and patently unjust status quo. Not only is it required to manage the displacement wrought by the city’s rapid gentrification by real estate developers and local leaders’ refusal to enact rent control legislation, but it justifies ever-greater investments in law enforcement and carceral control.

Similar dynamics are at play in cities across the U.S., which makes undertakings like ours in Atlanta a crucial example. Unearthing just how much policing focuses on homelessness, and what that policing looks like, can inform budgetary reorganizations and community interventions that will make poverty policing obsolete.

Atlanta’s residents are currently engaged in a pitched battle against Cop City, which entails the deforestation of the city’s oldest Native lands to build the nation’s largest militarized police training facility, because it is an aggressive escalation in this harmful model — but importantly, one that is not preordained.

Though successful campaigns to close and repurpose the Atlanta City Detention Center (ACDC) have backslid into plans to lease space to the Fulton County Jail, Atlantans remain fighting on all fronts for a different future. The city recently made people with criminal records a protected class, meaning that they cannot be denied housing and employment based on their records. Meanwhile, community interventions like PAD, for example, have drastically reduced rearrest rates among people in this population who are participating in their programs for 6 months or more.

Following through on task force recommendations for closing ACDC could generate an estimated 77% drop in bookings at ACDC by reducing the scope of the city’s “quasi-criminal” code, converting many offenses to civil infractions, and prioritizing diversion and other alternatives to arrest.

As for the ACSP, our next step is to use these findings to mobilize those of us most harshly affected by the criminalization of poverty, to create tools that bolster participatory defense and empower people to advocate for themselves in court, before discriminatory landlords and employers, and to voice concerns to elected representatives. We aim to demystify the legitimate fear associated with showing up to court and being involved in one’s own criminal legal process, so that people can have debilitating fines and fees waived and stale cases closed.

At the most basic level, the strongest pathways to ending homelessness in Atlanta run headlong into police encounters, which must be reduced.


Methodology

The Atlanta Community Support Project focuses on a broader population than this study’s methods could capture: people living in extreme poverty in Atlanta. This study operationalizes “people living in extreme poverty in Atlanta” as those who have recently experienced homelessness, strictly because of the absence of data about more direct measures, such as income, in local criminal legal system data.

This limitation to the study’s ability to identify the full scope of individuals living in extreme poverty means that its findings (such as the descriptive statistics about the sample) are not necessarily generalizable to everyone living in extreme poverty in Atlanta. Instead, they describe a subset of that population: people who experience homelessness in the city.

This Atlanta Community Support Project study relies on three main sources of information:

  1. Daily jail booking logs from the Atlanta City Detention Center (ACDC). These logs were provided to many local social service providers and include address information for arrested individuals. These address data were used to estimate the percentage of people experiencing homelessness when they were arrested in 2022. All entries, entered by law enforcement and court personnel, were manually coded as experiencing homelessness if they contained “homeless,” “no address,” “no fixed address,” “not given,” “transient,” “Gateway,” “unknown,” “none,” “urban camper,” “park,” or a blank in the address field (“Gateway” refers to a local shelter system). It’s worth noting that the field from which these data were drawn was originally based on self-reported last known addresses or an officer’s observations in interacting with the individual, and therefore the Project’s estimate of the prevalence of homelessness among people arrested excludes those who were experiencing homelessness but gave a prior address or a family member’s address. 1,469 out of 11,731 jail log entries in calendar year 2022 either self-reported or otherwise indicated that they were experiencing homelessness.
  2. A purposive sample of almost 3,000 people. This dataset was selected for study because these individuals were identified as having experienced homelessness in Atlanta between late 2018 and 2022 (most in 2021 and 2022). It was used to examine demographic characteristics and criminal legal system histories of this population. The study sample includes individuals known by various social, health, and legal service providers to have experienced homelessness in Atlanta between late 2018 and the end of 2022. It was drawn from existing lists maintained by the Policing Alternatives and Diversion Initiative (PAD), legal partner agencies, and local health and social service providers. Individuals whose records were missing legal name and date of birth, or who could not be confirmed as having experienced homelessness, were excluded from the final sample. While these lists are not exhaustive and do not include everyone who experienced homelessness in recent years, the sample’s final size was well over the city’s Point-In-Time count of people experiencing homelessness in 2022 (which was 2,017).
  3. Court records from the Municipal Court of Atlanta, Fulton County Jail, and Fulton County Court. These records were scraped from the web and matched to individuals in the Atlanta Community Support Project sample (described above) to examine that population’s past interactions with the local criminal legal system. Individuals were matched to records by first name, last name, and date of birth, and all variants of individual names found in the records were merged to create one unique ID number for each person in the sample with a matching court record(s). Personally identifying information was then removed, leaving a fully anonymized dataset for analysis.

Read the methodology


Appendix

The following table shows the number of diversions referred from law enforcement agencies to the Policing Alternatives & Diversion Initiative (PAD) in 2022 broken out by offense category. According to the organization, “PAD accepts diversion referrals from Atlanta Police Department, MARTA police officers, and Georgia Tech police officers who have probable cause to arrest an individual and identify that there is a need related to substance use, mental health, or extreme poverty.” Law enforcement made 418 diversion attempts, 31 of which had multiple “probable cause” offenses listed, for a total of 451 alleged offenses.

Offense category Number of diversions Percent of total
Trespassing 165 36.6%
Panhandling / soliciting 55 12.2%
Theft/shoplifting 44 9.8%
Public drinking 40 8.9%
Disorderly conduct 32 7.1%
Pedestrian violations 31 6.9%
Urban camping/loitering 25 5.5%
Indecency 23 5.1%
Simple drug possession 16 3.5%
Property damage 8 1.8%
Driving violations 5 1.1%
Fare evasion 5 1.1%
Assault 2 0.4%
TOTAL 451

See the appendix


Footnotes

  1. In this report, “city jail” refers specifically to the Atlanta City Detention Center (ACDC) linked to the municipal court system. The facility is used to process arrests for misdemeanors and city ordinance violations and as a detention center; however, not all arrests processed there result in detention. For an explanation of why we chose to focus on arrests processed at ACDC, see the sidebar “Why this research focuses on Atlanta City Detention Center.”  ↩

  2. Most of the demographic data for the people in the Atlanta Community Support Project dataset was reported by law enforcement or other government agencies. However, the Policing Alternatives & Diversion Initiative (PAD) has collected more accurate demographic information, giving us a subset of our dataset — 512 out of all 2,859 individuals — who were able to self-report transgender or non-binary identity, and 505 who self-reported race and ethnicity. Of the 512 people with self-reported gender data, 29 reported being trans and 6 reported a non-binary gender identity. Of the 505 who reported their own race or ethnicity data, 407 identified as Black — a greater percentage than was reflected in the overall dataset (81% versus 78%).  ↩

  3. This calculation is based on the 2022 point-in-time count of people experiencing homelessness (2,017) and the Census Bureau’s estimate of the number of Atlanta residents living in poverty as of July 2022 (18.5% of 499,127, or about 92,338 residents). The Census Bureau uses a set of varying money income thresholds to determine who is living in poverty, categorized by family composition and counting everyone in a family.  ↩

  4. In addition, this data is based on self-reported last known addresses and therefore the Project’s estimate of the prevalence of homelessness among people arrested excludes those who were living unsheltered but listed a prior address or a family member’s address. This is another reason why the 12.5% estimate presented here is almost certainly an underestimate of the real scale of poverty arrests.  ↩

  5. As of 2023, approximately 76,000 of the 514,000 people held in jails nationwide for local authorities (i.e., excluding those held in local jails for state, federal, or other authorities) are women.  ↩

  6. This was calculated as follows: 1,469 of 11,731 bookings at ACDC and 854 of 12,974 bookings at Fulton County Jail were of people reporting or presenting as experiencing homelessness, the combined 2,323 bookings of people experiencing homelessness was divided by the combined 24,705 bookings in 2022. It should be noted that the Fulton County Jail data only covers the first eight months of 2022 (January through August). Also note that bookings do not necessarily represent unique individuals, as individuals can be arrested and booked multiple times per year.  ↩

  7. The Jail Population Review Committee report also showed that 27% of all bookings in the Fulton County Jail were for what the city considers “divertible” offenses, and nearly half (47%) of those bookings were of individuals with no prior bookings in Fulton County in at least the previous 4 years. Moreover, the ACLU analyzed the same jail’s data and found that the county “over-detained 728 people” on a given day, housed or not. In other words, it could easily reduce its jail population by about 25% by appropriately diverting eligible offenses, not setting unaffordable bond, and indicting defendants in a timely manner (i.e., in compliance with state law).  ↩

  8. In 2020, the Reimagining ACDC Task Force Policy Workgroup published a limited analysis of ACDC booking data from January 2018 to August 2019. This analysis did not disaggregate people booked by housing status, but did note that of the top 10 “city” charges (that is, ordinance violations) across all ACDC bookings included pedestrian violations, drinking in public, drinking in the vicinity of a liquor store, disorderly conduct while under the influence, etc. Of the top 10 state charges, 8 involved traffic violations.  ↩

  9. Law enforcement made 418 diversion attempts, 31 of which had multiple “probable cause” offenses listed, for a total of 451 alleged offenses. Percentages here are based on that total. For the complete breakdown of these diversion attempts and alleged offenses, see the Appendix.  ↩

  10. “Familiar Faces” differs from “habitual offenders” or “repeat offenders,” which are specific statutory terms in Georgia that describe individuals with previous convictions for felony offenses anywhere in the United States.  ↩

  11. This only includes current amounts owed, as of May 2023.  ↩

  12. Of the people in the ACSP dataset, 1,161 had Fulton County court records that included bond amounts set by the court. However, some of these individual records included multiple entries of the same bond amount for the same booking number, and it was unclear how many of these represented separate bond amounts set by the court for separate charges (i.e., we know some individuals in the dataset were given multiple charges for the same offense in a single case), and how many were duplicative entries. We therefore calculated the total bond amounts two ways: first, assuming every bond amount entered for each booking number was a separate bail amount (this totaled over $22 million), and then assuming only unique amounts were separate bail amounts (this more conservative measure totaled over $17 million).  ↩

See the footnotes


Acknowledgements

Luci Harrell, whose original research provided the foundation for this report, would like to thank Michael Everett at the COVID Behind Bars Data Project at UCLA School of Law for assistance with court records and coding. The authors also thank Wendy Sawyer and Emily Widra at the Prison Policy Initiative for their support in the writing process for this report.

Research for the Atlanta Community Support Project was supported in part by the Soros Justice Fellowship, which is funded and administered by the Open Society Institute (OSI). The opinions expressed herein are the author’s own and do not necessarily express the views of OSI.


The percent of people in prison with HIV barely budged despite the heightened risks of COVID-19 to immunocompromised individuals. We review the evidence connecting the parallel epidemics of HIV and incarceration, which disproportionately impact Black men in the South.

by Emily Widra, June 1, 2023

The rate of new HIV diagnoses in the U.S. has been steadily declining for decades, but people in prisons are still disproportionately living with the virus. New data from the Bureau of Justice Statistics (BJS) report HIV in Prisons, 2021 indicates that some state prison systems are completely out-of-step with the rest of the nation and have experienced an increase in HIV prevalence since 1991.1 Some of this increase reflects vast improvements made in health care that allow people with HIV to live longer than in the early years of the epidemic. More concerningly, some of the increase appears to be tied to the mass incarceration of Black people and the oft-ignored epidemic of HIV among Black men in the South.

In addition to national and regional trends in HIV prevalence in prisons, and the twin epidemics of HIV and mass incarceration, this briefing highlights BJS data on prison testing policies and research on the criminalization of the virus in the U.S.

two charts showing decrease in number of people in prisons with HIV over time and prevalence rate in prisons is still triple that of the U.S. Figure 1.


Nationally, HIV rates in prison greatly outpace the general population

Overall, the percent of the U.S. prison population that is living with HIV steadily declined from the 1990s to 2016. At its peak in 1992, 2.5% of people in all state and federal prisons were HIV-positive.2 By 2016, this had decreased to 1.2%.

New 2021 data from the Bureau of Justice Statistics shows that, while the overall number of imprisoned people with HIV has declined, the portion of the prison population living with the virus has not changed in the past five years. In fact, the recent 0.1% change in the percent of the overall prison population living with HIV is entirely attributable to a change in the percent of HIV-positive people in federal prisons, which decreased from 1% of the federal prison population in 2020 to 0.9% in 2021.

And while we see little change in the prevalence of HIV in prisons in recent years, the comparison to the general U.S. population is startling. The prevalence rate of HIV in the U.S. in 2019 was 380 per 100,000 people,3 while the total U.S. prison population faces a rate that is more than 3 times as high: 1,144 per 100,000 people in prison had HIV in 2021.


In some prisons, HIV prevalence rose as COVID-19 pandemic advanced

The Bureau of Justice Statistics reports that 2019 to 2020 represented the largest one-year decline in the number of people in prison with HIV (down 15%) since data collection began and explains that this was “largely as a result of the COVID-19 pandemic.” Readers might optimistically interpret this as evidence that prisons were rightly concerned about the heightened risk COVID-19 posed to immunocompromised people, such as those diagnosed with HIV. Unfortunately, when we take a closer look at the data, it’s hard to say whether that was the case.

chart showing the number of prison systems with an increase int eh number of people with HIV from 2019 to 2020 and 2020 to 2021

Figure 2.

In fact, some states seemed either oblivious to – or, less generously, unbothered by – the additional risks that COVID-19 poses to people with HIV. In 12 states, the number of HIV-positive people in prison actually increased from 2019 to 2020, suggesting significant state-by-state variation during the pandemic. And as states ended COVID-19 emergency responses in 2021, these variations did not improve: From 2020 to 2021, 20 states and the federal Bureau of Prisons saw an increase in the number of imprisoned people with HIV. This suggests that any positive changes made in reducing the HIV-positive prison population during COVID-19 are set to return to pre-pandemic levels.

Nationally, the 15% decline in the number of HIV-positive people in prison amounts to just over 2,000 people. If every one of them were actually released from prison directly as a response to COVID-19, this would be worth noting as an accomplishment in mitigating the risk of deadly disease among immunocompromised people. However, this decrease was proportionally the same as the overall drop in the prison population that year, and the actual percent of the prison population living with HIV did not change in any significant way. Therefore, it seems unlikely that the drop in the HIV-positive prison population was the result of a targeted effort to protect the health of these individuals.


Black men are hit the hardest by HIV and incarceration

The Bureau of Justice Statistics has not provided data on the race of imprisoned people living with HIV since 2004.4 The last time it published this data nearly 20 years ago, BJS reported that, among the more than 15,400 people in state prisons that self-reported positive HIV test results, 53% were Black, 22% were white, and 19% were Hispanic or Latino. Until more recently, the Bureau’s HIV in Prisons series also included a breakdown of HIV-related deaths by race; in 2019, the mortality rate for HIV-related deaths among Black people in prison was three times the rate of HIV-related deaths of all people in prison (1 per 100,000).5

chart showing the racial disparities in deaths of people with HIV in prison compared to deaths of people with HIV in U.S. total population

Figure 3.

Unfortunately, while there is little other data on the overlap between incarceration, race, and HIV, we do know that Black people are disproportionately affected by both mass incarceration and HIV. This is not a coincidence, as our 2017 briefing on the subject explains. Black people are vastly overrepresented in the U.S. prison population: in 2021, Black people were imprisoned at a rate of 1,186 per 100,000 adults, more than five times the rate of white adults and more than twice the overall adult imprisonment rate of the U.S.

Not only do Black people make up 33% of people in prison while only representing about 14% of the entire U.S. population, but they account for more than 40% of people living with diagnosed HIV. Black men in particular are hit the hardest by both imprisonment and HIV: they accounted for 31% of all people in prison in 2021 and 26% of all HIV-positive people in the U.S. in 2019.6

The racial disparities observed in prison HIV prevalence rates are mirrored in prison mortality rates.7 From 2016 to 2019, there were 114 deaths of people with HIV in prison (of any cause), and 74 of these deaths (65%) were of incarcerated Black people (see Figure 3). In 2019, 12 of the 17 deaths of people with HIV in prison (71%) were of non-Hispanic Black men, specifically. These racial disparities persist outside of prisons as well: 43% of people with AIDS8 who died (of any cause) in 2019 were Black.9


Regional differences: HIV prevalence in the South

In 2017, we summarized the limited existing research on the ways in which Black men face the parallel epidemics of HIV and mass incarceration, with a focus on the effect in Southern states. The HIV prevalence rate in the South10 is 379 per 100,000 residents, which is more than twice the rate in the Midwest and well above the national rate of 318 per 100,000.11

This pattern appears to hold true in prisons as well: All seven states with the nation’s highest rates of HIV in prison are in the South: Florida, Mississippi, Louisiana, Maryland, Tennessee, Georgia, and South Carolina. In fact, all of the states with more than 2% of their prison population living with HIV are in the South: Florida (2.8%), Mississippi (2.5%), and Louisiana (2.5%). These Southern state prison systems also have some of the most significant racial disparities in the nation, supporting the correlation between HIV and the incarceration of Black people.

From 1991 to 2014, the New York state prison system was the prison system with the highest HIV prevalence rate in the country.12 But starting in the mid-2000s, while Northern state prisons were seeing major decreases in HIV prevalence, Southern state prison systems witnessed the opposite. States like New York, Connecticut, and Massachusetts saw sizable drops of 12, 4, and 4 percentage points respectively in the last 30 years, while Louisiana, Tennessee, and Mississippi have seen steadily rising HIV prevalence in prisons.

two charts showing three state prison systems with dramatic decreases in HIV prevalence and 3 state prison systems with increases in HIV prevalence from 1991-2021 Figure 4.

2015 was the last year that New York had the prison system with the largest portion of the population living with HIV. Since then, Louisiana (2016-2020) and Florida (2021) have had the highest in-prison HIV prevalence rates in the country: in 2021, 2.8% of people in Florida prisons had HIV.


HIV testing: Vast differences in prison policies

While most prison systems in the U.S. provide mandatory or “opt-out” HIV testing during admission,13 there are a few concerning gaps in testing policies across the country. Ten of the 50 reporting prison systems14 only offer tests if they are requested (“opt-in”) or based on a clinical medical evaluation. Only 18 states offer HIV testing during routine medical care for all imprisoned people, while all other states and the federal Bureau of Prisons only offer tests by-request during clinical visits for people the prison system has identified as vulnerable to HIV, or when someone is involved in “an incident.”15

Only one state – Texas – mandates HIV testing prior to release. Nine other states (accounting for a total of 20% of all 2021 prison releases) offer optional HIV testing to all people during their discharge planning process. Among the ten states with the highest HIV prevalence in prisons, nine of them offer HIV testing upon release; Mississippi – with the third highest rate of HIV – does not offer testing at all prior to release.


The criminalization of HIV across the U.S.

According to the Centers for Disease Control (CDC), 35 states have laws that criminalize HIV exposure and four more states have sentence enhancement laws for HIV or sexually transmitted infections (STIs). The criminalization of HIV refers to the existence and enforcement of criminal laws that rely on HIV status as the “foundation for criminalizing otherwise legal conduct” or for increasing punishments related to solicitation and sex offenses. The CDC classifies these types of laws in three categories:

  1. HIV-specific laws that criminalize or control actions that can potentially expose another person to HIV. (21 states)
  2. Sexually transmitted infection (STI), communicable, contagious, infectious disease laws that criminalize or control actions that can potentially expose another person to STIs/communicable/infectious disease. This might include HIV. (14 states)
  3. Sentence enhancement laws specific to HIV, or STIs, that do not criminalize a behavior but increase the sentence length when a person with HIV commits certain crimes. (4 states)

map of U.S. showing 35 states with HIV-specific or STI-specific criminalization laws and 4 more states with sentence enhancement laws for HIV or STIs. Figure 5.

HIV disproportionately affects gay and bisexual men (and other men who have sex with men), Black and Hispanic people, and people who inject drugs. Similarly, people identifying as lesbian, gay, and bisexual, Black and Hispanic people, and people with substance use disorders are targeted for policing and overrepresented in the national prison population. We cannot draw conclusions about just how much effect HIV criminalization laws have on the number of people with HIV in prison, in part because HIV or STI-specific laws are not often considered the “most serious offense,” are often a “lesser offense” contributing to sentencing, and therefore are not denoted in most criminal legal system data. However, we know that many of the same people who are most vulnerable to HIV infection are also disproportionately affected by both HIV criminalization laws and mass incarceration.

HIV criminalization in the South: A closer look at Florida

In the South, the overlap between HIV prevalence in prisons, HIV criminalization, and incarceration is stark. Eleven of the 17 Southern states (as defined by the CDC) have HIV-specific criminalization laws on the books. An additional three states have enacted STI-specific laws. Florida presents a particularly egregious example of how these dynamics can coincide.

In 2021, Florida had the highest in-prison HIV rate with 1,800 HIV-positive people in prison (almost 3% of the state’s prison population). The state also has some of the most oppressive HIV-related criminal laws. The Williams Institute at UCLA has reported in-detail about specific statutes that criminalize HIV in Florida, including offenses that criminalize people living with HIV and other sexually transmitted diseases “in the contexts of sex work, donation of blood and other bodily products, and consensual sex without disclosure.” Florida also has sentence enhancements for “certain non-consensual sex offenses where the defendant has a previous positive HIV test.”

Importantly, all of these statutes are broad enough to criminalize conduct that cannot actually lead to transmission of the virus,16 resulting in charges and convictions based on HIV status alone.

From 1997 to 2020, at least 154 people were imprisoned in Florida for HIV-related offenses,17 including those listed above. While this may be a small percentage of the overall Florida prison population (which was the third largest state prison system in 2021), it’s important to note that these 154 people did not have a “more serious offense” other than their HIV-related offense, and that the enforcement of such laws disproportionately targets women, Black people, and people who engage in sex work:

In addition to the criminalization of already-vulnerable people living with HIV, the cost of incarceration associated with Florida’s HIV criminalization laws has been more than $15 million over the past 23 years.

Florida is not the only state that criminalizes HIV, as we discussed above. Other states with the highest rates of HIV in prison – Louisiana and Georgia – have HIV criminal laws on the books, too.


Conclusion

Though some states and the Bureau of Prisons have seen rising prevalence rates of HIV since the pandemic began, the portion of the overall prison population living with the virus has changed little since 2016. There are fewer people living with HIV in prison than there were in the early 2000s, but one-in-seven HIV-positive people still pass through the U.S. prison system each year. Thousands of people across the country who are facing chronic illness, and who require consistent medical care, are locked up in settings where health care is grossly inadequate. This is true not only for people with HIV but anyone with infectious, long-term, or chronic illnesses.

The fact that nearly three times as many imprisoned people are facing HIV compared to the general public creates a critical imperative for targeted public health interventions among these populations, including increased sexual health care and education in prisons, greater access to testing and treatment, and stronger post-release services that help people transition their care into the community. It also underscores the need to address the issue at the front-end of the system by ending the criminalization of people with HIV and addressing the targeted policing of populations that have been made particularly vulnerable to the virus.


Footnotes

  1. Throughout this briefing, “prevalence” is defined as the percent of people living with HIV in the total population. While public health officials often utilize “incidence rate” – the number of new diagnoses per 100,000 – this is unfortunately not compatible with any of the HIV data published by the Bureau of Justice Statistics in the HIV in Prisons series.  ↩

  2. This is based on available data from BJS from 1991-2021.  ↩

  3. This is the rate of persons (aged 13 years old and older) living with a diagnosed HIV infection, year-end 2019, as reported by the Centers for Disease Control and Prevention (CDC) in the annual report: “Monitoring selected national HIV prevention and care objectives by using HIV surveillance data–United States and 6 dependent areas, 2019.”

    There is 2020 data available from the CDC, although the agency cautions against using this data “due to the impact of the COVID-19 pandemic on access to HIV testing, care-related services, and case surveillance activities in state and local jurisdictions.” In light of this, we opted to exclude 2020 HIV data from the CDC throughout this briefing, and use 2019 to represent the most recent data.
     ↩

  4. The National Prisoners Statistics survey does not collect race data for people in prison with HIV, either.  ↩

  5. In the 2021 iteration of HIV in Prisons, the Bureau of Justice Statistics states: “Data on deaths are no longer presented in this report. BJS ceased collection of detailed mortality data in state and local correctional facilities after the 2019 data year.”  ↩

  6. These percentages were calculated from Table 16a in “Persons living with diagnosed HIV infection, by race/ethnicity and selected characteristics, year-end 2019 – United States.”
    In addition, it is worth noting that almost twice as many Black men are living with HIV than Black women.
     ↩

  7. The HIV in Prisons series collected and published mortality data on HIV up until 2019, but has since stopped publishing this data. In addition, there is an information vacuum regarding deaths in custody, leaving advocates, researchers, reporters, and government officials with little-to-no data to understand trends in, and the causes of, deaths in U.S. prisons and jails. For more about this data gap, see Seven years after the deadline – still no complete data or analysis from DOJ on deaths in custody from the UCLA Law COVID Behind Bars Project and their newest project, the Carceral Mortality Project.  ↩

  8. These data – collected and published by the CDC – provide the number of deaths of “persons with diagnosed HIV infection ever classified as stage 3 (AIDS)” and that these deaths “may be due to any cause.” Of note, this is a different definition than the BJS prison death data, but it is the closest comparison we could find. Centers for Disease Control and Prevention, National Center for Health Statistics. National Vital Statistics System, Mortality 2018-2021 on CDC WONDER Online Database, released in 2021. Data are from the Multiple Cause of Death Files, 2018-2021, as compiled from data provided by the 57 vital statistics jurisdictions through the Vital Statistics Cooperative Program.  ↩

  9. Further evidence of the racial disparities and disproportionate effect of HIV among Black men in particular is evident in the 2021 CDC data as well: Black people accounted for 50% of the approximately 5,000 AIDS-caused deaths in the U.S. and 30% of all AIDS-caused deaths were of Black men in particular.  ↩

  10. The CDC classifies the South as Alabama, Arkansas, Delaware, District of Columbia, Florida, Georgia, Kentucky, Louisiana, Maryland, Mississippi, North Carolina, Oklahoma, South Carolina, Tennessee, Texas, Virginia & West Virginia.  ↩

  11. This trend is also present in the regional differences in incidence rates of HIV: the rate of new diagnoses of HIV is highest in the South, at 15.2 per 100,000 people, which is 60% higher than the incidence rate in the Northeast.  ↩

  12. This is not necessarily surprising, as New York City was one of the hardest hit cities by the HIV epidemic in the U.S. And while New York City – and the state of New York – have seen significantly declining rates of new diagnoses, the city “continues to have one of the largest HIV epidemics in the United States.”  ↩

  13. Opt-out testing refers to policies that mandate that everyone is offered a test and will receive a test unless they explicitly decline it.  ↩

  14. The 50 reporting prison systems include 49 state prisons and the federal Bureau of Prisons. Alaska did not report data on testing practices during the intake process for the 2020 or 2021 survey.  ↩

  15. The survey BJS disseminates to compile data for the HIV in Prisons series does not define vulnerable populations (or “high risk” in BJS parlance), nor does it explain what constitutes “an incident.” Instead, BJS permits the responding prison systems to check a box to indicate they offer testing after involvement in “an incident” without further clarification. There is likely significant variation between prison systems with regard to how they determine who is particularly vulnerable to HIV and what “incidents” trigger the offer of HIV testing. For example, the data does not indicate if people are offered HIV tests after working a shift in the infirmary, after having an injury, or after being assaulted by staff or other people in prison. We also cannot be sure who the prison systems are classifying as particularly vulnerable to HIV infection, such as people getting tattoos or people with histories of intravenous drug use.

    For the relevant survey questions about HIV, see “Section V — HIV/AIDS” of the National Prisoner Statistics Summary of Sentenced Population Movement 2021 (Form NPS-1B).
     ↩

  16. For example, while we know HIV is transmissible through blood transfusions, the donation process involves thorough testing and it is extremely unlikely that anyone will contract HIV through blood or organ donation. Florida’s law criminalizing the donation of blood or organs for people who are living with HIV is unnecessary given the extent of testing conducted on donated blood and organs.  ↩

  17. This means that their “most serious offense” was an HIV-related offense, not something else that would be considered more “serious,” like homicide or burglary.  ↩

See the footnotes


May 23, 2023

As we explained in a report earlier this month, every U.S. state punishes far more people than is remotely necessary, not just with long prison terms but with long stints on probation and parole. 42% of prison admissions nationwide are for violations of supervision, meaning that these supposed “alternatives” to mass incarceration are major drivers of the system.

While radical reforms to probation and parole are warranted, a handful of modest reforms have the potential to quickly shrink the number of people under supervision and even to release significant numbers of people from incarceration. This morning, the Prison Policy Initiative and the Katal Center for Equity, Health and Justice released a report called Excessive, Unjust, and Expensive: Fixing Connecticut’s Probation and Parole Problems that lays out this winnable, high-impact reform package — one that could be replicated in many other states.

We published this report to support advocates on the ground in Connecticut who, at this moment, are pushing lawmakers to implement a reform package that could make the state’s parole and probation systems significantly fairer. Advocates working to implement similar reforms in other states may find our report helpful as they marshal arguments in support of change.

Pie chart showing more than a third of admissions to CT prisons are for alleged supervision violations

Our report recommends that states — like Connecticut — that want to implement these reforms take the following steps:

  1. Restrict the use of incarceration as a punishment for technical violations of probation and parole. In Connecticut, as in most states, hundreds of people behind bars are serving time for noncriminal acts that happened to violate one of the (often burdensome) conditions of their supervision. The authors find that Connecticut’s probation system imposes up to 17 different rules on supervisees, making it difficult to impossible to avoid slipping up. Incarcerating so many people for noncriminal behaviors is not just draconian; it’s also expensive, costing taxpayers about $1,200 per week per person.
  2. Replace automatic incarceration for alleged violations with a written notice to appear in court. Correctional facilities are full not only of people serving time for supervision violations, but people accused of such violations, who frequently end up behind bars for weeks as they await hearings. The new report explains that of the 100 people on parole locked up every month for alleged parole violations, many are likely put there for no good reason at all: Approximately 1/3 ultimately have their parole reinstated with no finding of wrongdoing. The authors estimate that reforming this draconian system — by serving people accused of violations a notice to appear in court, rather than throwing them behind bars — would lead to at least 6,000 fewer people being arrested over the next 2 years.
Bar chart showing half of alleged parole violations in CT in 2021 were for noncriminal acts
  1. Apply earned-time credit to supervision sentences. At least nine states currently allow people on probation and/or parole to shorten their supervision sentences by demonstrating good behavior, but Connecticut has no such system. “Earned time” incentivizes success under supervision and reduces caseloads, allowing probation and parole staff to focus on people who have the greatest needs. In Connecticut, the authors find that implementing an earned-time system similar to New York’s, and allocating time credits to people currently on supervision retroactively, would get thousands of people off of supervision immediately.
  2. Bolster due process. In Connecticut — and across the country — many people charged with probation or parole violations are unaware of and do not exercise their rights. Those include, in Connecticut, the right to a lawyer at parole and probation revocation hearings and the right to a preliminary hearing (a court appearance in which someone can dispute a parole officer’s decision to detain them). In fact, in an observation of 49 parole revocation hearings in Connecticut in 2015, zero defendants appeared with state-provided counsel. Without knowledge of their rights, people are more likely to have their probation or parole revoked and end up behind bars. The report urges Connecticut to communicate and protect defendants’ right to counsel and preliminary hearings, to speed up the process between someone’s preliminary hearing and their disposition, and to guarantee that hearings take place in a neutral, public location (rather than a jail).

The report also includes a section explaining the significant benefits New York State has seen from implementing similar reforms through its Less Is More Act, illustrating the potential gains for other states considering reforms:

  • In just the first few months after its enactment, Less Is More led to nearly 2,000 people on parole who had been incarcerated for noncriminal technical violations being released from jails and prisons.
  • New York was able to close six state prisons in 2021, partly because lawmakers (accurately) anticipated a drop in incarceration due to fewer people being incarcerated for technical violations.
  • In less than two years, Less Is More cut the state parole population by 40% by allowing people on supervision who had followed the rules to earn time credits that led to their discharge.

All too often, the report explains, people on probation or parole have their lives disrupted by allegations of misbehavior, leading to lost jobs, lost housing, and broken or strained family ties. Many of these individuals should not have even been under supervision in the first place. And because incarceration is expensive, taxpayers are paying a heavy price for a system that doles out punishment much more than it offers support. Excessive, Unjust and Expensive lays out a path to reining in these draconian and costly aspects of supervision, proposing policies that could immediately impact thousands of people in Connecticut — or virtually any other state.

The full report is available at: https://www.prisonpolicy.org/reports/ct_supervision.html


Shadowy “civil commitment” facilities actually foster the traumatic and violent conditions that they are supposed to prevent.

by Emma Ruth, May 18, 2023

As if serving a prison sentence wasn’t punishment enough, 20 states and the federal Bureau of Prisons detain over 6,000 people, mostly men,1 who have been convicted of sex offenses in prison-like “civil commitment”2 facilities beyond the terms of their criminal sentence. Around the turn of the millennium, 20 states,3 Washington D.C., and the federal government passed “Sexually Violent Persons”4 legislation that created a new way for these jurisdictions to keep people locked up — even indefinitely — who have already served a criminal sentence for a “sex offense.” In some states, people are transferred directly from prison to a civil commitment facility at the end of their sentence. In Texas, formerly incarcerated people who had already come home from prison were rounded up in the middle of the night and relocated to civil commitment facilities without prior notice. This practice, though seldom reported on, made some news in 2017 when the U.S. Supreme Court declined to hear a case from Minnesota after a federal judge deemed the practice unconstitutional. The Prison Policy Initiative has included civil commitment in our Whole Pie reports on U.S. systems of confinement, but here we offer a deeper dive, including recently-published data from a survey of individuals confined in an Illinois facility under these laws.

Map showing there are more than 6,000 people across 20 states in civil commitment systems in 2022
 

Two critiques of “civil commitment”

Some advocates call civil commitment facilities “shadow prisons,5 in part because of how little news coverage they receive and how murky their practices are. In Illinois, for example, the Department of Corrections (DOC) facilities are overseen by the John Howard Association, an independent prison watchdog organization. But Rushville Treatment and Detention Facility, a civil commitment center that opened after Illinois enacted its own Sexually Violent Persons Commitment Act in 1998, is not subject to the same kind of oversight because it is housed under the Department of Human Services and is not technically classified as a prison.6 This is true in many states that have “Sexually Violent Persons” laws on their books, and consequently, horrific medical neglect and abuse proliferate in these shadowy facilities. For instance, a New Jersey civil commitment facility was one of the deadliest facilities at the beginning of the COVID-19 pandemic.

Similarly, Rushville is not held to the same reporting requirements as DOC facilities, so gathering data about people’s movement in and out of the facility is only possible by filing an open records request. Reportedly, the Bureau of Justice Statistics will take steps to begin collecting data about indefinite post-sentence ‘civil’ confinements in June of 2023. Until that happens, it’s only possible to get aggregated counts of how many people are civilly committed — nothing like the individual-level information prison systems are expected to provide in the service of transparency and accountability. This is true across the U.S., as civil commitment facilities are housed under different agencies from state to state, which makes it exceedingly difficult to measure the full scope of these systems on a national level. As a result, estimates about how many people are currently civilly committed vary from 5,000 to over 10,000 people.7 Increased accountability and oversight must be chief among efforts to address this broken turn-of-the-millennium policy trend.

A second critique of this system is reflected in another term advocates use to describe it: “pre-crime preventative detention.” Civil commitment (unlike other involuntary commitment practices, such as for the treatment of serious mental illness) can be seen as “double jeopardy” repeat punishment for an initial crime,8 or preventative detention for a theoretical future crime that has not occurred. Advocates rightly critique the fact that one of the primary justifications for civil commitment is the predicted risk that detained individuals will “re-offend,” even though people who have been convicted of sex offenses are less likely to be re-arrested than other people reentering society after incarceration.

Regardless, in many states, people who have been convicted of sex offenses are transferred from DOC facilities to civil commitment facilities at the end of their sentence and held pretrial, then re-sentenced by the civil courts. The length of these sentences is often indeterminate, as release depends on progress through mandated “treatment.” But neither “risk assessment” nor “progress through treatment” are objective measures. In fact, advocates and people who have experienced these systems argue that risk assessment tools are used to rationalize the indefinite confinement of identity-specific groups, and that assessing progress through treatment is a highly subjective process determined by a rotating cast of “therapeutic” staff.


New data: A survey of individuals held in a “civil commitment” facility

A recent report from Illinois (which I co-authored) goes beyond the numbers and reports that for many, civil commitment seems like a life sentence. This 2022 report, based on a 2019 study of residents at Rushville Treatment and Detention Facility (one of Illinois’ two civil commitment facilities), exposed demographic disparities, discrimination and abuses inside, and flaws with the broader framework of civil commitment. Like the broader carceral system, civil commitment disproportionately impacts Black and Brown people. In particular, the Illinois report noted an overrepresentation of Black, Indigenous, and multiracial people at Rushville. This is in line with the findings of the Williams Institute’s 2020 report, which found that, on average, Black people were detained in civil commitment facilities at twice the rate of white people in the states studied.

Biased admission criteria lead to disproportionate consequences for select groups

Further, the overrepresentation of LGBTQ+ and disabled people in these facilities reflects obvious biases that are “baked into” the civil commitment decision-making process. Many states use risk assessment evaluations to assess whether or not one should be civilly committed. These actuarial tools use outcome data from previously incarcerated people and conclude that, because past studies found groups with specific characteristics more likely to re-offend, individuals that match those criteria must be continually confined. Risk assessment tools are generally problematic and frequently make incorrect predictions. Chicago attorney Daniel Coyne says that in sex offense cases, risk assessment tools are 58% accurate, or “not much better than a coin toss.

Illinois and many other states use the Static-99/99R, which predicts individuals’ risk using data about groups that come from overwhelmingly unpublished studies. This risk assessment tool is notably homophobic, as it assigns a point (and thus, a higher risk value) to those who have a “same-sex victim.”9 The Williams Institute writes:

In addition to normalizing violence against women, this a priori assigns gay, bisexual, and MSM [men who have sex with men], who are more likely to have a male victim, a higher score, marking them as more dangerous than men who have female victims regardless of any other characteristics of the offense.

The evaluation also considers those who have never lived with a romantic partner to be at higher risk of reoffending, which means that LGBTQ+ people who may not be able to safely live with a partner in a homophobic area and young people who may not have had the opportunity to live with a partner yet would receive higher scores. Accordingly, representation of LGBTQ+ people in Rushville was drastically higher than in the general public:

Bar chart showing IL's civil commitment system confines marginalized groups at high rates

Criteria for detention usually include diagnosis with a “mental abnormality,” in particular, a personality disorder or a “paraphilic” disorder that indicates “atypical sexual interests.” “Paraphilic” is a problematic category that relies heavily on scrutinizing and pathologizing human sexuality.10 Further, the act of civilly committing people to a “treatment” facility implies that there is a mental health issue or “nonnormative” sexual behavior to be treated and/or cured. This is especially alarming given that the American Psychiatric Association completely disavows the practice, saying, “Sexual predator commitment laws represent a serious assault on the integrity of psychiatry.”11

Since having a “mental abnormality” is a criterion for admission, measuring the overrepresentation of disabled people in these facilities is challenging. By the logic of civil commitment, 100% of people inside have a psychiatric disability. In the Illinois report, 26% of Rushville respondents self-identified as having a disability, compared with 21% of the Illinois population. Low levels of educational attainment (i.e., having a high school degree or less) were also very high, at 48%. Anecdotally, survey respondents reported that many of their peers inside could not complete the survey because they were illiterate or had cognitive impairments that prevented them from reading and filling out a paper questionnaire, so disabled respondents’ voices are likely underrepresented.

Indefinite and punitive detention with no evidence of efficacy

Agencies that control civil commitment often insist that civil commitment is treatment, not prison. Texas Civil Commitment Center staff even went so far as to instruct detainees “to call their living quarters ‘rooms,’ not prison cells.” But advocates question whether or not civil commitment can be considered therapeutic. Can forced confinement inside facilities with high rates of violence, controlled by staff who use the same punitive measures that are common inside prisons, ever be healing?

Two-thirds of respondents inside Rushville in Illinois report that they have been sent to solitary confinement, a (potentially permanently) psychologically damaging practice. Rushville, like other civil commitment facilities across the U.S., also uses archaic treatment and evaluation technologies, including the penile plethysmograph, a “device [that] is attached to the individual’s penis while they are shown sexually suggestive content. The device measures blood flow to the area, which is considered an indicator of arousal.” Rushville detainees are subjected to chemical castration, or hormone injections that inhibit erection and have been linked to long-term health impacts. Further, their progress through treatment is measured using a variety of highly questionable evaluation tools, including polygraph lie detector test results which have been inadmissible in Illinois courts since 1981. The technologies that these facilities rely on look a lot more like medieval torture devices than the supposed “therapeutic tools” that they claim to utilize.

Even if we buy into the myth that civil commitment facilities provide the treatment they claim to offer, there is minimal evidence that this supposed treatment works, and moving through treatment tiers is difficult, if not impossible. Even staff inside report that they receive pushback when trying to advance people toward release. One review from a past employee of Rushville’s contracted mental health care service, Liberty Healthcare Corporation, reported, “The hardest part of the job is fighting for residents who should be on conditional release and dealing with the outcome when refusing to act in unethical ways.” Progress through treatment is dependent on a regularly fluctuating staff, often made up of graduate students who are finishing their residencies and then moving on to another facility. Residents inside report being demoted to earlier tiers of treatment by new residents who disagreed with previous staff members’ assertions.

With little transparency about or consistent standards regarding how to progress through treatment, many people inside say that civil commitment feels like a de facto life sentence. At Rushville, the average length of detention was 9.5 years and counting. According to a 2020 FOIA response from the Illinois Department of Human Services, more than twice as many people had died inside than had ever been released. Similar circumstances have been reported from Texas, where only five men were released in the facility’s first two and a half years of operation, four of whom were sent to medical facilities where they died shortly thereafter. A 2020 article about Rushville included the following findings:

Slightly more than half of the total population [has] been held for 10 years or more. Fifty-one people in Rushville have been held in civil commitment for 20 years or more, and 12 have been in civil commitment for 22 or more years, meaning they’ve been in civil commitment since the statute was implemented in 1998.

Chart showing 76% of people in Rushville Treatment and Detention facility report being discriminate against by staff.

People inside reinforce these findings. One Illinois survey respondent reported, “This is a life sentence after the completion of a criminal sentence. We are treated worse [than] prisoners. This is a sentence of death by incarceration. Not a revolving door program.” Indefinite sentences that are contingent on progress through treatment that feels unhelpful and opaque contribute to distress inside. This distress can result in violence and a hateful culture, between detainees and from staff to detainees. Three-quarters of detainees report being discriminated against by staff, and one-quarter report being physically harmed by staff. 8% of detainees said they were sexually harmed by staff. Anecdotally, respondents shared a number of stories about experiencing physical or sexual harm from other residents. Though civil commitment facilities are tasked with “treating” sexual violence, they actually create physical environments that foster sexual, physical, and emotional violence.


Conclusions

Civil commitment facilities are not only legally and ethically dubious, they also fail to deliver on the very objectives that justified their creation. Even still, the trend toward preventative and “therapeutic” forms of detention that are fueled by biased and error-filled algorithms and risk assessment tools is growing. As one reporter from Texas notes:

Critics of private prisons see in the Texas Civil Commitment Center the disturbing new evolution of an industry. As state and federal inmate populations have leveled off, private prison spinoffs and acquisitions in recent years have led to what watchdogs call a growing “treatment industrial complex,” a move by for-profit prison contractors to take over publicly funded facilities that lie somewhere at the intersection of incarceration and therapy.

In an era where lawmakers frequently champion “evidence-based” punishment, the public must remain vigilant in questioning whether these practices actually accomplish their supposed goals. Do they reduce the mass incarceration of hyper-policed communities? Do they minimize the ongoing harms of the criminal legal system? Do they reduce the number of people entering prisons or increase the number of people exiting them? In the case of civil commitment, the answer to all of these questions is no.

Though under-resourced, the movement to address harmful civil commitment policies is longstanding. A variety of advocates12 are leading campaigns to address ineffective sex offense policies across the U.S. (including the sex offender registry system). Other organizations support ongoing litigation campaigns like the one that was considered by the U.S. Supreme Court in Minnesota. Advocates inside and outside agree that civil commitment facilities fail to deliver meaningful safety and healing.

It’s time for policymakers to close these facilities that leverage pseudoscience to keep people under state control. Instead, we must invest in initiatives that actually prevent child abuse and sexual violence, including measures advancing economic justice, accessible non-carceral mental healthcare, comprehensive sex education, and consensual, community-based restorative and transformative justice initiatives.


Footnotes

  1. This data was provided by the Sex Offender Civil Commitment Program Network.  ↩

  2. We use the term “civil commitment” throughout because it has widespread name recognition, and because it accurately characterizes the civil legal system’s commitment of individuals to various facilities, but as we will discuss further, advocates often use more descriptive terms such as “shadow prisons” and “pre-crime preventative detention.”  ↩

  3. These states include Arizona, California, Florida, Illinois, Iowa, Kansas, Massachusetts, Minnesota, Missouri, Nebraska, New Hampshire, New Jersey, New York, North Dakota, Pennsylvania, South Carolina, Texas, Virginia, Washington, and Wisconsin.  ↩

  4. We reference these laws by name so that they are easier for readers who want to look up the statute to find, but do not endorse using this language to refer to people.  ↩

  5. For more information about the movement to change vocabulary around civil commitment, please see: https://ajustfuture.org/communications/ and https://ajustfuture.org/wp-content/uploads/2018/11/promoting-language.pdf  ↩

  6. Illinois also has a second civil commitment center within Big Muddy River Correctional Center. This program was created by the Sexually Dangerous Persons Act and it is run by the Illinois Department of Corrections.  ↩

  7. The Sex Offender Civil Commitment Program Network requests aggregate numbers from each state regularly — and these annual survey counts are what we use in our Whole Pie reports — but some advocates believe this is an underestimation because how one defines who is civilly committed varies between reporting agencies. For example, should those on “conditional release,” who are not confined but still subjected to stipulations of their state’s Sexually Violent Persons Act, be considered free?  ↩

  8. Defenders of civil commitment practices argue that civil commitment does not violate the Double Jeopardy Clause because the civil commitment proceedings are not re-litigating the initial criminal case, but using the criminal case as evidence in a subsequent civil case.  ↩

  9. For further critiques of risk assessment, the logic behind it, the inherent racism to its process, and its inaccuracies, see: https://www.aclu.org/news/privacy-technology/eight-problems-police-threat-scores; https://fivethirtyeight.com/features/prison-reform-risk-assessment/; https://jaapl.org/content/38/3/400.long  ↩

  10. From the Williams Institute report: “Critics have also noted the potential misuse of paraphilic disorders, a group of psychiatric diagnoses related to ‘atypical sexual interest.’ This category is extremely broad and includes pedophilic disorder as well as consensual sexual ‘kinky’ behaviors such as sexual masochism and sadism. The critique is that such diagnoses can be used [as] justification for civil commitment for a wide range of offenders. Paraphilic disorders diagnoses are so broad that they could be used to characterize as mentally ill many practitioners of kink, bondage, sadomasochism, or any sexual practice perceived to be deviant. This may have important implications for gay and bisexual men and [men who have sex with men], whose sexual cultures may be viewed as kinky or otherwise nonnormative due to stigma and prejudice” (pages 2-3).  ↩

  11. American Psychiatric Association, Dangerous Sex Offenders: a Task Force Report of the American Psychiatric Association (1999)  ↩

  12. These groups include (but aren’t limited to) the Inside Illinois Civil Commitment project, Just Future Project, the National Association for Rational Sexual Offense Laws, Illinois Voices, The Chicago 400 Alliance, Women Against the Registry, and CURE-SORT.  ↩

Show footnotes


Please welcome our new Senior Editor & Researcher, Brian Nam-Sonenstein!

by Danielle Squillante, May 15, 2023

Brian Nam-Sonenstein

We’re excited to announce that Brian Nam-Sonenstein has joined our team as a Senior Editor and Researcher. In this role, he’ll research and write briefings and reports, and provide editing support to other members of our research team.

Before joining Prison Policy Initiative, Brian worked as a columnist and reporter for news outlets including the Portland Phoenix, Marijuana Moment, and Shadowproof, where he is a co-founder and publishing editor. He also organized the Marvel Cooke Fellowship to produce reporting by incarcerated writers. Brian is a co-host of the Beyond Prisons podcast and has been actively producing media for over a decade on issues ranging from drug decriminalization to prisoner-led organizing. His work has been published in Solitary Watch, Truthout, Prison Legal News, SF Bay View, and more. In addition to his work as a journalist, Brian served as the Director of Public Relations for NisonCo, a cannabis & psychedelics PR firm. He holds a B.A. in International Relations from Wheaton College.

Welcome to the team, Brian!


Stay Informed


Get the latest updates:


Share on 𝕏 Donate


Events

Not near you?
Invite us to your city, college or organization.