March 19, 2025: Join Prison Policy Initiative’s Advocacy Department at 1 PM EST on Wednesday, March 19, 2025, for a webinar about understanding recidivism. We will cover strategies from our recidivism toolkit, including an overview of recidivism statistics and what they really mean, how to combat the “Willie Horton” effect, and ways that advocates can transform the narrative around reentry to make it less focused on negative outcomes and more focused on the ways that returning citizens contribute to their communities.
April 15-17, 2025: Sarah Staudt, our Director of Policy and Advocacy, will be attending the MacArthur Safety and Justice Challenge Network Meeting from April 15-17 in Chicago. Drop her a line if you’d like to meet up!
Not near you? Invite us to your city, college or organization.
The landmark 2023 Martha Wright-Reed Fair and Just Communications Act set in motion a new round of rulemaking at the Federal Communications Commission to ensure that incarcerated people and their families are paying fair rates for phone and video calls. As the FCC prepares to vote on new regulations, we joined The Leadership Conference (a coalition of over 200 civil rights organizations) in a letter sent to the agency this week with recommendations for how it can make the most of this opportunity.
First and foremost, we urge the FCC to set rate caps as low as possible for voice and video calls. The current rate caps, handed down in 2021, allow local jails to charge a maximum of 21 cents per minute, a rate that family members say can still add up to several hundred dollars a month. The letter notes that costs could be brought down “as low as pennies per minute,” as evidenced by the rates companies are already charging in counties like San Mateo, Cali. and Dallas, Texas, as well as many state prisons.
Beyond setting rate caps, The Leadership Conference letter also calls on the FCC to:
Adopt consumer disclosure labels for prison and jail telecom products, to help customers understand whether they are being illegally charged (particularly after the new rate caps go into effect).
Take extreme care when considering new pricing structures proposed by the companies, particularly subscription-based pricing, and only approve them if they are shown to save consumers money.
Close regulatory loopholes to ensure that all prisons and jails are providing people who have hearing disabilities with the services they need to call home.
Recent data have shown how prison telecom companies continue to strike lucrative contracts with correctional facilities, particularly jails, deals that impose high costs on consumers and strain their bonds with loved ones. Diligent federal regulation can stop the worst of these abuses. We call on the FCC to use its rare mandate from Congress to guarantee the fairest possible deal for incarcerated people and their families.
Since the 2022 Dobbs decision, 21 states have restricted abortions earlier than the Roe v. Wade standard. Now, more of the 800,000 women on probation and parole must seek abortion care out-of-state — but for many, whether they can get there depends on an officer’s decision.
June 24 marks two years since the Supreme Court stripped Americans of their constitutional right to abortion. The court’s 2022 decision in Dobbs v. Jackson Women’s Health Organization permitted state governments to limit and even ban abortion care — and they did. As a result, the share of patients who cross state lines for abortion care has almost doubled, from about 1 in 10 to almost 1 in 5. Traveling out-of-state for health care, including abortions, is a hardship for anyone, but it is especially challenging for people on probation or parole.
According to The New York Times, since the Dobbs decision, 21 states have implemented abortion rules more restrictive than the standard under Roe v. Wade.1 Fourteen states now ban abortion altogether, and most other states ban abortion after a certain point in pregnancy. And while some of these less-restrictive bans preserve abortion as an option for most people who need one, these bans are nonetheless as obstructive for people who need abortion care after their state’s time limit.2 In all, 41 states have some kind of abortion ban in place post-Dobbs, whether “total bans” or bans based on gestational duration.3 In every one of these states, standard conditions4 of probation and/or parole require permission to travel out of state, county, or another specified area.5
Map 1 The vast majority of states have some kind of abortion ban as well as standard conditions of both probation and parole that restrict interstate travel. Click here to see a map of abortion bans in place as of May 2024.
Map 2 Probation is the most common form of correctional control for women in the U.S., and almost every state has a standard condition of probation restricting travel. Probation populations here exclude federal. Click here to see a map of abortion bans in place as of May 2024.
Map 3 While fewer women are on parole supervision compared to probation, nearly all live in states that restrict interstate travel for everyone on parole. Parole populations here excluded federal. Click here to see a map of abortion bans in place as of May 2024.
To understand how this post-Dobbs landscape impacts women under the U.S.’ massive system of community supervision, we examined standard supervision conditions in each state, along with the number of women who must comply with them. We find that the one-two punch of abortion and supervision restrictions impacts an estimated 4 out of 5 women6(82%) on probation or parole nationwide.7 That means that for the vast majority of people under community supervision, the ability to seek abortion care out-of-state is left not to the pregnant person, but to the discretion of a correctional authority, typically their probation or parole officer.
Specifically, we find that, excluding federal probation and post-release supervision,8 82% of women on probation and 85% of women on parole live in states that (1) either completely ban abortion or restrict it based on gestational age and (2) list travel restrictions as a standard condition of supervision.
Every state and D.C. restrict the movement of people on probation or parole
For our analysis, we first looked at rules related to travel in the standard conditions of probation and parole in each state and D.C. (These are summarized in the table below.) We find that probation agencies in all but two states (Ala. and Iowa) generally require permission to leave the state, county, or other designated area. Four of these states empower the court or probation officer to set the boundaries for travel restrictions on an individual basis.9 Rules restricting interstate travel are just as common in the context of parole and post-release supervision: 40 states have a standard condition requiring permission to leave the state. Among the states that do not, five (Ark., Iowa, Mont., N.M., and Pa.) require permission to leave an even smaller area — the county or district.10 West Virginia and D.C. require permission to travel, but individualize the specific geographic boundaries in the supervision contract.
Excluding federal supervised populations, the vast majority of women on probation (98% or 672,000) and parole (96% or 60,000) live in states where their standard supervision conditions require permission to leave the state, if not an even smaller geographic area. Every single state and D.C. require permission to travel for either their probation or parole population — and almost all require permission for both.
It’s important to note that “standard conditions” are just part of the picture of probation and parole conditions, because courts can — and very frequently do — impose any number of additional “special conditions.”11 So even if travel restrictions are not included in the standard conditions that apply to everyone on probation or parole, they may still be imposed at the discretion of the court or community supervision agency.
Limited abortion care options are made worse by these standard conditions
We next looked at each state’s abortion bans and restrictions alongside their standard conditions of probation and parole. This analysis gets to how quickly state laws foreclose the possibility of in-state abortion care for women under either form of community supervision, forcing them to request permission to seek care in another state instead.12 We find that the much tighter restrictions imposed by states since the Dobbs decision put over 400,000 more women in this precarious positionthan there were under the protections of Roe v. Wade. Alarmingly, we find that only 1 in 6 women on probation or parole can access abortion care at any stage of their pregnancy without needing permission to cross state lines.
Over half (53%) of women on probation and parole live in the 21 states that the Times identified as banning abortion care at an earlier point than the standard set by Roe v. Wade (i.e., the highly variable point of “fetal viability”). Less than 3% of these women are able to travel across state lines without permission.
Nearly one-third (31%) of all women on probation and parole live in states that now have a total abortion ban. Of these, just 4% have no standard condition restricting travel.
Another 17% of women on community supervision live in states that ban abortions at six weeks — a point at which more than 1 in 4 women are not yet aware of their pregnancy.
Only 16% live in places without abortion bans and can access abortion care at any gestational point without crossing state lines.
Importantly, even when parole or probation authorities approve interstate travel, the process of getting a “travel permit” takes time and logistical coordination — and sometimes even fees.1314 This necessarily delays abortion care, increasing the risk of complications and often further limiting access.15 For example, a woman on probation in South Carolina who only becomes aware of her pregnancy when she’s eight weeks along will have to travel out-of-state for an abortion. But if it takes two weeks for her to get permission to travel, a non-surgical abortion is likely no longer an option, as the necessary medications are only approved for use until 10 weeks’ gestation.
For hundreds of thousands of women, access to abortion care is limited by their state’s abortion laws and community supervision travel restrictions
In reality, even in places that don’t list travel restrictions as standard conditions for people on probation and parole, courts and supervision officers may choose to impose them as “special conditions” anyway.
State
Estimated women on probation, 2022
Estimated women on parole or post-release supervision, 2022
Estimated total women on probation and/or parole, 2022
Probation: Need permission to leave state or even smaller area
Parole: Need permission to leave state or even smaller area
Abortion ban laws (as of May 15, 2024)
Ala.
9,820
810
10,630
No
Yes
Total ban
Alaska
500
83
583
Yes
Yes
No ban or gestational limit
Ariz.
14,780
900
15,680
Yes
No
Ban at 15 weeks’ gestation
Ark.
13,280
4,120
17,400
Yes
Yes
Total ban
Calif.
36,113
2,900
39,013
Yes
Yes
Ban at viability
Colo.
19,052
1,190
20,242
Yes
Yes
No ban or gestational limit
Conn.
6,400
130
6,530
Yes
Yes
Ban at viability
Del.
2,260
20
2,280
Yes
Yes
Ban at viability
D.C.
570
60
630
Yes
Yes
No ban or gestational limit
Fla.
42,798
210
43,008
Yes
Yes
Ban at 6 weeks’ gestation
Ga.
80,346
1,860
82,206
Yes
Yes
Ban at 6 weeks’ gestation
Hawaii
3,285
200
3,485
Yes
Yes
Ban at viability
Idaho
7,612
1,020
8,632
Yes
Yes
Total ban
Ill.
18,777
1,450
20,227
Yes
No
Ban at viability
Ind.
24,163
530
24,693
Yes
Yes
Total ban
Iowa
6,870
850
7,720
No
Yes
Ban at 22 weeks’ gestation
Kan.
3,834
550
4,384
Yes
Yes
Ban at 22 weeks’ gestation
Ky.
16,880
2,220
19,100
Yes
Yes
Total ban
La.
6,660
1,670
8,330
Yes
Yes
Total ban
Maine
960
No parole program
960
Yes
No parole program
Ban at viability
Md.
10,014
500
10,514
Yes
Yes
No ban or gestational limit
Mass.
8,079
90
8,169
Yes
Yes
Ban at 24 weeks’ gestation
Mich.
28,108
730
28,838
Yes
Yes
No ban or gestational limit
Minn.
21,270
510
21,780
Yes
Yes
No ban or gestational limit
Miss.
6,680
1,190
7,870
Yes
Yes
Total ban
Mo.
10,867
2,910
13,777
Yes
Yes
Total ban
Mont.
2,435
160
2,595
Yes
Yes
Ban at viability
Neb.
3,160
100
3,260
Yes
Yes
Ban at 12 weeks’ gestation
Nev.
2,798
591
3,389
Yes
Yes
Ban at 24 weeks’ gestation
N.H.
907
182
1,089
Yes
Yes
Ban at 22 weeks’ gestation
N.J.
25,904
530
26,434
Yes
Yes
No ban or gestational limit
N.M.
2,375
290
2,665
Yes
Yes
No ban or gestational limit
N.Y.
13,020
1,260
14,280
Yes
Yes
Ban at 24 weeks’ gestation
N.C.
15,990
1,050
17,040
Yes
Yes
Ban at 12 weeks’ gestation
N.D.
1,630
170
1,800
Yes
Yes
Total ban
Ohio
49,619
1,520
51,139
Yes
Yes
Ban at 22 weeks’ gestation
Okla.
4,944
480
5,424
Yes
Yes
Total ban
Ore.
5,940
2,830
8,770
Yes
Yes
No ban or gestational limit
Pa.
21,752
7,725
29,476
Yes
Yes
Ban at 24 weeks’ gestation
R.I.
2,355
20
2,375
Yes
Yes
Ban at viability
S.C.
5,910
260
6,170
Yes
Yes
Ban at 6 weeks’ gestation
S.D.
1,382
810
2,192
Yes
Yes
Total ban
Tenn.
14,947
1,550
16,497
Yes
Yes
Total ban
Texas
91,135
11,452
102,587
Yes
Yes
Total ban
Utah
2,460
460
2,920
Yes
Yes
Ban at 18 weeks’ gestation
Vt.
600
100
700
Yes
Yes
No ban or gestational limit
Va.
14,157
40
14,197
Yes
Yes
Ban at third trimester
Wash.
16,328
880
17,208
Yes
Yes
Ban at viability
W. Va.
1,660
730
2,390
Yes
Yes
Total ban
Wis.
10,010
2,270
12,280
Yes
Yes
Ban at 22 weeks’ gestation
Wyo.
1,410
160
1,570
Yes
No
Ban at viability
U.S. total (excluding federal)
712,806
62,321
775,127
A travel restriction is just one of many barriers to healthcare for people on probation and parole
Interstate travel restrictions are just one of the barriers women — or for that matter, everyone on probation and parole — face when it comes to accessing health care. As we’ve already touched upon, some standard conditions restrict travel across much smaller areas, such as counties or court districts. Similarly, people on electronic monitoring — an increasingly common condition of community supervision that amounts to a form of “e-carceration” — are regularly blocked from leaving their home, workplace, or other approved locations. As we have explained before, people on electronic monitoring oftenreport being denied permission to see a doctor or go to the pharmacy to have prescriptions filled.
Even in the few places that don’t impose restrictions on movement, financial costs often put healthcare out of reach for people on probation and parole. As we’ve found in previous research, people on community supervision tend to have lower incomes, with about 60% reporting annual incomes below $20,000. About 25% don’t have health insurance to cover the cost of even basic care — despite reporting worse overall health and greater levels of need.16 Probation and parole conditions often come with additional expenses as well, such as monthly fees and the costs of drug testing or electronic monitoring devices, which leave even less money for healthcare.
Finally, for women on probation and parole who need abortion care, there is a special risk of further criminalization, either for violating the conditions of their supervision or for the abortion itself. A recent law review article details the various laws used historically and currently to criminalize abortion seekers and providers, paying special attention to laws targeting people who choose “self-managed abortions” when they are unable to access care from the formal healthcare system. A report by researchers at If/When/How describes 61 cases, across 26 states, in which people were investigated or arrested for allegedly ending their own pregnancy or helping someone else end theirs. All were from 2000-2020 — in other words, pre-Dobbs. Efforts to criminalize abortion have only gained momentum since.
Conclusions
Ultimately, Dobbs not only made abortion care much less accessible for everyone who may become pregnant; it created new risks of criminalization as well. For people under supervision, those risks are intensified by the travel restrictions found in standard conditions across the country. As the Community Justice Exchange and Repro Legal Defense Fund explain in their organizing guide, “In states where clinical abortion is banned or inaccessible … [self-managed abortion] will likely be the abortion option most accessible to people under carceral surveillance, putting them at a risk for criminalization that people who can travel freely do not face.”
For this reason (among others), state legislators, courts, and community supervision agencies should minimize the number and restrictiveness of standard conditions imposed on everyone on probation and parole — and greatly reduce the use of these massive supervision programs in general. Courts should limit who they place on supervision, individualize supervision conditions, and apply those conditions only for as long as necessary to achieve results. This approach is far more likely to set people up for success than relying on restrictive, one-size-fits-all rules that only act as tripwires to further criminalization and punishment.
Certainly, whether it’s appropriate to restrict someone’s movement is among the most situation-dependent decisions supervision authorities can make, whether for work, family, religious, educational, or — as we’ve discussed here — health reasons. Restricting where people can go inevitably blocks many from accessing the resources they need, which in turn creates health and safety risks for both individuals and communities. These very real and life-threatening consequences must be taken into account and not discounted simply because of a criminal legal status.
Author’s note: Amelia Wittig and Emily Widra provided the foundational research for our analysis of standard probation conditions by collecting and categorizing the relevant forms, web pages, and statutes that stated whether travel restrictions apply to everyone on probation. These sources are on file with the author. As part of a forthcoming report on probation conditions more broadly, we plan to upload the publicly-accessible documents and those we were given permission to share, and to provide a summary table with links in our Data Toolbox.
Our data sources, methodology, and important caveats
For this analysis, we looked at (1) the number of women on probation and parole in each state and in D.C., (2) the standard conditions of probation and parole in each state and D.C., and (3) the abortion laws in each state and D.C. However, none of these data points were straightforward, so we had to create some population estimates and rely on some assumptions, explained here.
Estimating state probation and parole populations by sex: The Bureau of Justice Statistics (BJS) reports the number of people on probation and on parole (or post-release supervision) by state and sex in its annual Probation and Parole in the United States report. These data form the basis of our estimates for the number of women on probation and parole in each state. Unfortunately, some states do not report these populations by sex or are missing sex data for a portion of the population. In all, almost 27% of the probation population nationwide, and almost 8% of the parole population, are missing sex data. We looked for the missing data in publicly available reports from state probation and parole agencies, but only found it for probation populations in Illinois (23.5% female) and Kansas (25.8% female).
To avoid seriously underestimating the number of women impacted by the laws and policies we examine here, we assigned a sex to the nearly 800,000 people on probation whose sex was not reported. We did so by applying the percentage of all people on probation reported as female among those whose sex was known (24%) to each state’s count of people on probation whose sex was unknown. In other words, we assumed that the ratio of males to females among the population whose sex was reported was the same among the population whose sex was not reported. (For Illinois and Kansas, we applied the percentages that we found from state reports.) Finally, we added each state’s reported number of women on probation to our calculated estimate of women on probation whose sex was not reported to arrive at our final estimate for each state’s female probation population.
We repeated the process to assign a sex to the nearly 54,000 people on parole nationwide whose sex was unknown. For parole, the percentage of people reported as female among those whose sex was known was 11%, so we assumed that 11% of each state’s sex-unknown parole population were female. As a last step, we compared the sums of our final estimates of each state’s female probation and parole populations to those published by the Bureau of Justice Statistics in its Correctional Populations in the United States, 2022 report. Our estimates amounted to almost exactly what BJS reported (less than a 0.1% difference), suggesting that our method is similar to what BJS used to estimate these total populations.
Standard conditions of probation and parole: Standard conditions of parole as of 2020, by state, have been collected, categorized, and discussed in Wiggins, et al.’s Parole Rules in the United States: Conditions of Parole in Historical Perspective, 1956-2020. We relied entirely on their analysis when it came to travel restrictions for parole. It’s worth noting, however, that Maine no longer has a parole program as of 2022, according to the Bureau of Justice Statistics. Previously, parole was available to those sentenced before May 1, 1976 — that is, before the state abolished discretionary parole. Despite having no one on parole at this point, Wiggins, et al. (2021) report that as of 2020, Maine had a standard condition of parole restricting out-of-state travel.
Unfortunately, the same comprehensive approach has not yet been applied to standard conditions of probation — largely because of the added difficulty of collecting these documents (which are not always publicly available) from states that have county-run probation systems for felony and/or misdemeanor probation. While some of those states have statewide standard conditions outlined in statute or elsewhere, some of them may have as many variations of standard conditions as there are counties — or even cases. Not to be deterred, we collected standard conditions for felony probation from everywhere that has a single set of standard conditions for the whole state. For those states where the conditions may vary by county, we looked for a sample of documents, prioritizing the most populous counties and felony probation conditions. For the purposes of our analysis — and this is an important caveat – we assumed that the standard conditions we found were representative of the whole state. This means that we may overestimate the number of women on probation in these states impacted by travel restrictions in the standard conditions we found, but we reasoned that those conditions would at least apply to women in the largest population centers for which we could locate documents. Moreover, we found that travel restrictions were the norm, not the exception, and we believe it is more likely than not that standard conditions in the counties from which we did not collect documents also restrict interstate travel.
The states for which we used county or city probation conditions to represent the state’s typical standard probation conditions, and the specific jurisdictions we used as our sample for these states, are summarized in the table below:
State
Representative county(s) or city(s)
Probation requires permission to leave (county/state/other)
Comments
Calif.
Los Angeles
County
Riverside
State
Ind.
Hamilton
State
Porter
Area of the court’s jurisdiction
Monroe
None
These conditions were revised in 2023 to be minimally burdensome.
Boone
State
Advance notification is required, not permission.
Kan.
Shawnee
County
Wyondotte
Area within100 miles radius of home, or area within 250 miles of Kansas border
Two different standard conditions documents show different travel restrictions, and it is unclear whether these reflect different levels of probation (i.e., felony vs. misdemeanor), changes over time, or something else. The condition referencing 250 miles outside of Kansas requires “notifying” an officer, not obtaining permission.
N.Y.
New York City
Area of the court’s jurisdiction
Suffolk County
Area of the court’s jurisdiction
Ohio
Cuyahoga
County
Montgomery
State
Okla.
Tulsa
State
This appears to be a statewide condition, but we could not confirm that.
Ore.
Multnomah
State
Clackamas
State
Pa.
Philadelphia
County
Allegheny
State
Montgomery
Adjoining counties
Bucks
Adjoining counties
Delaware
State
Tenn.
Shelby
None
Knox
State
Rutherford
County
Texas
Harris
County
Tarrant
County
Travis
County
Kansas, Kentucky, Mississippi, and Vermont have statutes or standard conditions that empower probation officers or the court to determine the boundaries of an individual’s travel restrictions. The language used in these conditions varies: “My designated area of supervision is [blank] and I will not leave this area without my officer’s permission” (Ky.); “the defendant shall… remain within a specified area as directed” (Miss.); and “Your probation officer may restrict or prohibit travel to any state…” (Vt.). In Kansas, a legislative research memo explains that, “Other than a few statutorily required probation conditions… the conditions of probation, in large part, are left to the discretion of the district court…” The referenced statute lists 14 conditions that the court “may” impose, which include most of the common standard conditions found elsewhere, among them, “remain within the state unless the court grants permission to leave.” Because the conditions we found in each of these states suggest even greater discretionary power than the one-size-fits-all standard conditions, we included these among states that require permission for our analysis.
Abortion access laws: For our categorization of abortion bans, we relied on the work of the Guttmacher Institute (as of May 15, 2024), which breaks down which states have “total bans” and those that ban abortion based on gestational age or “viability.” To distinguish between which states have implemented laws restricting abortions “earlier in pregnancy than the standard set by Roe v. Wade” (that is, “viability”), we relied on The New York Times’ categorization (as of May 1, 2024).
The decision in Roe v. Wade protected the right to choose an abortion until the highly variable point of fetal “viability,” which the Court described as “the interim point at which the fetus becomes… potentially able to live outside the mother’s womb, albeit with artificial aid.” That point, the court opinion continues, is “usually placed at about seven months (28 weeks) but may occur earlier, even at 24 weeks.” ↩
A recent article from The New York Times noted “… in the first half of 2023, almost a quarter of women living in states with near-total bans – who may have otherwise sought an abortion – did not get one.” ↩
“Total bans” are laws which only allow abortions in extremely limited circumstances, such as when the pregnancy presents a threat to the life or health of the pregnant person, when it results from rape or incest, or when there is a diagnosed “lethal fetal anomaly.” The specific exceptions to abortion bans vary by state. Bans based on gestational duration – often measured as time since the last menstrual period – range from as early as six weeks to the highly variable point of “fetal viability.” ↩
“Standard conditions” of probation and parole are the default conditions that everyone on supervision must abide by. “Special conditions” are additional rules and restrictions that may be imposed separately or on an individual basis. ↩
One important caveat to this finding is that not all states have statewide standard conditions of probation. In some states, probation (or at least misdemeanor probation) is managed at the county or city level instead of by a central state probation agency. In some of these states, standard conditions vary by jurisdiction, or courts may set different conditions for each supervised person. Because collecting standard conditions from every probation department in these states was not feasible, we attempted to gather those from the most populous counties, and used those as proxies – or representatives – of the whole state. See the Methodology for more details. ↩
The use of “women” reflects the gender binary inherent to the data, which come from administrative sources that report male and female sex as opposed to gender identity. These sources therefore obscure the numbers of intersex, nonbinary, and transgender people on probation and parole who are able to become pregnant but are categorized in the data as “male.” The probation and parole restrictions we detail are not gender-specific, which means they also limit these individuals’ ability to access abortion care in the same ways we discuss in this briefing. ↩
This figure includes only women on probation in the four states where only probation conditions restrict travel (Ariz., Maine, Mass., and Wyo.), only women on parole in the two states where only parole conditions restrict travel (Ala. and Iowa), and both populations in the 34 states where both probation and parole conditions restrict travel. Our analysis excludes federal probation and post-release supervision populations because we don’t have data showing how women under federal supervision are distributed across the states. The data source for all probation and parole populations is the most recent available (from 2022), the Bureau of Justice Statistics report Probation and Parole in the United States, 2022. See the Methodology for details. ↩
We excluded federal probation and post-release supervision because people can live in any state under federal supervision, and we don’t have data showing how women are distributed across the states. ↩
Four states – Kan., Ky., Miss., and Vt. – have statutes or standard conditions that transfer discretionary power to determine the boundaries of an individual’s travel restrictions to probation officers or the court. The language used in these cases varies: “My designated area of supervision is [blank] and I will not leave this area without my officer’s permission” (Ky.); “the defendant shall… remain within a specified area as directed” (Miss.); and “Your probation officer may restrict or prohibit travel to any state…” (Vt.). In Kansas, the statute related to probation conditions lists 14 conditions that the court “may” impose, which include most of the common standard conditions found elsewhere, among them, “remain within the state unless the court grants permission to leave.” This is not listed as a mandatory condition, but the statute is clearly written to give district courts the most control over conditions, and the sample conditions documents we found included travel restrictions. Because the rules in each of these states suggest even greater decision-making power than the one-size-fits-all standard conditions, we include these among states that require permission in our analysis. ↩
As of 2022, Maine no longer has a parole program, according to the Bureau of Justice Statistics (previously, parole was available to those sentenced before May 1, 1976 – that is, before the state abolished discretionary parole.) We did not count Maine among the states with standard conditions restricting travel for this reason, but Wiggins, et al. (2021) report that as of 2020, Maine, too, had a standard condition of parole restricting out-of-state travel. ↩
For a 2015 law review article, probation expert Ronald Corbett requested information from members of the National Association of Probation Executives about the standard and special conditions imposed in their jurisdictions. The sample he received showed a range of seven to twenty-four standard conditions in each jurisdiction, plus three to five special conditions. In the same article, Corbett includes this comment from a 2014 interview with a retired Texas Probation Director: “…we have witnessed the growth in the number of special conditions of probation, and now it is not uncommon for offenders to be saddled with up to a couple of dozen.” ↩
The other option is to arrange a “self-managed abortion” – that is, “an abortion that takes place outside of the formal medical system, through any number of means, such as a medication regimen, herbs, or other long-standing cultural practices,” as the Community Justice Exchange and Repro Legal Defense Fund describe it in Dobbs Was Not The Beginning. Of course, self-managed abortions come with their own legal risks and logistical barriers, which that organizing guide explains. ↩
A recent article in The New York Times noted that “Many traveling patients faced multiday trips, lost income and child care costs.” ↩
In Maine, for example, 17-A MRS §1807(8) states, “…the Department of Corrections may impose on a person applying for such permission an application fee of $25. …Permission to leave may not be denied or withdrawn solely because the person is not able to pay the application fee or the additional fee. When a person fails to pay a fee imposed under this subsection, the department may refuse to process the application or may withdraw permission to leave if the failure to pay is attributable to the person’s willful refusal to pay or to a failure on the person’s part to make a good faith effort to obtain the funds required for the payment.” ↩
For instance, people on probation or parole in Missouri – a state with a total abortion ban – are advised that “you are required to discuss your travels with your Probation and Parole Officer at least 15 days in advance to allow time for the proper paperwork to be prepared.” ↩
As we detail in the linked briefing based on our analysis of the National Survey on Drug Use and Health (NSDUH), people under community supervision report substance use disorders at four times the rate – and mental health disorders at twice the rate – found in the general U.S. population. Twenty-five percent of people on probation and 27% of people on parole were uninsured at the time of the survey, even though many have incomes low enough to qualify them for Medicaid. Public health researchers Winkelman, Phelps, Mitchell, Jennings, & Shlafer (2020) analyzed the same survey data (but from 2015-2016) and found that people under community supervision are more likely to report fair or poor health, more chronic conditions, a diagnosis of COPD, hepatitis B or C, or kidney disease than people in the general population. The community supervision population also has higher rates of disabilities, with particularly high rates of cognitive disabilities. ↩
At the request of the Georgia-based Community Over Cages Coalition, the Prison Policy Initiative examined the proposal for a new jail and found serious shortcomings.
UPDATE: On July 11, 2024, the Fulton County Board of Commissioners voted to scrap its $2 billion plan to build a new jail, marking an important victory for the advocates who opposed the proposal. Learn more here.
The overuse of pretrial incarceration hurts communities, and Fulton County is no exception. Pretrial incarceration undermines public safety by increasing the likelihood that people will be arrested in the future by up to 21%. It also harms employment and housing rates, increases overdoses and suicides, and undermines the presumption of innocence by increasing guilty pleas and sentences. These harms fall squarely on the shoulders of Fulton County’s Black and Brown residents, who make up a disproportionate number of people in the jail.
The feasibility study fails to consider alternatives to new jail construction. For example, the study fails to sufficiently consider the possibility of renovations to the existing jail or the impact of decarceration efforts. It also does not take into account the fact that crime rates in Fulton County are falling, not rising.
The feasibility study ignores the reality that a massive new jail would likely exacerbate its existing staffing issues. The feasibility study claims that updating the jail will completely solve staffing shortages and attempts to highlight other jails around the country as “model jails.” However, we show that even in these updated “model” jails, staffing concerns run rampant, jail deaths are on the rise, and conditions in these new facilities are still bad enough that they are leading to human suffering and costly lawsuits. The reality is that there is no “model jail”, and creating a massive new facility will make staffing problems worse, not better.
The Community Over Cages Coalition was formed to oppose the county’s proposal to build a $2 billion new jail. The coalition includes legal experts, people with lived experience in Fulton’s legal system, healthcare providers, and community organizers and activists with a shared goal of a Fulton County that enables the health and safety of all communities.
Is your community seeking to build a new jail or expand the capacity of its existing facility? We’re happy to help you push back on their arguments (drop us a line to tell us about your fight). There is no need to wait, though. We have created a how-to-guide with tips for pushing back on “jail needs assessments” that local leaders put together to justify the construction and provide strategies for pushing back on false or misleading arguments they’re making.
If you're a journalist who's been stonewalled while seeking public records about deaths in custody, you are not alone. We offer tips for requesting information and strengthening your story against HIPAA-related denials.
Prisons and jails often claim that the Health Information Portability and Accountability Act (HIPAA) privacy rule prevents them from sharing information about in-custody deaths with the press, or even with families of people who have died. Since these agencies have also been known to invoke HIPAA in denying information not remotely related to health,1 one might assume that many of these denials have no clear legal basis. But because prison oversight is abysmally weak — and because most people impacted by prisons’ lack of transparency are too poor to fight back — not a lot of legal precedent exists around what prisons and jails must or must not share.
The good news is that despite the grey area around health privacy law, HIPAA obstacles don’t have to spell the end of an investigation into deaths behind bars. This briefing lays out the HIPAA-related challenges for journalists investigating deaths in custody, offers tips for overcoming those challenges, and suggests ways to strengthen your stories against information denials.
HIPAA and common questions about in-custody deaths
HIPAA is a federal law passed in 1996 to set legal standards around healthcare coverage, efficiency in sharing of healthcare information, and processes for preventing healthcare fraud and data theft. Its Title II “privacy rule” prohibits healthcare providers — implicitly including confinement facilities — from sharing their patients’ “protected health information” (or PHI) with anyone other than approved family members and sometimes healthcare authorities.
When information requests remotely involve issues related to health, prisons and jails tend to default to denying journalists access to information. But journalists have the power to push corrections agencies to be more transparent about in-custody deaths.
Here are some of the obstacles you might encounter when asking common questions about deaths — and tips for getting around them:
“Did someone die in this prison recently?”
While you may be denied even this most basic information, it’s worth pointing out that HIPAA applies only to someone’s personally identifiable health information, which generally does not include the fact that someone died. Furthermore, a jail or prison refusing to release this information upon request is a red flag, given that at least 15 prison systems proactively make this information public:
How different states handle public disclosure of in-custody deaths
We examined state departments of corrections’ websites (and when appropriate, the websites of other agencies such as the Attorney General’s office) to determine their standard practices around reporting deaths in custody to the public.
Utah DOC appears to archive death notices at the beginning of each new calendar year, but those looking for information on deaths in previous years can use Archive.org; e.g. deaths in 2023 are here.
“What was the deceased person’s name?”
Many prison systems post the names of the deceased as a matter of policy (see table above). If a prison or jail refuses to provide names, you may want to point out to them that other prison systems have done so without running afoul of the law. If that doesn’t work, you should consider challenging the DOC’s policy. When Hawaii’s Department of Public Safety refused to release the names of people who died during COVID-19, the Honolulu Civil Beatsued the department and won, with a Hawaii Circuit Court ordering the Department to release the names of people who die in custody going forward.
“What was the cause of death?”
It’s common for officials to deny reporters information related to the cause of someone’s death, often citing HIPAA as the reason — and in many cases, this may be a legitimate claim. However, you’re wise to remember that several different documents are created when someone dies behind bars. There may be a death certificate, coroner’s report, medical examiner’s report, “death review” or incident reports, and/or an autopsy. While not every death triggers an autopsy, autopsies are public records in many states, so they are typically easier to obtain.
Journalists should also keep in mind that if a prison or jail refuses to release information and vaguely cites “health privacy law,” it’s worthwhile to clarify which law. Most often, the answer will be HIPAA, but some states have their own laws that go beyond HIPAA’s prohibitions to exclude additional information from public records disclosure.
Making the most of your public records request
Here are a few ways to maximize your chances of a fruitful records request and to fight back against stonewalling:
Review the basics about public records laws concerning the criminal legal system in your state before you file. (We wrote a 50-state guide to filing public records requests to criminal legal agencies.)
Call the public records official at the DOC or jail before you file to get an idea of what records exist and in what format. Ask them what kinds of records and reports the agency creates around deaths in custody, including any records of internal investigations of deaths.
Find out what kind of reporting about healthcare is made between the correctional agency and other parties. If the jail or prison uses a private healthcare provider, what kinds of reports does the company have to make to the agency regularly? The prison/jail may also make reports to hospitals it partners with and to any state or local oversight bodies. Reports that aggregate data without personally identifiable information may be easier to release than records pertaining to individuals.
If possible, clarify in your records request that you do not intend to seek personally identifiable health information and ask for the agency to redact any such information.
Appeal denials to your Attorney General’s public records ombudsman, whose job it is to determine if denials of public records requests were legitimate. If you think a prison or jail is denying you information that is not necessarily protected by HIPAA, it’s worth at least telling the ombudsman what is going on. (You may also want to alert prison oversight officials in your state when you get an unreasonable denial.)
Tip: If your public records requests are denied or delayed, you can also try searching the jail or DOC’s website for the records you’re looking for.2 Occasionally, correctional agencies store sensitive documents on their web server without strong security.
Privacy law obstacles can be the beginning, not the end, of a good story
Being stonewalled is frustrating, but if getting the information you want seems impossible, broadening or adjusting the focus of your story can allow you to hold the prison (or jail) system accountable even in the face of information denials. We suggest that you:
Look for patterns of medical neglect rather than individual cases. There may already be public evidence of neglect in the prison or jail system you’re investigating. States and large counties often audit correctional facilities’ healthcare systems, and the auditor/comptroller, Inspector General, and Attorney General’s office may have information about prior medical issues in the facility. (For an example of a story that uses evidence from local audits, see Arizona Luminaria’s reporting on jail deaths in Tucson.) You can also search legal databases like PACER for the name of the facility you’re investigating, or the names of any healthcare companies contracting with the facility, to find evidence of prior healthcare issues, which could put the deaths you’re investigating into context.
Connect with families. If you’re having trouble getting basic facts about in-custody deaths, chances are that families are, too. Ask the families of people who died in the facility about their experiences with the prison or jail after their loved ones’ deaths. Journalists have written powerful stories about correctional agencies stonewalling families who ask for information, or waiting hours or days to tell them about deaths or injuries.
Conversely, it’s also possible that the jail or prison will release medical records to the family that they wouldn’t release to the media. Building strong relationships with impacted communities and working with them to pressure the facility to release records may help you overcome HIPAA-related obstacles.
Talk to prison and jail oversight officials. Ask these officials if they have had trouble getting information about deaths and medical care in the facility. Again, a corrections agency that keeps journalists in the dark about deaths is probably creating similar obstacles for others. The Sacramento Bee, for example, has reported skillfully on the barriers facing Sacramento’s Inspector General.
Beyond the story: pushing for systemic change
Obstacles to transparency around prison conditions often go beyond a single story, revealing a larger problem with corrections agencies stonewalling journalists who are working in the public interest. News organizations, particularly in partnership with impacted communities, have the power to change that. In Massachusetts, for example, news organizations campaignedsuccessfully for public records reform.
Remember: Journalists do critical work to bring deaths behind bars to light, but they’re far from the only ones fighting the lack of “sunlight” in jails and prisons. The more creative you can be with your investigations, the greater the chances that family members, oversight officials, and even corrections officers will come forward to strengthen your story — and, hopefully, help you build the case that in-custody deaths should not be obscured by health privacy law.
Did you find this briefing helpful? Have a story to share? Let us know through our contact page.
Footnotes
For example, the Kansas Department of Corrections cited health privacy law when denying a KCUR reporter’s request for an internal email about a disciplinary writeup. ↩
A general search on the agency website for PDF files can be fruitful. To Google for PDFs on a specific website — for example, the Louisiana Department of Corrections — use the following syntax: “site:doc.louisiana.gov filetype:pdf.”) ↩
Last week, former President Donald Trump was convicted of 34 felonies in New York — becoming the first former (and perhaps future) president to be convicted of a felony. While the conviction will not prevent him from pursuing the presidency, he nonetheless joins over 19 million people in America with felony convictions. Unlike the vast majority of people with this status, Trump’s immense wealth and power will likely insulate him from the struggles most will face in securing much less prestigious jobs. That’s because many states permit if not outright facilitate bias against hiring people with records — especially roles that require professional licenses.
Criminal records lock people out of the job market, making everyone less safe
Most people who have criminal records are not billionaire reality TV stars or real estate moguls with wealth and connections to fall back on. For them, getting a job is a matter of survival, and having a record greatly diminishes their chances of success. That’s because a variety of policies across the country effectively disqualify and deter people with records from obtaining employment.
This dynamic traps people in a vicious cycle of poverty and policing that makes everyone less safe in the end. Nearly four out of every 10 people in state prison — most of whom had past convictions — were jobless in the month leading up to their arrest. Black people (46%) and women (53%) in state prisons were especially unlikely to have been employed during that time. Meanwhile, more than 600,000 people return to their communities from prison each year and struggle to secure employment, housing, healthcare, and care for children in large part due to restrictions imposed on those with criminal records. Even though people in this situation are more likely to be actively seeking jobs than the general public, they are far more likely to be rejected by employers and report unemployment at a rate five times higher than the general public. These differences are rooted in discriminatory policy choices, not individual aspirations or capabilities.
Even when people in these circumstances do find work, they are often relegated to the most insecure and low-paying positions. Licensed occupations can provide a path to better job security, but that option is foreclosed by counterproductive policies such as these.
State laws ban people with felony convictions from holding many jobs
State laws and policies give employers ample opportunities to reject potential workers simply on the basis of their having been convicted of a crime. Though explicit employment bans that prohibit hiring from these populations have been modified in some states in recent years thanks to tireless advocacy, decision-makers in most places still enjoy wide discretion to exclude people from certain kinds of work on these grounds.
This is especially true for occupations that require professional licensing, such as bartenders, exterminators, healthcare workers, and car salesmen. People who want to work in real estate — either as agents or developers — are often required to submit to criminal background checks as part of the licensing process, too. Though these bans most frequently target people who are convicted of felonies in particular, certain misdemeanors can also preemptively disqualify people as well.
Whether explicit or discretionary, occupational licensing restrictions for people with felonies on their records are widespread. Just a few examples include:
Pest control in North Carolina: No one can be issued an ID or work as an estimator, serviceman, salesman, solicitor, or an agent for any licensee if they have been convicted of a felony within three years of their application.
Car sales in Mississippi: People who want to sell cars must have “good moral character, honesty,” and “high ethical standards” — qualities that are “presumptively” not met if they were, among other things, convicted of a felony or certain misdemeanors.
Bartending in Florida: Licensed bars cannot employ anyone as a manager, person in charge, or bartender who has been convicted of a felony anywhere in the U.S. in the past 5 years.
Any health professional in Virginia: Previously licensed healthcare workers face mandatory license suspensions if convicted of a felony. This includes early-career positions like certified nursing assistants, veterinary technicians, and peer recovery specialists. Nurses, in particular, could be prevented from receiving licenses or certifications for any felony or misdemeanor involving “moral turpitude.”
Firefighters in Florida: Firefighters must not have been convicted of certain misdemeanors, a felony, or any crime punishable by at least one year of imprisonment.
Even indirect employment bans have devastating effects
Even when jurisdictions do not explicitly ban people with felony convictions from obtaining occupational licenses, they typically give licensing agencies so much discretion that they can deter potential job-seekers with records from applying. If you have a record but want to work as a plumber’s apprentice in Texas, you have to fill out an additional extensive “Supplemental Criminal History Information” form. In New York, meanwhile, people with criminal records are not explicitly banned from working in the real estate profession, but they are not entitled to receive real estate licenses without the express permission from the Secretary of State, either. Hurdles such as these are enough to keep most people from applying in the first place.
In other places, discretionary bans are designed to target people who have felony convictions that are “directly related” to the work they would be doing. In Texas, for example, Trump’s convictions for falsifying business records could easily be construed as grounds to deny him a license to handle insurance, taxes, or (as he loves to do) hiring and firing people as an employee for a professional employer organization.
Conclusion
It’s important to reiterate that most people with criminal records have to navigate these challenges with far fewer resources and connections, and far less power, than Donald Trump. Though he officially has a felony record, he will not encounter the majority of these barriers to making money, let alone surviving. In the coming months, we will likely see clear examples of how rich and powerful people like Trump are insulated from the consequences of a criminal record that millions of the most vulnerable people in society — typically the primary targets of the criminal legal system — are forced to endure each day. This will ultimately not be a lesson in equality in justice, but a reminder of the freedom from punishment that people in Trump’s position enjoy even in the rare instances that they are convicted of their crimes.
That being said, the lesson we take from Trump’s conviction should not be that the system needs to get tougher. In fact, the opposite is true: the fact that such employment policies are counterproductive to basic safety interests and are so unequally applied are strong reasons to lower barriers to work for the average person with a criminal record — not erect new ones. At the very least, anyone who believes that a felony conviction shouldn’t disqualify someone from the most powerful office on the planet must also agree that it makes no sense to prohibit others with felony convictions from serving in more ordinary roles as plumbers, pest control workers, and bartenders. Fortunately, there are plenty of measures states can take to make life easier for people with criminal records:
Enact occupational licensing reform: States should reform their licensing practices to eliminate the automatic rejection of people with felony convictions.
Ban blanketed employer discrimination: Criminal records are not good proxies for employability. Additionally, because of racially disproportionate incarceration rates, organizations who discriminate against people with criminal records may also be contributing to racial discrimination and are therefore subject to litigation under Title VII of the Civil Rights Act of 1964.
Implement automatic record expungement procedures: Having an automatic mechanism for criminal record expungement that takes into account the offense type and length of time since sentencing would, in the near term, help formerly incarcerated people succeed and would, in the long term, promote public safety.
Issue a temporary basic income upon release: Providing short-term financial stability for formerly incarcerated people would operate as an investment, helping to ease reintegration and provide public safety and recidivism reduction benefits that would result in long-term cost savings.
Make bond insurance and tax benefits for employers widely available: Some governmental bodies offer insurance and tax incentives for employers who hire people with criminal records, protecting against real or perceived risks of loss. Increasing the availability of such programs would provide hesitant employers with added financial security.
For more information about the kinds of policies that prevent people with criminal records from obtaining occupational licenses, the various collateral consequences of those policies, and state-by-state comparisons, the following organizations offer excellent resources:
As we’ve reported in the past, LGBTQ+ people are overrepresented throughout the criminal legal system, from their high rates of juvenile justice involvement to the long sentences they often receive as adults. While little government data exists about the over-incarceration of this group, research is slowly emerging that shows how a multitude of forces push LGBTQ people into jails and prisons at highly disproportionate rates. This year, for Pride Month, we gather a few of the most striking facts about the criminalization of queer youth and adults.
Lesbian, gay, and bisexual people are more than twice as likely to be arrested as straight people — and lesbian and bisexual women, specifically, are more than four times as likely to be arrested as straight women. Scant research exists about the causes of these disparities, but it’s likely that drug law enforcement, laws against sex work, and the criminalization of homelessness are largely to blame.
40% of homeless youth are LGBT. Stigma, conflict, or a lack of acceptance at home drive many LGBT youth onto the streets — funneling many of them into the juvenile justice system, where 20% of the population identifies as LGBTQ.
35 states have laws against behaviors that can potentially spread HIV.These laws — carryovers from the height of the HIV pandemic — punish people for exposing others to the illness even if no transmission occurs, and can lead to people being criminalized for simply having sex while HIV-positive.
One in six trans people have been incarcerated at some point, including nearly half of Black trans people. This is compared to about 3% of the total adult U.S. population in 2010 that had ever been in prison, and almost 10% of Black adults.
44% of trans people in prison have been denied access to hormones they requested, according to a 2015 national survey by Black & Pink. Denying access to hormone therapy is just one way that prison policies fail trans people, as we reported in a 2017 briefing.
85% of LGBTQ incarcerated people have been put in solitary confinement, that same 2015 survey found. This is often done in the name of “protecting” queer individuals behind bars, despite the well-documented, long-lasting harms of solitary confinement.
Readers interested in learning more about the forces driving LGBTQ+ into jails and prisons may also be interested in these recent reports:
Lambda Legal’s 2022 national survey of 2,546 LGBTQ+ people and their experiences with the criminal legal system;
Vera and Black & Pink’s new report Advancing Transgender Justice, based on a large-scale survey of transgender people about their experiences in state prisons;
Our 2022 briefing about transgender respondents to the Survey of Prison Inmates, including five data visualizations about the demographics of this group.
Yesterday, U.S. Senator Cory Booker and Senator Elizabeth Warren introduced the Families Over Fees Act, a bill targeting “junk fees” in prisons and jails. This piece of legislation would take an important step toward ending the exploitation of incarcerated people and their families, and we urge lawmakers and the public to support its passing.
Incarcerated people are frequently subjected to hidden and unnecessary fees when they make important purchases and transactions, such as paying to call their loved ones. The Act would authorize the Federal Trade Commission to establish rules prohibiting these fees. It would also require prison and jail service providers to disclose these fees upfront, and would create legal protections for people impacted by junk fees looking to bring lawsuits.
“As we have recently noted, billions of dollars each year are mined from incarcerated people, their families, and the often economically disadvantaged communities from which they come. Much of this money comes from charging massive predatory junk fees for things like basic needs and communication,” said Sarah Staudt, Policy and Advocacy Director at the Prison Policy Initiative. “These fees are inflicted upon incarcerated people and their families and used to line the pockets of prison profiteers who have little competition and even less oversight. The Prison Policy Initiative is happy to support the Families Over Fees Act which places people above profits, and offers much needed consumer protections for incarcerated people and their communities.”
As Congress considers this bill, we also remind state and municipal lawmakers that they can take action to stop predatory fees locally through diligent contracting with prison service providers. Policymakers should refer to these resources:
Our best practices guides for correctional phone, video, and tablet contracts
Our explainer about deposit fees and how prisons can prohibit them
New report details how prisons and jails have misused money in "Inmate Welfare Funds" to pay for bounce houses, ham gift cards, and even shooting range memberships.
May 6, 2024
Easthampton, Mass. — In virtually every state, incarcerated people and their families subsidize the operation of prisons and jails when they pay for phone calls and commissary items, or make deposits into their loved ones’ accounts. While prison profiteers like Securus and Keefe Group are now well known, less widely known is that the money families pay to these companies is shared with prisons and jails themselves — and kicked back into so-called “Inmate Welfare Funds” with little accountability or transparency.
This morning, the Prison Policy Initiative released a new report called Shadow Budgets: How mass incarceration steals from the poor to give to the prison. Our report finds that at least 48 state prison systems and the federal Bureau of Prisons have “Inmate Welfare Funds,” and lays out how these accounts — which often receive millions of dollars a year — are used. We found that all too often, this money:
Is used to pay for capital projects, such as prison construction, or for basic essentials for incarcerated people — items that prisons and jails should be paying for
Is governed by loose regulations, under which virtually any spending is “justified”
Sits unused despite an urgent need for in-prison programming
While the focus of Shadow Budgets is on prisons, the report also collects anecdotes from welfare funds in local jails. This evidence suggests jails are prone to using incarcerated people’s money in even more egregious ways than prisons, with expenditures like:
$40,000 on gift cards to The Honey Baked Ham Company for jail staff (Fulton County, Georgia)
$300,000 on gun range memberships for staff (Dauphin County, Pennsylvania)
$217,000 on guns, bullets, and vests for law enforcement (Pinal County, Arizona)
“Welfare funds are yet another example of how our failed system of mass incarceration burdens the poorest members of society the most,” said report author Brian Nam-Sonenstein. “Prisons and jails need to be held accountable for how they use welfare funds to fill budgetary gaps — and when their budgets fall short, they should be incentivized to decarcerate facilities rather than exploit poor families.”
Our report lays out policy recommendations for state and local governments to end the worst misuses of welfare funds while protecting the basic needs they all too often pay for. In particular, it urges states to ban the use of welfare fund money for construction or staff costs, to meet incarcerated people’s needs through the general appropriations process, and to guarantee that incarcerated people and their families have a say in how welfare fund money is spent. Above all, though, the report emphasizes that prisons and jails should focus on reducing the number of people behind bars to address budgetary shortfalls rather than sapping money from incarcerated people and their families to fill the gap.
In our report and companion guide for press, we encourage journalists to investigate the welfare funds in state prisons and particularly in local jails. We make details about every state prison system’s welfare fund available in Appendix A, explaining how these funds are accrued, spent, and overseen. Meanwhile, Appendix B lists some specific examples of expenditures, prohibited expenses, and regulatory language across the various welfare funds we investigated. For those interested in investigating welfare funds in local jails, Appendix C contains a list of state statutes, some of which apply to sheriffs and county facilities.
We offer lessons learned from developing our new report, Shadow Budgets, to encourage journalists to investigate welfare funds in their local prison or jail systems.
Our new report Shadow Budgets: How mass incarceration steals from the poor to give to the prison explains that prisons and jails squeeze revenue out of incarcerated people and their families via paid telecommunications services, commissaries, money transfers, and disciplinary fines, then funnel it into “Inmate Welfare Funds” and use the money to cover the costs of incarceration. While corrections officials claim that these funds go to benefit incarcerated people, money from these accounts often sits idle — or worse, is spent on perks for correctional staff, like special meals or gun range memberships. Even when the funds are put toward improving conditions behind bars, the spending typically meets a need that can and should be paid for out of the agency’s general budget — not money extracted from incarcerated people.
Shadow Budgets identifies welfare funds in 49 prison systems, explains what rules govern these funds, and discusses some of the ways this money has been misused. As we discuss in the report, however, inmate welfare funds are not as transparent or accountable as general correctional budgets. Outside actors like state auditors — and investigative journalists — play a key role in uncovering how states and counties use this money. In this blog post, we offer lessons learned from developing our report to encourage journalists to investigate these funds in their local prison or jail systems.
Investigating welfare funds: what records to request, and how
Not all jails and prisons have welfare funds, and those that do may call it something else. In some places, they don’t appear to have formal names at all. (And while most funds draw revenue from commissary and/or telecom services purchases, some may have other sources.) If Appendix A of our report doesn’t provide these details about the jail or prison system you’re investigating, you can call the agency itself and ask. You might want to ask where kickbacks from telecom and commissary services are deposited, or whether there is a fund for the general welfare or benefit of the incarcerated population. Alternatively, you can consult county, municipal or state policies (for example, this one for the Michigan Department of Corrections). Information about funds in local jails may also be listed in state correctional standards, if you live in a state where the department of corrections has authority over jails.
The most important questions you’ll investigate about the welfare fund are: How much money is in the fund, how is it being spent, and who gets to decide? You will likely have to submit a public records request to find out; for tips on filing public records requests to corrections agencies, see our records request guide.
Specifically, we recommend that you request:
An itemized list of purchases made from the inmate welfare fund (try to go back two or three years, if possible, to get a representative dataset).
Balance sheets for the account. As we discuss in our report, many if not most prison systems sit on large amounts of revenue even as key programs for incarcerated people go underfunded. The balance sheet will show if the jail or prison is actually using the money. Again, asking for a few years of data will help understand whether balances are carried over.
Any audits or fiscal reports on the funds. Depending on your county and state, you may instead want to request this information from the auditor’s office, the county/city board or council, or the state department of corrections. (The state or local policies governing the welfare fund should tip you off as to what agency to reach out to about audits and fiscal reports.)
If the fund has an oversight committee — which should be mentioned in the state/local policies discussed above — request information about how often the committee meets, when its last meeting was, and who sits on the committee. If the jail or DOC cannot provide this information, it’s possible that the committee is not active. (On the other hand, if the committee is active, consider contacting them as a source for your story.)
You may also want information about the sources of money in the fund. In particular, we advise locating the jail/prison’s contracts with its commissary or telecom providers, where agreements about revenue-sharing are typically laid out. We’ve made hundreds of contract documents available to the public in our Correctional Contracts Library.
We also suggest asking the jail or prison whether incarcerated people have any say in how the inmate welfare fund is used. Since these funds are theoretically dedicated to benefiting incarcerated people, and are paid for by incarcerated people, it’s good to know to what extent administrators consider their input.
How to assess uses of welfare fund money
Most jails and prisons have regulations or statutes governing what the money in their inmate welfare fund may be used for. (Appendix A of our report contains details on the rules in several prison systems.) Sometimes, corrections officials use the money in ways that may violate these rules, like Pinal County, Ariz. Sheriff Mark Lamb, who spent $200,000 in revenue from jail phone calls and commissary services on “guns, bullets and vests” for law enforcement officers. John Washington of Arizona Luminaria, who broke the story, found that the state statute governing the welfare fund only allowed the money to be used for “the education and welfare of inmates.”
It’s worth noting, however, that the Pinal County Jail’s fund also paid for “recreational equipment, clothing, and internet services for people who are incarcerated.” These kinds of expenditures are legal under Arizona’s statute, but they are not laudable uses of poor people’s money. Jails have a responsibility to make sure the people in their care are clothed. And to the extent that “internet services” are necessary for people in jail to have access to law libraries and the courts, they are a constitutional right, not a privilege.
When assessing uses of welfare fund money, consider the following questions:
Is the jail or prison forcing incarcerated people to cover the cost of their own basic needs?
Is it appropriate to force many of the lowest-income people in the county or state (i.e. the majority of people in jail, and their families) to pay for these things?
Why is the county or state not paying for these goods, services or programs out of its general budget?
Keep in mind that it’s not always easy to tell whether uses of these funds are legal or not. As we discuss in our report, many state statutes include wiggle words like “primarily” or “including but not limited to,” effectively giving corrections officials free rein to spend the money any way they like. Just because an expenditure is technically legal, of course, doesn’t mean it is right.
Who else to talk to
Incarcerated and formerly incarcerated people and their families
If you’re able to contact people behind bars or their loved ones, ask them whether they have heard of the inmate welfare fund (make sure to use whatever term the jail or prison uses). You can also ask if they know of any programs or benefits for incarcerated people paid for with that money.
In writing Shadow Budgets, we talked to several formerly incarcerated people and advocates for incarcerated people about their views of welfare funds. Many saw the funds as regressive and exploitative, while many also worried about them being dismantled, and were concerned that if they did not exist, the needs met with those funds would go unfulfilled. While there is no easy answer for what to do about these funds, incarcerated people’s perspectives are crucial to understanding what the funds are or are not accomplishing.
State and local elected representatives
It’s likely that many elected lawmakers will never have heard of inmate welfare funds before. Nevertheless, because the funds are governed by state and local regulations, lawmakers can and should be held accountable for inappropriate uses of the money.
We also suggest asking state elected officials broader questions about welfare funds, such as:
Are you concerned about prisons and jails having large discretionary budgets that are outside the purview of the legislature?
Why does the state not choose to fund these services and programs with money from the regular appropriations process?
Recommended reading: investigative journalism about inmate welfare funds
These stories focusing on or involving welfare funds may give you other ideas about questions to explore, or sources to contact for your story:
PennLive’s 2023 investigation into the Dauphin County Jail’s use of telecom and commissary revenues (via the jail’s welfare fund)
Pacific Sun’s 2022 reporting on the welfare fund in the jail in Marin County, California
WSB Atlanta’s 2023 story about misuses of money in the Fulton County Jail’s welfare fund
Arizona Luminaria’s storyseries about Pinal County Sheriff Mark Lamb’s use of welfare fund money to buy guns and ammunition for law enforcement
Much like other aspects of prisons and especially of local jails, inmate welfare funds are rich territory for journalistic investigations because they have so little transparency. Unless state or local lawmakers request visibility into these funds, they can be spent more or less however correctional officials wish, meaning that hundreds of millions of dollars in public spending nationwide is virtually unaccounted for. By investigating welfare funds, journalists can shine a light not only on a little-known form of public spending, but also on the broader priorities of jail and prison officials. Transparency into these funds can spark important conversations about whether these officials’ stated commitment to incarcerated people’s wellbeing is reflected in their use of resources.
If you’re a journalist and have any questions about our report or about this guide, please don’t hesitate to write to us through our contact page.
We've updated the data tables and graphics from our 2017 report to show just how little has changed in our nation's overuse of jails: too many people are locked up in jails, most detained pretrial and many of them are not even under local jurisdiction.
One out of every three people behind bars is being held in a local jail, yet jails get almost none of the attention that prisons do. In 2017, we published an in-depth analysis of local jail populations in each state: Era of Mass Expansion: Why State Officials Should Fight Jail Growth. We paid particular attention to the various drivers of jail incarceration — including pretrial practices and holding people in local jails for state and federal authorities — and we explained how jails impact our entire criminal legal system and millions of lives every year. In the years since that publication, many states have passed reforms aimed at reducing jail populations, but we still see the same trends playing out: too many people are confined in local jails, and the reasons for their confinement do not justify the overwhelming costs of our nation’s reliance on excessive jailing.
People cycle through local jails more than 7 million1 times each year and they are generally held there for brief, but life-altering, periods of time.2 Most are released in a few hours or days after their arrest, but others are held for months or years,3 often because they are too poor to make bail.4 Fewer than one-third of the 663,100 people in jails on a given day have been convicted5 and are likely serving short sentences of less than a year, most often for misdemeanors. Jail policy is therefore in large part about how people who are legally innocent are treated, and how policymakers think our criminal legal system should respond to low-level offenses.
Figure 1. The frequent practice of renting jail cells to other agencies makes it difficult to draw conclusions from the little data that is available. This update to our 2017 report offers an updated analysis of national data to offer a state-by-state view of how jails are being used and we continue to find that pretrial populations continue to drive jail growth across the country. The data behind this graph is in Appendix Table 1.
Pretrial policies have a warehousing effect
The explosion of jail populations is the result of a broader set of policies that treat the criminal legal system as the default response to all kinds of social problems that the police and jails are ill-equipped to address. In particular, our national reliance on pretrial detention has driven the bulk of jail growth over the past four decades.
More than 460,000 people are currently detained pretrial — in other words, they are legally innocent and awaiting trial. Many of these same people are jailed pretrial simply because they can’t afford money bail, while others remain in detention without a conviction because a state or federal government agency has placed a “hold” on their release.
Pretrial detention disproportionately impacts already-marginalized groups of people:
Low income: The median felony bail amount is $10,000, but 32% of people booked into jail in the past 12 months reported an annual income below $10,000.
Black people:43% of people detained pretrial are Black. Black people are jailed at more than three times the rate of white people.
Health problems:40% of people in jail reported a current chronic health condition. 18% of people booked into jail at least once in the past 12 months are not covered by any health insurance.
Mental illness:45% of people booked into jail in the past 12 months met criteria for any mental illness, compared to only 30% of people who had not been jailed.
Experiencing homelessness: While national data don’t exist on the number of people in jail who were experiencing homelessness at the time of their arrest, data from Atlanta show that 1 in 8 city jail bookings in 2022 were of people who were experiencing homelessness.
Lesbian, gay, or bisexual: 15% of people booked into jail in the past 12 months identify as lesbian, gay, or bisexual, compared to 10% of people not booked in the past year.
This confinement creates problems for individuals on a short-term basis and also has long-term effects. Research in different jurisdictions has found that, compared to similarly-situated peers who are not detained, people detained prior to trial are more likely to plead guilty, be convicted, be sentenced to jail, have longer sentences if incarcerated, and be arrested again. And these harms accrue quickly: being detained pretrial for any amount of time impacts employment, finances, housing, and the well-being of dependent children. In fact, studies have found that pretrial detention is associated with a decreased likelihood of court appearance and an increased likelihood of additional charges for new offenses. There is no question that wholesale pretrial detention does far more harm than good for an increasing number of people and communities.
Renting jail space: a perverse incentive continues to fuel jail growth
There are two different ways to look at jail populations: by custody or jurisdiction. The custody population refers to the number of incarcerated people physically in local jails. The jurisdictional population focuses on the legal authority under which someone is incarcerated, regardless of the type of correctional facility they are in. This means that there are people in the physical custody of local jails, but who are under the jurisdictional authority of another agency, such as the federal government (including the U.S. Marshals Service, immigration authorities, and the Bureau of Prisons) or state agencies (namely the state prison system). For example, immigration authorities can request that local officials notify ICE before a specific individual is released from jail custody and then keep them detained for up to 48 hours after their release date. These holds or “detainers” essentially ask local law enforcement to jail people even when there are no criminal charges pending.
State and federal agencies pay local jails a per diem (per day) fee for each person held on their behalf. For example, in 2024, the state Department of Public Safety and Corrections (prison system) pays local jails in Louisiana $26.39 per person per day, and more than 14,000 people in the Department’s custody were in local jails in 2022. The fees paid by different agencies to confine people in local jails range and depend on the contract between agencies: In 2023, the per diem rate negotiated between Daviess County, Kentucky and the U.S. Marshals Service increased from $55 to $70 per person per day. And these per diem fees can rack up quickly: in fiscal year 2021, the U.S. Marshals Service paid North Carolina counties more than $31 million for jail holds, while the Louisiana Department of Public Safety and Corrections spent more than $123 million on their “local housing of adult offenders” program.
In 28 states and the District of Columbia, more than 10% of the jail population is being held on behalf of a state or federal authority. This both skews the data and gives local jail officials a powerful financial incentive to endorse policies that contribute to unnecessary jail expansion. Local sheriffs — who operate jails that are rarely filled to anywhere near their total capacity with people held for local authorities — can pad their budgets by contracting out extra bed space to federal and state governments. To be sure, sharing some jail capacity can be a matter of efficiency: for example, if one county’s jail is occasionally full, borrowing space from a neighboring county may be better than building a larger jail. And, in some states — like Missouri — state law requires that local jails agree to hold people for state or federal agencies. But the systematic renting of jail cells to other jurisdictions — while also building ever-larger facilities in order to cash in on that market6— changes the policy priorities of jail officials, leaving them with little incentive to welcome or implement reforms.
In our 2017 report, we found this phenomenon was most visible in Louisiana, where the state largely outsourced the construction and operation of state prisons to individual parish (county) sheriffs.7 The most recent data suggests that as of 2022, Louisiana, Kentucky, and Mississippi stand out as the worst offenders. In all three states, at least one-third of the state prison population is actually held in local jails (53% in Louisiana, 47% in Kentucky, and 33% in Mississippi).8
Another major consumer of local jail cells is the federal government, starting with the U.S. Marshals Service, which rents about 26,200 jail spaces each year — mostly to hold federal pretrial detainees in locations where there is no federal detention center. In the District of Columbia, South Dakota, New Hampshire, and New Mexico, more than 15% of the statewide jail population was actually held for the U.S. Marshals Service in 2019. Meanwhile, Immigration and Customs Enforcement rents about 15,700 jail spaces each year for people facing deportation.9 In 2019, New Jersey stood out with 16% of the statewide jail population held for immigration authorities, followed by Mississippi (10%).
We should note there is significant geographic variation in just how much of a jail’s population is held for other authorities: more than a quarter of people in rural jails were held for state, federal, or American Indian and Alaska Native tribal governments in 2019, compared to only 11% of people in urban jails.10 The distribution also varies by state, as each has different levels of “excess” jail capacity, and federal officials have specific needs in different parts of the country.
The practice of holding people in local jails for other authorities carries significant personal, social, and fiscal costs, often exposing detained people to the harms of incarceration for longer periods of time than they would be otherwise. Jails are not designed to hold people for any significant period of time; they lack sufficient programming, services, and medical care to house people for months or years.11 This practice also contributes to jail overcrowding, which fuels jail construction and expansion in turn. As scholars Jack Norton, Lydia Pelot-Hobbs, and Judah Schept succinctly put it: “When they build it, they fill it, and counties across the country have been building bigger jails and planning for a future of more criminalization, detention, and incarceration.”
Contextualizing prison and jail population changes during and after the COVID-19 pandemic
Most of the data used in this report come from the Bureau of Justice Statistics’ Census of Jails, which was most recently administered in 2019 and published in 2022 (see the methodology for sourcing details). However, the prison population data used to create our state-specific graphics are from 2022 and reveal the dramatic impact of the COVID-19 pandemic on prison populations in many states over time. They show that state and federal prison admissions dropped 40% in the first year of the pandemic (2020). While not reflected in the 2019 data used in this briefing, we know that by June 2021, jail admissions were down 33% compared to the 12 months ending in June 2019. Before 2020, the number of annual jail admissions was consistently 10 million or more. Because these declines were not generally due to permanent policy changes, we expect that both prison and jail admissions will return to pre-pandemic levels as cases that were delayed for pandemic-related reasons work their way through the court system.
Recommendations
Our recommendations from 2017 remain just as relevant today, and can help state and local officials move away from using jails as catch-all responses to problems that disproportionately impact poor and marginalized communities:
Change offenses and how offenses are treated
States should reclassify criminal offenses and turn charges that don’t threaten public safety into non-jailable infractions.12
For other offenses, states should create a presumption of citation, in lieu of arrests, for certain low-level crimes.13
For low-level crimes where substance abuse and/or mental illnesses are involved, states should make community treatment-based diversion programs the default instead of jail.14 States should also fully fund these diversion programs.15
Help people successfully navigate the criminal legal system to more positive outcomes
States should immediately set up pilot projects to test promising programs that facilitate successful navigation of the criminal legal system. Court notification systems and other “wrap-around” pretrial services often increase court appearances while also reducing recidivism.16
Change policies that criminalize poverty or that create financial incentives for unnecessarily punitive policies
States should eliminate the two-track system of justice by abolishing money bail. States that are not ready to take that step should start by abolishing the for-profit bail industry in their state, and providing technical resources to existing local-level bail alternative programs to help these programs self-evaluate and improve state-level knowledge.17
Address the troubling trend of renting jail space
States should evaluate whether the renting of local jail space to state and federal authorities is steering local officials away from effectively addressing local needs.18
Updated state-specific graphics
In 2017, we argued that if lawmakers want criminal legal system reform, they must pay attention to jails. Years later, this remains true. To help state officials and state-level advocates craft reform strategies appropriate for their unique situations, this report offers updated data and state-specific graphs on conviction status, as well as changes in incarceration rates and populations in both prisons and jails.
The graphs made for this briefing are included in our profiles for each state:
Jails are, by definition, a distributed mess of “systems,” so accessing relevant data can be a challenge. Jails often hold people for other (state and federal) agencies and, at times, the numbers can be large enough to obscure the results of state- and local-level policy changes. For that reason, this report takes the time to separate out people held in jails for state prison systems or federal agencies, such as Immigration and Customs Enforcement, the Bureau of Prisons, the U.S. Marshals Service, and the Bureau of Indian Affairs.
Our national data come from our own analysis of multiple Bureau of Justice Statistics datasets. The National Jail Census series provides the most complete annual snapshot of jail populations. Our state-level data are from the Census of Jails for the years 1983, 1988, 1993, 1999, 2005, 2013, and 2019, and the Deaths in Custody Reporting series (now called Mortality in Correctional Institutions) for the years 2000-2004, 2006-2012, and 2014-2018. (We considered using the Annual Survey of Jails for our state-level data, but the Bureau of Justice Statistics explains that this dataset was “designed to produce only national estimates” and, after much testing, we concluded that this dataset could not reliably be used for state-level summaries.) There are no comparable data available for state-by-state jail population comparisons published more recently than 2019. 19
Jails — or facilities that serve the functions of jails — operate in all states, but in six states (Alaska, Connecticut, Delaware, Hawaii, Rhode Island, and Vermont) most or all of the jail system is integrated into the state prison system, so the “jail” populations in those states are not reflected in the federal data products on which this report relies (they are instead counted in the annual prison data). For that reason, we are unable to report state-specific data for those states, and those states are not included in the national totals reported in this report. Because these six states are relatively small in terms of population, we do not think their exclusion meaningfully impacts the national totals nor the much more important analysis of the trends within the national totals.
Many of our data sources are labeled on the individual graphics, but in some cases we had to combine multiple datasets or perform complicated adjustments where additional detail would be helpful to other researchers and advocates:
National data:
National number of people held in local jails for state and federal agencies (also referred to as “boarding” or “renting”):
National number of people held in local jails for all of the various federal authorities, including Immigration and Customs Enforcement (ICE), the Bureau of Prisons (BOP), the U.S. Marshals Service, and the Bureau of Indian Affairs: We have national-level data for 1983, 1988, 1993, 1999, 2005, 2013, and 2019. For those years, we used the National Jail Census series for the number of people held in local jails for the Bureau of Prisons or U.S. Marshals Service and for immigration authorities. For 2002-2005, 2007-2013, 2017-2018, and 2020-2022, the number of people held in local jails for immigration authorities comes from the Annual Survey of Jails series. For years between the National Jail Census series — when we were not able to find compatible data — we estimated the populations based on a linear trajectory. The estimates are noted in the appropriate appendix tables to differentiate them from the reported data from the Bureau of Justice Statistics.
National number of people held in local jails for state authorities: The Bureau of Justice Statistics, Prisoners series (1983-2022) publishes the number of people held in local jails for state authorities and this data is available for every year from 1983 to 2022. (This data point is also collected in the Census of Jails and the Annual Survey of Jails but we concluded, after much study, that the Prisoners series, based on data collected directly from states’ Departments of Corrections, was more reliable and more frequently collected and published.)20
National pretrial and jail sentenced populations: Total numbers for each category are reported in the National Jail Census series (1983, 1988, 1993, 1999, 2005, 2013, and 2019). We then adjusted the reported figures for the convicted and unconvicted populations to remove those held for other agencies from these jail totals. For years between the National Jail Census series — when we were not able to find compatible data — we estimated the populations based on a linear trajectory. The estimates are noted in the appropriate appendix tables to differentiate them from the reported data from the Bureau of Justice Statistics.
We removed 100% of people held for state prison systems (all of whom have been convicted and sentenced to prison terms) from the jail convicted totals (everyone else who has been convicted but not sentenced to prison).
We removed 34.1% of the people being held under the authority of Immigration and Customs Enforcement from the jail convicted population and removed the balance from the jail unconvicted population. (We based these percentages of the population held for ICE on our analysis of the Survey of Inmates in Local Jails, 2002. We found 34.1% of ICE detainees were there “to await sentencing for an offense,” “to await transfer to serve a sentence somewhere else,” “to serve a sentence in this jail,” or “to await a hearing for revocation of probation/parole or community release.”) This percentage calculation ignored any respondent who did not answer the question, and counted anyone who answered both a “convicted” and “unconvicted” status as convicted. We deliberately used this methodology which counts those awaiting revocation hearings as “convicted” because that matches the methodology used in our main dataset for this project: the National Jail Census. (Not surprisingly, since the people detained for ICE were answering a survey intended for criminal legal system populations, the leading response (41%) for ICE detainees about why they are being held in jail, after being read a list of statuses like “to serve a sentence” or “to await arraignment” was to answer “for another reason.”)
We removed 75.9% of the people being held for either the Bureau of Prisons or the U.S. Marshals Service from the jail convicted population and we removed the balance from the jail unconvicted population. (We based these percentages on our analysis of the Survey of Inmates in Local Jails, 2002 as described above for people detained for ICE).
State data:
Our historical, state-specific data on prisons, jails, and the changes in jail composition come from several different data sources:
For the state-level graphs on the jail and prison populations, the jail populations are based on the National Jail Census series for the years 1978, 1983, 1988, 1993, 1999, 2005, 2013, and 2019 and the Deaths in Custody Reporting series (now called Mortality in Correctional Institutions) for 2000-2004, 2006-2012, and 2014-2018. For years between the National Jail Census series — when we were not able to find compatible data — we estimated the populations based on a linear trajectory. The estimates are noted in the appropriate appendix tables to differentiate them from the reported data from the Bureau of Justice Statistics. As described above, our jail population totals were adjusted to remove people held for state or federal authorities in order to focus on those held by local authorities under local jurisdiction. The number of people in state prisons comes from the Bureau of Justice Statistics, Correctional Statistical Analysis Tool — Prisoners for 1978-2019 and Table 2 of Prisoners in 2020, Prisoners in 2021, and Prisoners in 2022 for 2020-2022. Of note, people sentenced for felonies in the District of Columbia were transferred to the Federal Bureau of Prisons as of December 2001, so there is no prison population or rate for the District for 2001-2022.
For the state-level graphs on jail and prison incarceration rates, for the jail populations in each state we divided the above (adjusted) numbers by the July 1st U.S. Census Bureau’s Census Vintage Population Estimates, which we have published in Appendix Table 6, and multiplied the result by 100,000 to show an incarceration rate per 100,000 people in each state for each year on the graph. The jail populations used in this report were collected on June 30th (“midyear”) for most years, so we used U.S. Census Bureau population estimates from July 1st for each year. Our state prison incarceration rates come from the Bureau of Justice Statistics, Correctional Statistical Analysis Tool — Prisoners for 1978-2019 and Table 7 of Prisoners in 2020, Prisoners in 2021, and Prisoners in 2022 for 2020-2022. Of note, people sentenced for felonies in the District of Columbia were transferred to the Federal Bureau of Prisons as of December 2001, so there is no prison population or rate for the District for 2001-2022.
For the state graphs of the number of people incarcerated in local jails by conviction status, we calculated estimates of the number of people held for local authorities by conviction status without including people held for federal or state authorities. The Census of Jails does not report the conviction status of people held for other authorities separately from those held for local authorities, so we based our estimate on the only reported ratio of convicted/unconvicted which includes the entire custody population. (We concluded that our national estimates of the portion of people held for state prisons or various federal agencies that are convicted or unconvicted were not reliable at the state level, so we used a simpler methodology for our state graphs.) To create this estimate, we determined the percentages of all people being held in jails in each state who were convicted and unconvicted in the National Jail Census series (1978, 1983, 1988, 1993, 1999, 2005 and 2013). We then subtracted the number of people held for state or federal authorities from the total statewide jail population, and applied our percentage convicted/unconvicted to the remainder. Because most people in jails being held for other authorities are convicted, we believe, our figures likely undercount the unconvicted/pretrial populations and overcount the convicted populations.
For the six states where the federal government can not provide jail counts or conviction status data, we only graphed the state prison portions.
Pretrial detention — for any amount of time — impacts employment, finances, housing, and the well-being of dependent children. In addition, jail stays are life-threatening: from 2000 to 2019, over 20,000 people died in local jails. In 2019 alone, more than one thousand people died in local jails. ↩
Jail stays are increasing in length: in 2022, people spent 8 more days in jail (32.5 days) on average than they did in 2015 (Bureau of Justice Statistics, Jail Inmates in 2022, Appendix Table 1). ↩
When he was 16 years old, Kalief Browder was held in New York City’s Rikers Island jail for three years, including almost two years in solitary confinement, because his family could not afford his $3,000 bail. ↩
Among the 663,100 people in jail on June 30, 2022, 70% (466,100) were unconvicted and held pretrial (Bureau of Justice Statistics, Jail Inmates in 2022, Table 5). However, 2019 is the most recent year for which jail data can be adjusted to exclude the people being held by federal and state authorities. This adjustment of 2019 jail data reveals that in 2019, 76% of the 604,400 people in jail held for local authorities were unconvicted (pretrial). See Figure 1. ↩
For example, in Bladen County, North Carolina, a newly built jail had earned the county nearly $2 million in the first 18 months of renting jail beds to the federal government in 2019. At the time of our 2017 report, a clear example of this pattern took place when officials in Blount County, Tennessee used “jail overcrowding” to justify a 2016 proposal for jail expansion. A deeper analysis, however, revealed that the county’s jail was overcrowded in large part because it was renting space to the state prison system. The county then cut back on renting space to the state prison system and reportedly explored other ways to reduce its jail population in place of jail expansions (we have not found evidence of a new jail or expanded jail in Blount County as of March 2024). ↩
Louisiana’s jail building boom appears to have been entirely fueled by the pursuit of contracts with the state’s prison system. As The Times-Picayune has explained, “In the early 1990s, when the incarceration rate was half what it is now, Louisiana was at a crossroads. Under a federal court order to reduce overcrowding, the state had two choices: Lock up fewer people or build more prisons. […] It achieved the latter, not with new state prisons — there was no money for that — but by encouraging sheriffs to foot the construction bills in return for future profits.” ↩
In terms of the impact on local jail populations, in 2019 (the most recent year with this data) people held in jails for state prison systems accounted for 29% of jail populations statewide in Mississippi, 30% in Louisiana, and 41% in Kentucky (Bureau of Justice Statistics, Prisoners in 2022, Table 14, and Census of Jails, 2005-2019, Table 12). ↩
These detainers, or “immigration holds,” request that local officials notify ICE before a specific individual is released from jail custody and then to keep them there for up to 48 hours after their release date, basically asking local law enforcement to jail people even when there are no criminal charges pending. For more details, see our 2020 explainer on these practices. ↩
For example California, Massachusetts, and Ohio have reduced offenses from minor misdemeanors to non-jailable infractions. ↩
For example, while all states allow citation in lieu of arrest for misdemeanors, only a handful of states permit citations for some felonies or do not broadly exclude felonies. See the National Conference of State Legislatures, 50 State Chart on Citation In Lieu of Arrest, last updated on March 18, 2019. ↩
For example, in Pima County, Arizona, as part of the MacArthur Foundation’s Safety and Justice Challenge, officials have begun screening people for mental health and substance abuse concerns who are arrested before their initial court appearance. Other diversion programs, such as Law Enforcement Assisted Diversion (LEAD) programs, coordinate the efforts of local law enforcement agencies with community-based service providers in counties like Multnomah County, Oregon. For more on LEAD programs, see the Addiction Policy Forum, Center for Health and Justice, National Criminal Justice Association “Innovation Spotlight: Law Enforcement Assisted Diversion.” ↩
For readers wondering when the next state-level data will be collected and published, the Bureau of Justice Statistics is planning a 2024 Census of Jails collection and has proposed replacing the Annual Survey of Jails with a more concise annual Census of Jails thereafter. The data are typically published about two years after collection. ↩
Please note that because our methodology is not the same as the Bureau of Justice Statistics, some numbers used in this publication differ from the published data in the Census of Jails, 2005-2019 — Statistical Tables. ↩
March 19, 2025: Join Prison Policy Initiative’s Advocacy Department at 1 PM EST on Wednesday, March 19, 2025, for a webinar about understanding recidivism. We will cover strategies from our recidivism toolkit, including an overview of recidivism statistics and what they really mean, how to combat the “Willie Horton” effect, and ways that advocates can transform the narrative around reentry to make it less focused on negative outcomes and more focused on the ways that returning citizens contribute to their communities.
April 15-17, 2025: Sarah Staudt, our Director of Policy and Advocacy, will be attending the MacArthur Safety and Justice Challenge Network Meeting from April 15-17 in Chicago. Drop her a line if you’d like to meet up!
Not near you? Invite us to your city, college or organization.


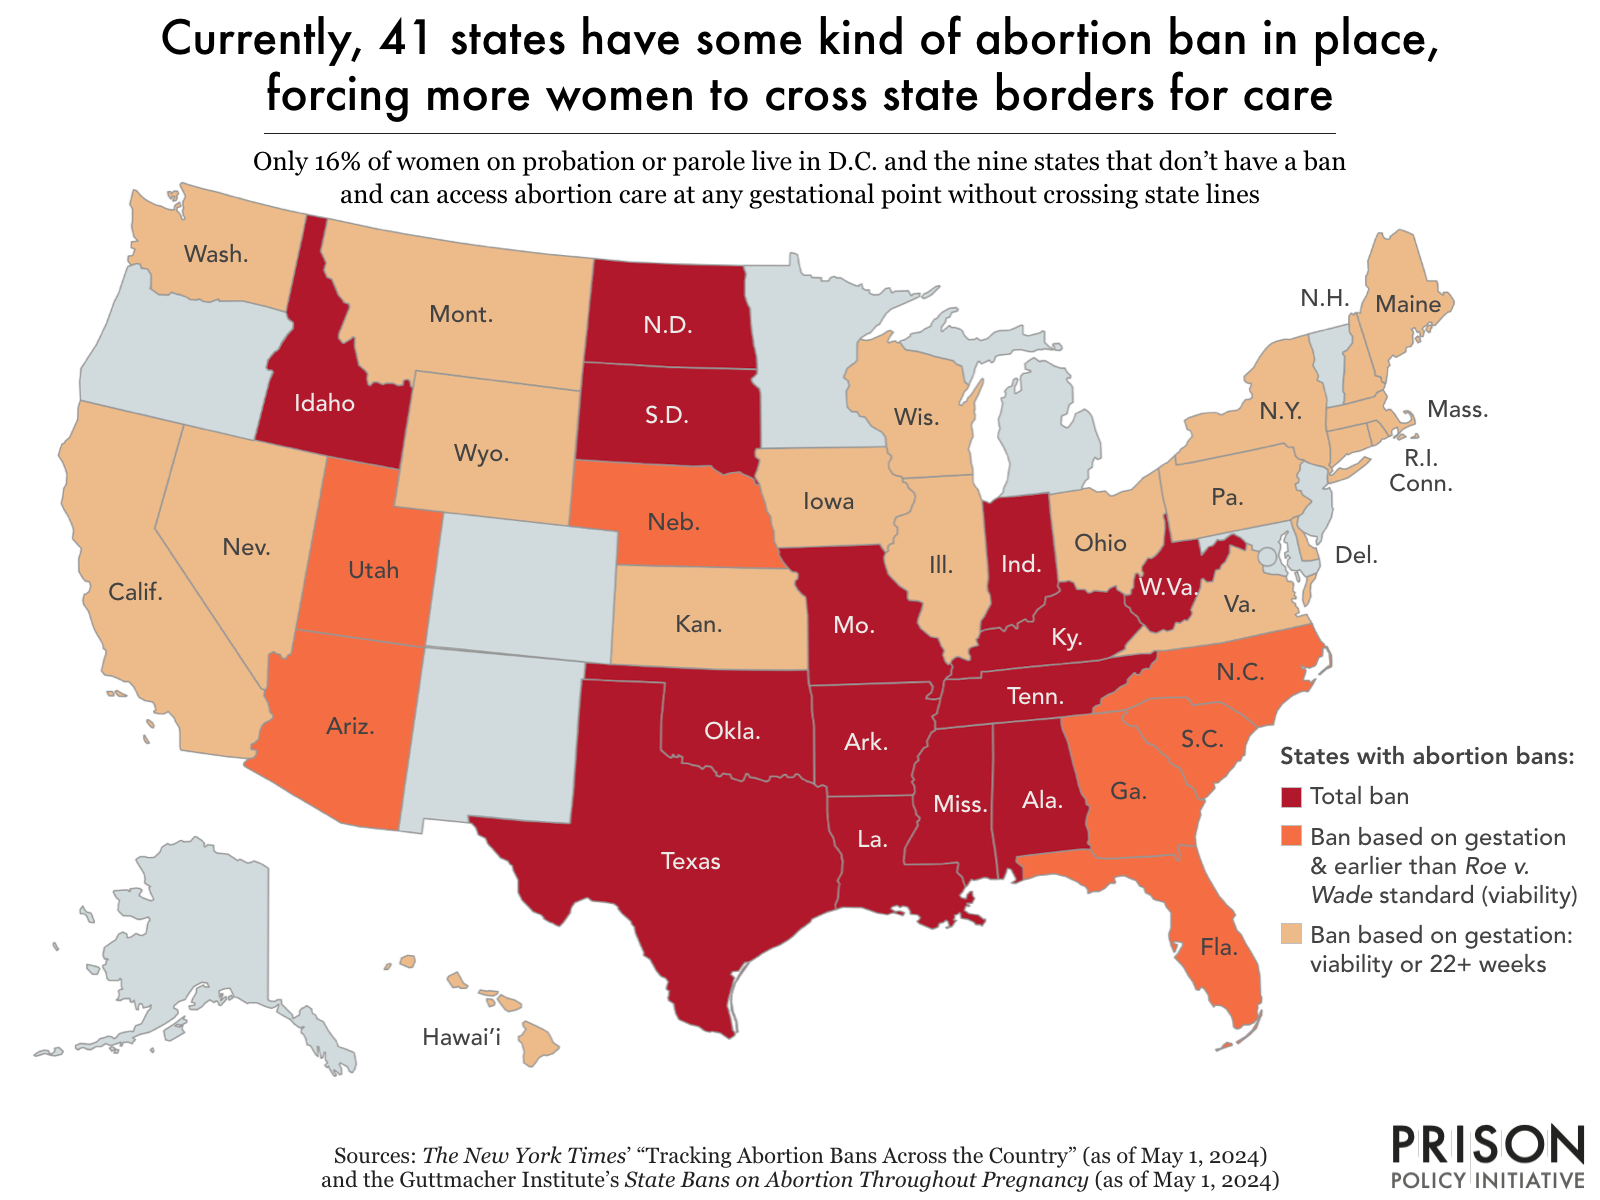
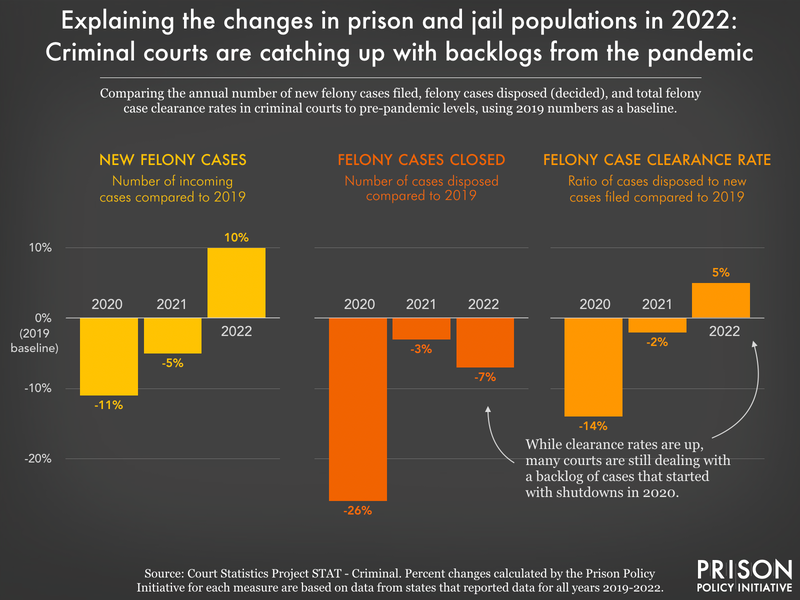