HELP US END MASS INCARCERATION The Prison Policy Initiative uses research, advocacy, and organizing to dismantle mass incarceration. We’ve been in this movement for 22 years, thanks to individual donors like you.

Can you help us sustain this work?

Thank you,
Peter Wagner, Executive Director
Donate

Uncategorized archives

Among the 27 states we surveyed, only 7 saw an increase in parole approval rate, and almost every state held substantially fewer hearings than in years past.

by Emmett Sanders, October 16, 2023

Note: On October 18, 2023, we made two edits to this piece : (1) Added data from Massachusetts that was released shortly after our analysis was published, (2) Fixed minor transcription errors to the appendix table.

Earlier this year, Alabama’s Board of Pardons and Paroles made headlines when it denied parole to someone who had died ten days prior to their parole hearing. This is just one of many threads in the Alabama parole board’s tapestry of dysfunction. For months, their three-person parole board operated with just two members despite requiring a majority vote to grant parole. It is no wonder that Alabama is on track to have a parole grant rate — the percent of parole petitions approved — of just 7% for 2023. This also comes as studies show racial disparities in parole grant rates are widening: for example, non-white people in New York were released at a rate almost 29% less than their white counterparts in 2022 (up from a difference of around 19% between 2016 and 2021).

With parole board practices so much in the news, we thought it was important to look around the country and evaluate the direction in which state parole boards are moving. We filed dozens of records requests and curated the best research to explore whether state parole boards are helping reduce mass incarceration or whether they are disregarding the hard-learned lessons of the pandemic, when they released even fewer people than before the crisis as people died behind prison walls.


The state of parole

In the 29 states1 for which we collected 2022 parole approval data, only 8 had grant rates above 50% – Connecticut, Idaho, Massachusetts, Nevada, North Dakota, Utah, Vermont, and Wyoming. Wyoming had the highest grant rate of 78%. At the other end of justice’s sliding scale, Alabama (10%) and South Carolina (13%) have the lowest parole approval grant rates in the nation. And while we don’t yet have data from most states for 2023, South Carolina’s recently updated parole data show that the state’s parole approval rate has dropped to an astonishingly low 7% in 2023.

Graph showing the percent change in parole approval rates in 26 states between 2019 and 2022. All but six states saw grant rates fall. To see full information about parole grant rates by year in each state from 2019-2022, see the appendix.

With few exceptions, parole grant rates dropped significantly from 2019 to 2022

In the 27 states for which Prison Policy Initiative was able to track changes in parole approval rates from 2019-2022, only 6 — Connecticut (+29%), Georgia (+17%), Texas (+11%), Hawai’i (+8%), Massachusetts (+8%), South Dakota (+6%), and Nevada (+1%) — have seen any increase since 2019. In the remaining 20 states from which we received data, parole grant rates have seen either no change or have seen a marked decline, with South Carolina (-63%) and Alabama (-67%) seeing the biggest drop offs in grant rates.

But state parole boards did not only choose to release fewer people. They heard fewer cases as well. With the exceptions of Oklahoma, South Dakota, and Arkansas, parole boards continued to hear significantly fewer total cases in 2022 than they did in 2019. The result is that since 2019, the number of people released through discretionary parole has decreased across the board.

Graph showing percent change in number of parole hearings in 27 states between 2019 and 2022. All but three states saw parole hearings decrease. To see full information about the number of parole hearings by year in each state from 2019-2022, see the appendix.

Ironically, South Carolina’s Department of Probation, Parole, and Pardon Services’ website is quick to highlight the money the state has saved by reducing the number of parole revocations over the past decade. Of course, it would be difficult to have more revocations, given that they released 69% fewer people via discretionary parole in 2022 than they did in 2019. South Carolina is far from alone, however. Alaska has reduced the number of people released through discretionary parole by 79% since 2019; Alabama 70% and Maryland by 66%. In fact, with the exception of South Dakota, every state for which data was provided released fewer people through discretionary parole in 2022 than in 2019, with an average overall decline of around 41% fewer people released per state. South Dakota’s increase is also extremely modest – the state released just 62 more people in 2022 than in 2019.

Graph showing percent change in number of people approved for parole release in 25 states between 2019 and 2022. Only one state, South Dakota, saw an increase in the number of people approved. To see full information about the number of people released on parole by year in each state from 2019-2022, see the appendix.


Why are parole boards releasing so few people?

Denial is often effectively the default disposition for parole boards, and the burden of proof is usually on the person who is incarcerated to justify their release. This is problematic, as the board often considers factors that are beyond the applicant’s control, such as the availability of programming or education in the prison, or factors that cannot be changed, such as the nature of the offense for which they were incarcerated. When release rests on these factors, there is very little a person can do to influence the outcome.

Another issue is the general outlook some politicians and parole board members have toward people who are up for parole. State Representative Matt Simpson defended Alabama’s abysmal grant rates, saying “We’ve gotten to a point where the people up for parole are the ones that don’t need to be out; it’s not like it used to be where we had a number of non-violent offenders.” While recent reports have cast doubt on this claim, it still begs the question: how can those with this viewpoint provide a fair hearing to those who come before them? There is nothing fair about a body that decides people’s fates before they ever appear. It’s important to note that the seriousness of an offense is taken into account when a judge first sets a prison sentence. When parole boards solely or exclusively make their release decisions based on the underlying charge, they are continually punishing incarcerated people for a factor they cannot change. Moreover, policies that provide relief only for those with non-violent offenses are simply not impactful enough to address the juggernaut of mass incarceration. And although parole boards are charged with looking at a person’s likelihood of rearrest, they often seem to ignore the fact that people sent to prison for violent charges have the lowest rearrest rate of any group.

Parole Boards are influenced by politics

In 2019, Mississippi had a grant rate of 74% — one of the highest rates in the nation. However, that same year, the parole board made the ethical but unpopular decision to parole a person who had been incarcerated for 30 years. That person had their death sentence commuted on the basis of intellectual disability but the board determined them not to be a threat to public safety. In the aftermath of this decision, Mississippi saw its grant rates freefall 42 percent by 2022. The political outrage at the decision led to increased scrutiny and political pressure which has undermined Mississippi’s presumptive parole system.2

Though parole boards are typically thought of as serving a judicial function (i.e., weighing evidence and rendering a judgment that results in freedom or continued incarceration), they are still bureaucratic bodies beholden to political good will. Parole board members are usually appointed by governors and confirmed by legislative hearings, which often makes their selection fundamentally political. More than a third of states with parole boards in the US mandate no qualifications to sit on the board, meaning no actual knowledge of law, prison, the judicial system, mental health, or even basic social dynamics are required to sit on boards that can prevent a person from ever again experiencing life outside prison walls.

Policy efforts to increase release rates are often stalled or undermined

Efforts to restore discretionary parole in Maine, Virginia, and Illinois led by groups like Parole4ME and Parole Illinois have come achingly close to success in recent years. Some states with discretionary parole have begun to implement presumptive parole in an effort to increase fairness and remove subjectivity and political pressure. While presumptive parole is a key strategy to reduce incarceration, in states that have implemented it, the efficacy of this policy is limited by carveouts — exceptions in policies that exclude certain categories of people from relief. Most states with some form of presumptive parole will not apply the presumption to people with certain offenses, those who have received recent disciplinary infractions, or those who haven’t completed relevant rehabilitative programming. As we noted, offense-based carveouts do not have a strong basis in policy, and programming-related carveouts are problematic because programming is neither universal nor guaranteed and can vary immensely from prison to prison.3 Reports have also shown that Black and Brown people who are incarcerated are more likely to receive disciplinary infractions than their white counterparts, meaning they are more likely to be denied presumptive parole based on this carveout.


Conclusion

Despite the dangers of incarceration in a post-pandemic world and the efforts of many to make the parole system more just, fewer people are receiving parole hearings, and fewer still are released through discretionary parole. In fact, discretionary parole accounted for only a small fraction of total releases from prison in 2021.

Expanding access to discretionary parole won’t by itself end mass incarceration; however, expanding its usage in conjunction with presumptive parole while eliminating undermining carveouts could be a powerful tool for decarceration. Hopefully, a review of parole in 2023 will see incarcerated people given a greater chance to be paroled.


Footnotes

  1. While we sought to collect data from all 34 states with discretionary parole as a primary mechanism of release, not all states make parole board data publicly available and several were not forthcoming with data via records requests. Arkansas has a residency requirement for records requests that prevented submission; Missouri denied having records responsive to our request, which strains credulity; New Hampshire cited the records as exempt. We are awaiting data for Nebraska, and West Virginia. Kentucky and Idaho provided some information, but were unable to provide statistics for 2019. In the appendix to this briefing, we provide details about each state’s response to our open records requests.  ↩

  2. Presumptive parole is a form of non-discretionary parole in which people are automatically released if they meet certain established criteria.  ↩

  3. New Jersey’s programming requirement for Administrative Parole Release eligibility (that state’s equivalent of presumptive parole), for instance, includes a provision that people will not be disqualified from APR if programming was unavailable.  ↩


Appendix tables

Discretionary Parole Grant Rates by state, 2019-2022


Learn strategies to convince policymakers to adopt reforms that help all people tangled in the criminal legal system.

by Sarah Staudt, October 12, 2023

In this webinar presented on November 1, 2023, staff from the Prison Policy Initiative and a panel of criminal justice experts have a discussion on how advocates for reform can talk to policymakers about carveouts, with a particular focus on addressing fentanyl and sex offense-related charges.


Webinar resources

The slides for the webinar are available here

Prison Policy Initiative has two publications on this topic:

Additional Resources:

  • Chicago 400 Alliance produced this video about people on public registries in Illinois, which is a great example of how to bring the stories of impacted people to legislators. To learn more about the Chicago 400 Alliance, coordinated by Laurie Jo Reynolds, you can view their website: https://www.chicago400.net/
  • To learn more about Drug Policy Alliance’s work advocating for a health-focused approach to fentanyl, you can find their website on the topic here. https://drugpolicy.org/campaign/build-a-health-approach-to-fentanyl/. To sign onto Drug Policy Alliance and Broken No More’s open letter from people who have lost loved ones to overdose, click here.

Report shows every community is harmed by mass incarceration

October 10, 2023

Today Common Cause Rhode Island, the ACLU of Rhode Island, the Redistricting Data Hub, and the Prison Policy Initiative released a new report, Where people in prison come from: The geography of mass incarceration in Rhode Island, that provides an in-depth look at where people incarcerated in Rhode Island state prisons come from. The report also provides 11 detailed data tables — including city ward and neighborhood data for Providence and Cranston — that serve as a foundation for advocates, organizers, policymakers, data journalists, academics, and others to analyze how incarceration relates to other factors of community well-being.

The report shows:

  • Many of the cities with the highest incarceration rates also have poverty rates well above the state’s average. For example, Central Falls, with a poverty rate of 25%, and Providence, with a rate of 22%, are both more than twice the statewide poverty rate.
  • Every single city and town — and every state legislative district — is missing a portion of its population to incarceration in state prison.
  • The state’s largest city, Providence, has both the most people in prison and the highest incarceration rate in the state.
  • There are dramatic differences in incarceration rates within communities. For example, in Cranston, the Arlington neighborhood had an incarceration rate of 281 per 100,000 residents, while in the neighborhood of Stone Hill, just a few miles away, no residents were incarcerated.

Data tables included in the report provide residence information for people in Rhode Island state prisons at the time of the 2020 Census, offering the clearest look ever at which communities are most impacted by mass incarceration. They break down the number of people locked up by county, city, town, zip code, legislative district, census tract, and other areas.

“The nation’s 40-year failed experiment with mass incarceration harms each and every one of us. This analysis shows that while some communities are disproportionately impacted by this failed policy, nobody escapes the damage it causes,” said Emily Widra, Senior Research Analyst at the Prison Policy Initiative. “Our report is just the beginning. We’re making this data available so others can further examine how geographic incarceration trends correlate with other problems communities face.”

The data show the cities with the highest state prison incarceration rates are Providence (354 per 100,000 residents), Woonsocket (325 per 100,000 residents), and Central Falls (300 per 100,000 residents). For comparison, Barrington is the town with the lowest prison incarceration rate, at 12 people in state prison per 100,000 residents.

Map showing incarceration rates in RI by census tract

“This report reemphasizes the urgent need for legislative action to correct Rhode Island’s starkly gerrymandered legislative districts. This issue has remained unaddressed for over a decade,” said John Marion, executive director of Common Cause Rhode Island. “It’s far past time that incarcerated people are counted where they live instead of where they happened to be on Census Day.”

The report cites studies that show that incarceration rates correlate with a variety of negative outcomes, including higher rates of asthma, depression, lower standardized test scores, reduced life expectancy, and more. The data included in this report gives researchers the tools they need to better understand how these correlations play out in Rhode Island.

“This report’s documentation of the many ramifications that flow from incarceration — social, educational, and medical — highlights the need for the state to more urgently address the overuse of our prison system and focus more on justice reinvestment initiatives,” said Steve Brown, Executive Director of the ACLU of Rhode Island. “This thorough analysis also provides another reason for legislators to fully address the unacceptable racial and demographic consequences of prison gerrymandering in the state.”

The report is part of a series of reports examining the geography of mass incarceration in America. It is available at https://www.prisonpolicy.org/origin/ri/2020/report.html.


In our new annual report, we share examples of how we armed the reform movement with the data it needs to push for real change

by Danielle Squillante, September 29, 2023

We just released our 2022-2023 Annual Report, and I’m thrilled to share some highlights of our work with you. We’ve had an incredibly productive year, releasing 19 major reports and 24 research briefings, including updates to our Whole Pie and Women’s Whole Pie. We also expanded our Advocacy Toolkit, provided technical support to advocates on the ground, and continued working with journalists on both sides of the wall to influence the national dialogue about criminal legal system reform. Here are a handful of successes we’re particularly proud of:

  • Publishing a major report on community supervision showing that all states — even those that consider themselves progressive leaders — put significant numbers of their citizens on probation and parole, systems that often replicate prison conditions in the community.
  • Releasing a groundbreaking report showing how companies in the commercial bail industry and their deep-pocketed insurance underwriters make huge profits, even when they fail to do their one job: ensuring their clients’ appearance in court. We also released a companion tool for journalists who want to investigate their local bail bond industry.
  • Advancing our campaign to protect incarcerated people and their loved ones from price gouging by private telecommunications companies who are raking in millions off of phone calls, video visits, and electronic messaging. Our work helped pass the Martha Wright-Reed Just and Reasonable Communications Act in 2023, which clarifies the FCC’s authority to regulate all phone and video calls from correctional facilities.
  • Helping Montana and Maine end prison gerrymandering. Progress on this issue has been so rapid that the National Conference of State Legislatures recently called state efforts to end prison gerrymandering “the fastest-growing trend in redistricting.”
  • Expanding our resources for advocates in counties with plans for new jail construction by developing a guide on understanding jail assessments and developing arguments to push back against jail construction proposals. We also held our first webinar, bringing together organizers to discuss strategies they employed to prevent new jails from being built.

These publications only scratch the surface of what we produced this past year. We are proud of our accomplishments and look forward to sharing new projects with you in the year to come.


New data visualizations and updated tables show the national landscape of persistent racial disparity in state prisons and local jails.

by Leah Wang, September 27, 2023

The best and latest criminal legal system data are often scattered across different government agencies, in incompatible formats, and difficult to compare. To make the most useful information more accessible, we make the underlying data for our timely reports and briefings available in our Data Toolbox, and create state-specific graphics on our comprehensive State Profiles pages. Today, we’ve added a rich new series of resources for our users of our work:

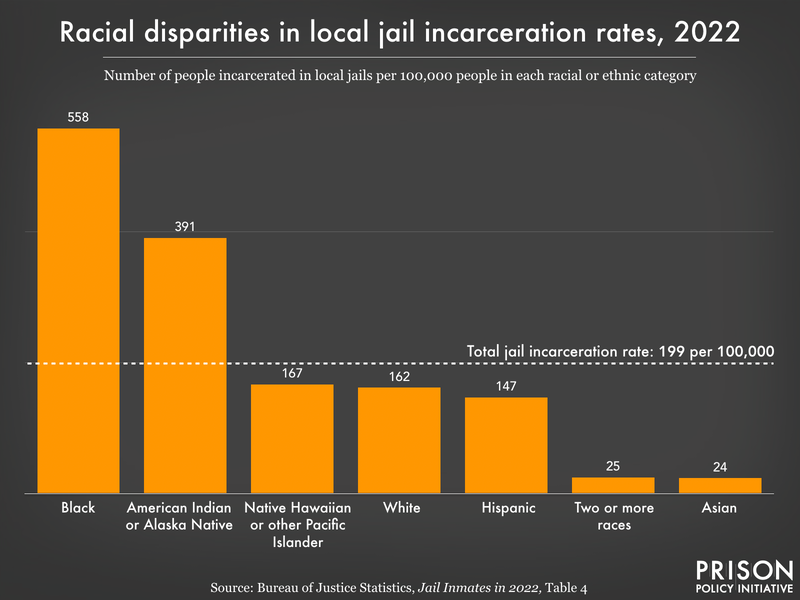
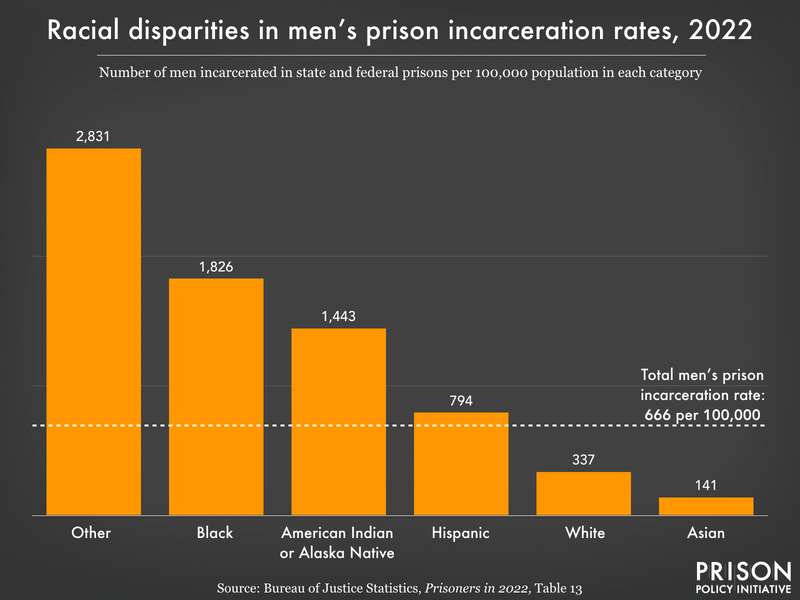
First, we now have a downloadable spreadsheet of the most recently available incarceration data for people in state prisons and in local jails, by race and ethnicity and by sex, for all 50 states and D.C.1 Unlike other datasets, ours provides apples-to-apples state comparisons in three formats (counts, rates, and percentages): We’ve done the math to standardize incompatible measurements found in the various original data sources.

Second, we’ve updated over 100 of the key graphics on our State Profiles pages showing prison and jail incarceration rates by race and ethnicity, and how the racial composition of each state’s prisons and jails compare to the total state population. The interactive map below can take you directly to your state’s page:


Find out more about the mass incarceration crisis in your state (we have a page for D.C., too). Or, access the full 50-state dataset (xlsx).


Using the new data tables to compare states

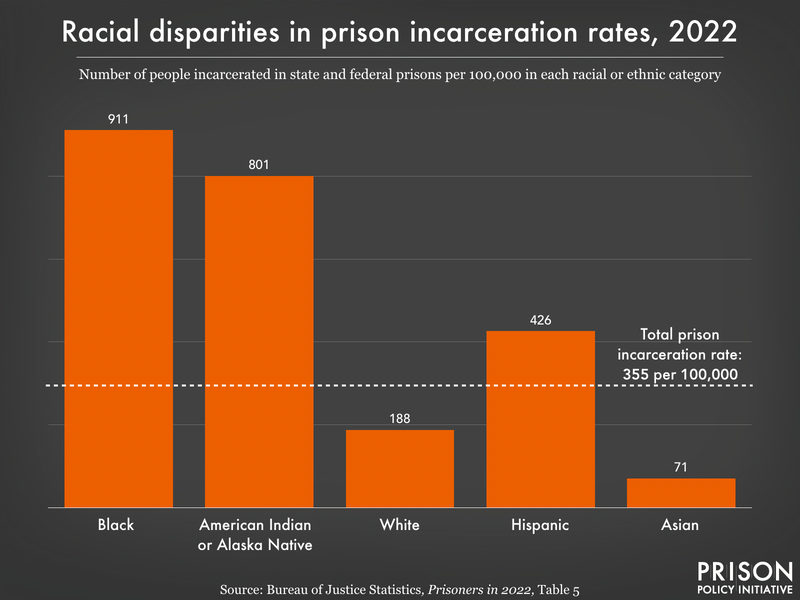
The data tables in the Data Toolbox make state and group comparisons much easier. For instance, they offer a closer look at the racial disparities in each state’s use of incarceration — that is, states lock up a larger proportion of people of color than you would expect based on how many actually live there. (This comes as no surprise given the racial bias found in each stage of the system, from policing to pretrial detention, sentencing, and even diversion opportunities.) We used the data to compare Black and white imprisonment rates by state, finding that every state locks up Black people at a rate at least double that of white people — and, on average, at six times the rate of white residents:

Bar chart showing the ratio of the Black state prison incarceration rate to the white state prison incarceration rate in every state in 2021. Every state incarcerates its Black residents at a higher rate than its white residents. Every state incarcerates Black residents in its state prisons at a higher rate than white residents. For comparisons to other race/ethnicity categories, see individual state profile pages.

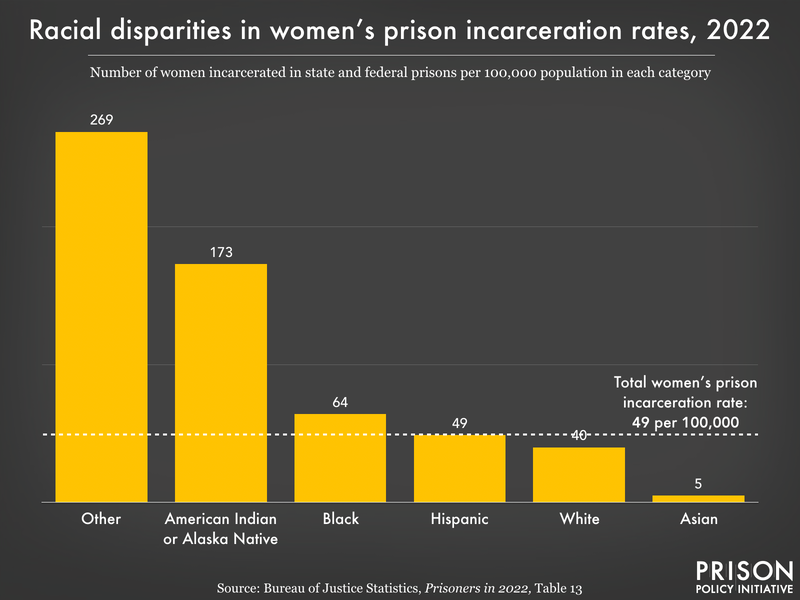
Readers can also use this new and comprehensive dataset to see, for example, how states handle women’s incarceration very differently:

Stacked bar chart showing the prison and jail incarceration rate of women in each state Jails play an outsize role in the mass incarceration of women, which has serious consequences for their health and their families. States that have a single, “unified” prison and jail system report all incarceration data as prison data, so no separate jail incarceration rate is available for them (this includes Conn., Del., Hawaii, R.I., and Vt.). Washington, D.C., meanwhile, only reports jail data; its prison population is included in the federal system.


Important data notes

For users of our work who follow our data sourcing and methodologies closely, we offer some important context for understanding and using Bureau of Justice Statistics data over other options (and hopefully, head off a few questions you may have in your search for incarceration stats):

  • We used Bureau of Justice Statistics (BJS) data rather than individual states’ departments of correction (DOC) published information, even though state DOCs sometimes have more frequently updated or more detailed data regarding prison populations. Not all states are forthcoming with their data (nor do they always provide it in a useful format), so we prefer the uniform time frame and population definitions guaranteed by BJS data. However, for more granular or frequently updated information, you may want to consult your state DOC’s data.
  • It’s important to know that state prison and local jail data are published by the Bureau of Justice Statistics (BJS) on different timelines, and represent slightly different populations. Although publication schedules can and do change, we can generally expect BJS to publish state and federal prison data annually, which can be broken down by state. Jail data by state, on the other hand, is collected and published less frequently, with the most recent dating back to 2019, and before that, 2013. We likely won’t see another comprehensive, state-level jail dataset until after 2024. We’re hopeful that BJS will continue to release detailed, state-level data on an annual basis as often as possible, as this is far more helpful than data we can only update every decade.

Find our new resources in the Data Toolbox and on the state profiles pages.

Footnotes

  1. The table also includes the number of youth (people under age 18) in prisons and jails in each state, but the underlying data does not allow us to break down the youth data in more detail nor to provide cross tabulations of race/ethnicity by sex in each state.  ↩


At the request of Decarcerate KC, we reviewed the city’s plans to build a new jail and found the community doesn’t actually need more jail beds and most people currently in its custody are there for minor offenses.

by Danielle Squillante, September 21, 2023

Recently, organizers in Kansas City, Mo. have worked to push back on local government leaders’ plans to build a new jail for people charged with crimes in municipal court. They’ve won significant victories, including through the city’s Alternatives to Incarceration Commission.

Despite this, local officials have continued to try to sway the public on the issue. That’s why Decarcerate KC, a grassroots organization working to change the city’s approach to public safety, asked us to review the “needs assessment” local leaders commissioned to try to justify building a new jail.

We found serious flaws with the analysis in the documents and the assumptions the analysis is based on:

  • Most people in city custody are there for minor, “non-violent” offenses: The city jail is used almost exclusively for low-level charges like city ordinance violations. People charged with more serious offenses are incarcerated in the county jail. Our analysis found that the majority of people incarcerated in the city jail were booked for crimes that did not involve any allegations of violence. This raises serious doubts about whether more city jail beds will make the community safer, or simply lock up more of its members unnecessarily.
  • The city doesn’t appear to need more jail beds: The report authors assert that more beds are needed because law enforcement stakeholders have been unable to jail people they otherwise would if they had more space. The numbers don’t back this up. In fact, 17% of the city’s available jail beds were empty when we did our analysis in August 2023.
  • Lack of public input: Despite having a “community engagement specialist” on the project team, it doesn’t appear the authors actually sought input from members of the public. Instead, the report relies solely on the views of prosecutors, judges, police officers, and others who are firmly entrenched in the established criminal legal system, raising serious doubts about whether the document is an honest assessment, or simply a document created to reach a predetermined conclusion.

Our full 11-page analysis goes on to explain how the report’s authors relied on outdated assumptions to predict growths in its jail population, misleading graphics, and a “lock ‘em up” approach to public safety, leading to a skewed outcome that ignores the societal harms of mass incarceration. Of particular concern is how this jail project will harm the Black residents in Kansas City; Over two-thirds of the people currently held in the city jail are Black, even though Kansas City is only 27% Black.

Is your community seeking to build a new jail or expand the capacity of its existing facility? While we’re happy to help you push back on their arguments (drop us a line to tell us about your fight), there is no need to wait for us. We have created a how-to-guide with tips for pushing back on “needs assessments” local leaders put together to justify the construction and strategies for pushing back on false or misleading arguments they’re making.


Providing unconditional housing with embedded services can reduce chronic homelessness, reduce incarceration, and improve quality of life – especially for people experiencing substance use disorder and mental illness.

by Brian Nam-Sonenstein, September 11, 2023

Housing is one of our best tools for ending mass incarceration. It does more than put a roof over people’s heads; housing gives people the space and stability necessary to receive care, escape crises, and improve their quality of life. For this reason, giving people housing can help interrupt a major pathway to prison created by the criminalization of mental illness, substance use disorder, and homelessness.

For this briefing, we examined over 50 studies and reports, covering decades of research on housing, health, and incarceration, to pull together the best evidence that ending housing insecurity is foundational to reducing jail and prison populations. Building on our work detailing how jails are (mis)used to manage medical and economic problems and homelessness among formerly incarcerated people, we show that taking care of this most basic need can have significant positive downstream effects for public health and safety.

A Venn diagram showing some of the ways in which homelessness, mental illness, substance use disorder, and criminalization and incarceration overlap. A Venn diagram showing some of the ways in which homelessness, mental illness, substance use disorder, and criminalization and incarceration overlap.

Using housing to interrupt cycles of incarceration

Homelessness, substance use disorder, mental illness, and incarceration are deeply intertwined experiences. Around 45% of adults in the United States who have been diagnosed with serious mental illness1 also have a co-occurring substance use disorder. People with such dual diagnoses are 12 times more likely to be arrested than people with neither diagnosis. This is borne out in prison populations. A study of Iowa’s state prisons, for example, found nearly 54% of people with serious mental illness also had a substance use disorder.

Drug and alcohol disorders can be both a cause and a consequence of being unhoused. Many people use drugs to self-medicate and cope with mental illness and the constant stressors of homelessness. One point-in-time count of homelessness across the United States in 2022 found that roughly 21% of unhoused people had a “severe” mental illness, and 16% engaged in “chronic substance abuse.” As frequent targets of aggressive policing, unhoused people face constant threats of criminalization. A recent survey of 441 unhoused people in Colorado found 36% had been arrested for a crime of homelessness, 70% had been ticketed, and 90% had been harassed by police, while recent research shows that 1 in 8 city jail bookings in Atlanta involved a person experiencing homelessness. In the end, policing homelessness creates a vicious cycle of poverty and confinement, where basic needs are never met: Formerly incarcerated people are almost ten times more likely to be unhoused than the general population, and 52,000 people who left correctional facilities in 2017 directly entered shelters.

For many years, housing policy was dominated by moralistic views of homelessness, which held that people just needed to take matters into their own hands and pull themselves up by their bootstraps. Drug use and mental illness were deemed character flaws and personal weaknesses, incompatible with housing or employment, and total sobriety and participation in treatment were required to receive what few services were available. Thankfully, decades of advocacy have begun to supplant these ideas with more effective supportive housing models like Housing First.

What is Housing First?

Housing First programs offer housing as a first step toward stability, rather than a goal to work toward.

Housing First is an approach to permanent supportive housing for people experiencing severe chronic homelessness – typically people who are living in emergency shelters or on the street for long periods of time – as well as substance use disorder and/or mental illness. Under this model, permanent housing with embedded services is provided to someone as quickly as possible, as a first step in responding to homelessness rather than something to work toward. Housing First programs exist in the U.S., Canada, and Europe. In the U.S., they can be found in cities like New Orleans, San Diego, New York, Philadelphia, and Seattle.

Unlike the “Treatment First” and recovery housing models that came before it, Housing First programs recognize that people with substance use disorders need housing to manage their health conditions and that treatment works best when it is entered into voluntarily. They therefore do not condition housing on abstinence from drugs or alcohol or other measures of “housing readiness.” Instead, they provide an array of voluntary wraparound community mental health and substance use treatment services and integrated case management. This reflects another Housing First principle: that unhoused people should have agency and choice when it comes to their housing and the services in which they participate. Research has shown that meeting material needs like housing and giving people control over health care decisions keeps people housed and improves attitudes and outlook on life.

Research on Housing First programs indicates that abstinence and treatment are not necessary to keep people stably housed in the long term. However, some people may want or need sober living environments to avoid triggering relapses. Some newer models, such as Housing Choice, have evolved out of these insights, suggesting that an ideal housing policy would give people genuine choices based on their needs.

Housing First programs provide low-barrier permanent supportive housing with wraparound voluntary mental health services and case management. These programs have demonstrated success in ending chronic homelessness and improving quality of life, especially among people experiencing both substance use disorder and mental illness.2 Though advocates and scholars have for years urged Housing First facilitators to better target services toward the needs of people with criminal legal system involvement, research has shown these programs are effective in reducing arrests and incarceration even when they aren’t tailored specifically to criminalized populations.

Take, for example, this report which examined results from a 10-year follow-up with participants in the New York City Frequent Users System Engagement program (NYC FUSE) – a supportive housing program working with housing providers in the city, including Housing First practitioners. Compared to a closely matched comparison group, the researchers found that participants spent an average of 95 fewer days in jail, and 256 fewer days in shelters, over the 10-year period.

Other programs focused specifically on arrest, incarceration, and reentry have shown equally impressive results:

Summary of findings from four studies of supportive housing programs serving people with a history of criminal legal system involvement.
Housing Program Arrest & jailing outcomes Other positive outcomes
NYC FUSE 95 fewer days in jail 256 fewer days in shelter
Denver Social Impact Bond (SIB) 40% reduction in arrests 40% reduction in shelter stays
30% reduction in jail admissions 65% reduction in use of emergency detox services
Returning Home-Ohio 40% less likely to be arrested again Remained in community for longer before rearrest
61% less likely to be incarcerated again
Solid Start (Missouri) Not measured Compared to the comparison group, participants felt more:
Independent and integrated into the community
Capable of stabilizing life
Confident and secure in their housing placement
Distanced from unsafe and criminogenic environments
Aided in release transition
Able to build a support network
Clear in describing pragmatic future plans
More personally responsible and capable of taking action

The Denver Social Impact Bond (Denver SIB)

The city of Denver, Colorado launched a housing initiative in 2016 for people experiencing long-term homelessness who had frequent interactions with police and emergency health services. The initiative, which is no longer active, provided housing subsidies with limited requirements, voluntary intensive clinical treatment and case management services, and assistance navigating the criminal legal system. In a study comparing people in the Denver SIB program to those receiving “services as usual” in the community, researchers found program participants spent significantly more time in housing: 77% percent stayed in their housing after 3 years, and they used shelters 40% fewer times than the comparison group. They also experienced 34% fewer police interactions and 40% fewer arrests than their peers. Denver SIB participants spent 27% fewer days in jail, and were booked into jail 30% less often. Finally, participants used emergency detoxification services 65% less often than the control group while using preventative and community-based care more often.

The Returning Home-Ohio Pilot Project

The Returning Home-Ohio Pilot Project, funded largely by the Ohio Department of Rehabilitation and Correction, linked disabled incarcerated people who had a history or risk of housing instability to supportive housing upon their release. The pilot, which became a permanent program in 2012, was implemented in 2007 and reached 13 prisons. It provided coordinated prerelease reentry planning, housing, and supportive services in five Ohio cities. Comparing participants to similarly situated formerly incarcerated people, researchers found participants were 40% less likely to be rearrested and 61% less likely to be reincarcerated.3

St. Louis, Missouri’s Solid Start Program

One study out of Missouri provides strong evidence of Housing First programs’ potential to encourage positive shifts in attitude and self-perception, which are important for successful reentry and desistance from crime. The Solid Start program provided housing for one year to about 30 men on parole at a time, who entered either directly from prison or after a short stay in the community. Participants were eligible if they had experienced over 10 years of incarceration, little community support, substantial child support or other financial obligations, no consistent work history, a maxed-out sentence, or a mild-to-moderate mental health disorder. The program provided housing subsidies as well as coordinated services and case management, and required participation in weekly group therapy sessions. According to data from 2010, Solid Start participants reported fewer problems and greater satisfaction with their accommodations compared to a group of similar men on “traditional parole.” They also felt more self-sufficient, and like they could overcome financial obstacles to independent living, viewing the program’s support as temporary. Solid Start participants also felt better integrated into the community and capable of stabilizing their lives thanks to their independent home placement. They were less likely to report that they were living in undesirable or criminogenic environments and were able to describe future plans with more clarity than the comparison group.


Housing First works, but it doesn’t solve everything

Housing can help people dramatically improve their lives, but these programs are not a panacea. They depend on affordable housing units and access to funding to operate, and those resources are extremely limited. Simply giving someone a place to live does not guarantee that they are being properly cared for, either. They may have particular safety and service needs that are not guaranteed or readily available through these programs, or the kinds of housing available may not be conducive to their social, spiritual, or cultural needs and values. Even successful models like Housing First struggle to help everyone given these constraints.

Supportive housing programs, like all housing programs, are filling gaps caused in large part by insufficient and discriminatory housing policies. They provide subsidies for housing, but must compete for funding and open housing units. Fewer open apartments, higher rents, long waiting lists, and the struggle of cobbling together funding scattered between different government agencies to cover everything from rent and down payments to physical and mental health care all make it exceedingly difficult to house someone. Add to this discrimination against tenants by landlords and neighbors, persistent policing in areas where housing is provided, and the struggle of supporting people amid rising costs of living, and placing and sustaining participants becomes even more difficult.

Some Housing First program workers have noted that many of these factors, and the overall intense urgency of clients’ housing and health needs, means they are constantly stuck in crisis mode and rarely able to plan or work through issues with their clients. While the model is successful at producing housing stability, many providers have felt that people should be staying in the programs longer. The goal of graduating people out of the program can actually be counterproductive to their work in some cases, introducing pressure and stress, or encouraging people to avoid graduation out of fear.

There are steps Housing First programs can take to improve on their own, regardless of the housing or funding situation. Advocates for unhoused women and indigenous people have argued that these programs should be far more inclusive. The general approach of Housing First programs means they tend to engage a predominantly male street-dwelling population. Women and femmes, for example, tend to have distinct traumatic and gendered pathways to homelessness, and often avoid shelters for fear of violence – meaning they are often out of the recruitment range of Housing First programs. They also are more likely to be caring for children and require specific services and assistance that they may not get through typical Housing First programs. Although some research has suggested Housing First placements spread across a community’s existing residential buildings (known as “scattered site” housing) have better outcomes, these accommodations may not work best for women and femmes, who may benefit from shared (or “congregate”) settings due to a higher level of security and more communal spaces.

What constitutes a safe and stable “home” is also not universal. In Canada, indigenous participants in Housing First programs felt their accommodations left them disconnected from their community. Prohibitions and restrictions on having guests, the inability to participate in smudge or sweat ceremonies in provided housing units, and the way in which housing placement eligibility conflicted with the customary mobility of some indigenous people, all expose how simply giving people apartments may be preferable to housing precarity, but falls short of meeting everyone’s needs.


Studies of other models reinforce housing’s role in promoting public safety

While Housing First models have some of the most robust bodies of evidence to back them, research into other housing models reinforces the core elements of the model, and underscores how housing increases safety and stability, holding promise for challenging mass incarceration.

Supportive housing: While Housing First models are a kind of supportive housing, not all supportive housing programs follow the Housing First model. Some supportive housing programs do require treatment and abstinence. Others, such as the Housing and Urban Development Veterans Affairs Supported Housing (HUD-VASH) program provide housing subsidies, health care referrals, and case management but, unlike typical Housing First programs, do not offer substance use treatment as a core part of the program. One study of the HUD-VASH program found that while participants spent more time in housing and reported increased functioning and reduced substance use, veterans who had substance use disorders still needed more services than the program provided.

Transitional housing: Results from studies of transitional housing models, which provide housing and services to people for shorter periods of time on their way to more permanent housing, are also in harmony with the research on Housing First. One 2010 report from the Department of Housing and Urban Development found that providing people with housing quickly improves their stability and likelihood of remaining housed. It also found that longer periods in transitional housing were associated with better outcomes, confirming the benefits of long-term or permanent arrangements like those provided under Housing First. Programs like A New Way Of Life have demonstrated success under this model: In their 2022 annual report, they note that 41 women in their program were able to access permanent housing that year and 99% of women served were not reincarcerated. That being said, some analysis of research on halfway houses – a form of transitional housing under correctional control – is more ambiguous, and suggests that such a punitive model may be associated with higher rates of rearrests.

Recovery housing: In general, recovery housing or “sober living housing” is specifically for people with substance use disorders. These programs typically mandate treatment and/or abstinence to some degree. Some research indicates recovery housing leads to reductions in substance use, improvements in employment, and desistance from criminal activity. But it’s difficult to generalize because the level of abstinence required and definitions of “recovery” vary between programs. Even though research on Housing First tends to indicate that sobriety and treatment are not necessary to house people stably, it is probably best practice for Housing First and sober living houses to be developed in parallel. Emerging models like Housing Choice, which offer people choices between housing programs with various rules and requirements around abstinence and treatment, are experimenting with this conclusion.


Conclusion

People caught in cycles of incarceration and homelessness are not all alike; they have different pathways to those experiences as well as a range of needs. But housing is one special factor that can stabilize multiple aspects of a person’s life at once.

Available research strongly suggests that for most people, providing housing quickly, for as long as possible, with few conditions and as much choice and support as possible, is a practical way to improve people’s conditions, making it easier for them to manage other parts of their lives. The impact housing has on quality of life and a person’s relationships, attitudes, and sense of control are also key to reducing a person’s likelihood of arrest and incarceration, use of emergency services, and experience of other life crises.

Housing is not a universal remedy and existing housing models can be better supported and improved. But housing has the potential to be one of the most impactful investments to reduce incarceration without investing more in the criminal legal system itself.


Footnotes

  1. The National Institute of Mental Health defines Serious Mental Illness (SMI) as “a mental, behavioral, or emotional disorder resulting in serious functional impairment, which substantially interferes with or limits one or more major life activities.” Some of the studies we reference in this briefing use specific diagnoses as measures of SMI, such as schizophrenia, bipolar disorder, major depression, and schizo-affective disorder, among others.  ↩

  2. It’s important to note (as researcher Dr. Jack Tsai does) that, while there is significant evidence backing Housing First, one meta-analysis of 44 studies of unique community housing models found that all housing models were associated with greater housing stability compared to no housing at all, which aligns with our argument that housing is an important tool for combatting incarceration. Additionally, as we generalize about these programs, keep in mind that Housing First programs are not all the same: many change and experience “program drift” over time, many face unique challenges and circumstances in their area of operation, and there is a wide range of fidelity to the model and principles.  ↩

  3. Participants who were rearrested were arrested significantly more than in the control group, but the report authors speculated that this could be attributed to the fact that they were under greater supervision and in greater contact with program staff. Overall, Returning Home-Ohio participants were in the community for significantly longer periods of time before their rearrest and participated in behavioral health services at greater rates.  ↩


Research shows that while most people who miss court are not dangerous or evading justice, the way courts treat “failure to appear” may make our communities less safe.

by Brian Nam-Sonenstein, August 15, 2023

People miss court for many reasons outside of their control. They can’t miss work, they don’t have childcare, or they don’t understand court instructions. Yet they are routinely seen through the eyes of the law and the media as fugitives from justice who threaten our communities, and met with unduly harsh punishments.

A cascade of negative consequences befalls those who “fail to appear”: arrest warrants, additional charges, jail and prison sentences, fines and fees, and more. None of these make it any easier to attend court, but they do heap misery and instability on the poorest and most marginalized people in the system.

Building off our previous work examining the role of “failure to appear” in bail processes and advocating for the reduced use of bench warrants, this briefing compiles research on who tends to miss court, why they miss court, and how different jurisdictions react. We also look at how people are organizing to increase court attendance, reduce harm, and importantly, question whether so many of these cases should exist in the first place.


States have a wide range of responses to “failure to appear”

Most jurisdictions provide some wiggle room for those who miss court to defend themselves, but protections are flimsy and quite limited.1 When coupled with a range of severe and counterproductive consequences, court responses to “failure to appear” (FTA) may actually make our communities less safe.

We categorized provisions within 83 laws across the states and Washington, D.C. with help from the National Conference of State Legislature’s Statutory Responses to Failure to Appear database. We find that, on balance, “failure to appear” policies are about punishment, not improving appearance rates:

To see how we categorized each jurisdiction’s policies, see the Appendix table.
Punishments Accommodations
49 jurisdictions including the District of Columbia impose additional criminal penalties, including fines and imprisonment 40 jurisdictions including the District of Columbia consider a person’s intentions in missing court to some degree
23 states allow an individual to mount a defense and attempt to prove to a judge that they were not evading the court
4 states have strict liability, meaning that no intent is required to be criminally responsible for missed court dates 14 states provide a grace period during which a defendant can appear in court before there are consequences
3 states distinguish treatment based on whether or not a person has left the state

Nearly every jurisdiction permits additional charges to be brought against someone who misses court, including the imposition of fines and imprisonment, with the exception of two states: Illinois and Mississippi. Four states — Maine, Michigan, Mississippi, and South Dakota — treat failure to appear as a strict liability offense, meaning no evidence of intent is required to hold defendants criminally responsible for nonappearance. Meanwhile, over two-thirds of jurisdictions make room (on paper, at least) to consider circumstances and intent behind missed court dates, and close to half allow people to defend their absences. Only about one-third of jurisdictions allow some sort of grace period for someone to return to court before facing consequences.

How courts respond to nonappearances can have serious consequences for a defendant’s current and future involvement in the criminal legal system. Failure to appear weighs heavily against defendants in many pretrial risk assessment tools, used to help determine whether someone should be released pending trial. A missed court appearance could tip one’s score in favor of pretrial detention, which could last for months if not years on end. Or it can lead to suffocating conditions of release, such as electronic monitoring or frequent check-ins with pretrial officers.

The influence of missed court dates on risk scores has direct consequences for poorer defendants, who are more likely to miss court because they lack childcare or transportation, or can’t take time off from work. And because these tools compute risk scores based on a person’s demographic characteristics and record (e.g., past missed court dates, the charges they are facing, age, etc.) rather than an assessment of their circumstances (employment and housing status, health considerations, etc.), they only reinforce the underlying issues that cause missed court appearances in the first place.

Even in places that don’t use risk assessment tools, a judge’s contempt for someone who misses court can weigh heavily against a defendant’s interests to remain in the community, and in favor of pretrial detention instead. Typically, from a judge’s perspective, missed court dates give the impression that a defendant does not take their case seriously, and absences lead to further delays and inefficiencies — a major concern for overburdened courts with large caseloads.


Most people are not evading justice and don’t threaten public safety

Opposition to bail reform is primarily led by the commercial bail bond industry, which profits off of the money bail system responsible for so much pretrial detention. Bail bond agents don’t have the strong incentive you’d expect to ensure people make it to court: The industry exploits loopholes and lax enforcement to avoid paying forfeited bonds when clients miss court dates. What’s more important for them is ensuring there is a steady stream of people detained pretrial who are desperate enough to pay bondsmen to get out of jail in the first place. Though they like to say they are in the business of getting people out of jail, in reality bail bondsmen prey on people who are stuck in pretrial detention. Harsh punishments for failure to appear, which make pretrial detention and financial release conditions more likely in future cases, help sustain this industry.

Graph showing that 13% of people who miss court dates are facing charges classified as violent, while the other 87% are facing charges classified as nonviolent.

To scare people onto their side, opponents often lean on the specter of “the criminal,” freed from jail but “defying” law enforcement by missing court and lurking in the community. But the reality is quite different: most people who miss court are facing low-level charges and are not evading court at all.2 In fact, roughly 25% of cases are eventually dismissed altogether, suggesting many of these people should never have been charged in the first place.

Most people who miss court are trying to attend but cannot. One report examining the reasons people miss court, conducted in Lake County, Illinois and published earlier this year, found that people simply have competing responsibilities, face logistical and technical challenges they cannot overcome alone, or are struggling with past experiences and emotional reactions. Many people are navigating more than one of these barriers to appearance at a time. Some examples from Lake County include:

Reasons given by 50 people who returned to jail for missing court in Lake County, Illinois, by type of barrier, in a 2023 study by Justice System Partners.
Life Responsibilities Logistical or technical concerns Past experiences and emotional reactions
Managing mental health diagnosis and medication compliance Live in another county or state and either challenging public transit or none at all Fearful or scared about process and going to jail
Moving a lot, securing shelter, navigating homelessness Unreliable car and either a suspended driver’s license or no license Nervous or scared
Serving as a primary caregiver Bus segments don’t line up Overwhelmed
Managing drug use and treatment responsibilities No computer or internet to use virtual option Court actors are unhelpful or refuse to help
Nightshift, newborn exhaustion, and forgetfulness No password to Zoom or password not working Court actors are intimidating or seem purposefully aggressive
Navigating custody and divorce cases No directions for Zoom or not listed on Zoom Confusing process, lack of information, too much information, conflicting information
Challenging family and relationship dynamics Address issues for notices Confusing navigating building or technology
Managing work responsibilities Racist, ableist, stigmatizing experiences with the court
COVID, sick, or hospitalized

Even when people miss court, most return within a year. Take for example this study from the Bureau of Justice Statistics, which focused on felony cases in the 75 largest urban counties in the U.S. Roughly 25% of people who were released without the involvement of a bail bond agent missed a court date. However, fewer than 8% failed to return to court within a year. Meanwhile, in July of this year, the Judicial Council of California released a report evaluating a pretrial release pilot program that began early in the COVID-19 pandemic, which sought to increase pretrial release rates and included a text message and phone call reminder service for court dates. Looking at a total of 422,151 people assessed as part of the pilot program, they noted a 6.8% decrease in failure to appear rates for people facing misdemeanor charges.3 This is consistent with other evidence showing that when people are met with support, they do show up: figures from The Bail Project’s 2022 annual report show that the people they supported had a 92% court appearance rate.

Additionally, people who tend to miss court do not pose a danger to the community. A 2013 study from the Bureau of Justice Statistics showed that people facing more serious charges missed court less often than people with lower-level offenses. Nearly 87% of people who missed court were facing property, drug, or public order charges, compared to 13% who missed court while facing charges for violent offenses.4


Missed court dates don’t make us less safe — but court responses to them do

“Failure to appear” is one of the main culprits behind an enormous backlog of warrants in the U.S. Bench warrants, issued by courts for procedural issues like missed court dates, order the police to find and arrest a person and bring them before the court. Such warrants arguably have a stronger negative impact on public safety than missed court dates themselves.

One 2018 Washington Law Review article, “Dangerous Warrants,” surfaced data from Omaha, Nebraska showing more than 40% of all outstanding warrants were for “failure to appear,” and 33% of people sought were Black in a city with a Black population of just 13%.

Meanwhile, a report from the North Carolina Court Appearance Project examining jail booking data from January 2019 to June 2021 found that “failure to appear” for misdemeanor charges was the most common reason people were jailed. Put another way, many of these people were jailed for missing court for original charges that would never have resulted in jail time. Many bench warrants are left outstanding and are never actually served, leaving the threat of arrest to linger over someone’s head in perpetuity. In this way, open bench warrants can be deeply counterproductive to the court’s stated goal of court attendance and even corrosive on public safety. While it’s uncommon for people in this situation to engage in criminal conduct, warrants help create conditions in which it may be more logical to do so. As explained in professor Lauryn P. Gouldin’s University of Chicago Law Review article, “Defining Flight Risk,” warrants create a fear of additional punishment that can dissuade someone from pursuing legitimate and stable employment for fear of being exposed on a background check. That fear might also cause someone to fail to obtain a driver’s license or apply for public benefits they need to survive. On a more personal level, it can lead to extreme stress and mental health deterioration, and cause severe strains on important relationships with friends and families. These factors can cause an inadvertently missed court date to become a persistent one, and force people to turn to crime for income and survival.

Taken together, the court’s response to an absence might itself motivate criminalized behavior, and waste law enforcement time and resources. As a result, aggressive court responses arguably pose a greater threat to community health and safety than missing court itself.


Advocates are fighting to change how we treat FTA

Fortunately, there are many people on the ground working to reduce the harm of missed court dates, interrogate the policing behind the charges, and expand pretrial release.

Injecting nuance to distinguish between evasion and understandable absences
As we discussed in our analysis above, many jurisdictions make some level of accommodations for people who miss court, whether it’s grace periods, defense provisions, or language that conditions any punitive responses on intent. This includes laws that are aimed particularly at a “willful” failure to appear, or someone who missed court “knowingly,” “without reasonable excuse,” or “intentionally.” Much of this can be attributed to organizing, such as the work of the Illinois Network for Pretrial Justice and Coalition to End Money Bond in Illinois, who successfully pushed for reforms that only permit judges to detain people pretrial due to a risk of “willful flight” – not simply because they might not appear in court.

Professor Gouldin proposes a different approach involving a policy distinction between “True Flight” and “Local non-appearance.” The idea is to differentiate between someone who has left the area and someone who missed court but remains in the area and is easy to locate. She suggests the court assess absences along a matrix of persistence, cost to the court, and willfulness. Where implemented, this would represent a meaningful and commonsense improvement to court responses.

Providing services to encourage court attendance
In some places, advocates have worked to provide basic supports such as court transportation, housing, food, and health care (including substance use treatment) to people involved in the system who would struggle to attend court without them or may decide to miss court to pursue them. There are also services aimed at providing population-specific needs, such as language support and special help hotlines for immigrants who must attend court. Other advocates have worked to establish phone call and text reminder systems to alert defendants to upcoming court dates. Finally, states like North Carolina are challenging laws that impose financial penalties for missed court dates, like an end to mandatory bond doubling policies that compel judges to double someone’s bond (or secure a minimum bond for $1,000 if none was set before) for missing a court date.

Simplifying court processes
Improving communication and reducing confusion can also improve court attendance. This includes redesigning court forms and implementing flexible scheduling to reduce court wait times, identify which court dates actually require a defendant’s participation, or allow for walk-ins or easier rescheduling. It may also include better communication about court scheduling and rescheduling, since some defendants — and their attorneys — have experienced showing up to court only to find their hearing time or date had been changed.

Advocates have also argued to reduce and eliminate fines and fees, especially for people who cannot afford them, and end the reflexive issuance of bench warrants when people miss court.

Since the pandemic, some places have added the option of virtual court visits — although court systems must examine whether judges are biased in favor of people who attend in-person.

Fighting policing and charges
Perhaps most importantly, advocates are rejecting the fear mongering narrative used by bail reform opponents. They argue the emphasis on missed court dates is a distraction from the fact that so many of the charges for which people are compelled to court are eventually dismissed. According to the 2013 Bureau of Justice Statistics’ study of felony cases in large urban counties, one in four cases ended in dismissal.


Conclusion: The root of the FTA problem

If courts were truly interested in reducing absences, there are many ways they could intervene to reduce the barriers people face to attending court. Instead, jurisdictions have created laws that allow courts to ruin and incarcerate greater numbers of people before they’ve even been convicted of a crime simply for having a scheduling conflict. The accommodations we have highlighted in our analysis of state laws are good, but are not enough on their own to reduce the frequency and harm of missed court dates.

As we have said throughout this piece, harsh punishments for missed court dates inject instability into our communities, and increase the likelihood of potentially dangerous police encounters. Adding insult to injury, this approach often escalates punishments for underlying charges that, at the end of the day, would not involve jail time and are frequently dismissed.

“Failure to appear” does not threaten our safety in the way that bail reform opponents present it — what’s more pernicious is how it has traditionally been used as a backdoor to punishing people before they’ve even been convicted of a crime. In addition to stopping unnecessary policing that ensnares people in criminal legal processes in the first place, more work needs to be done to actually address obstacles to attendance and move away from harsh and punitive postures toward missed court dates.

Correction, Feb. 1, 2024: We updated our categorization and tally of jurisdictions that impose criminal penalties, including fines and imprisonment, to include District of Columbia, Louisiana, Massachusetts, Montana, New Hampshire, New York, Oklahoma, and South Carolina. We regret the error.


Appendix

For details about the laws in every state that govern court responses to “failure to appear,” see the appendix table at: https://www.prisonpolicy.org/reports/fta_policies_appendix.html.


Footnotes

  1. Ultimately, whether a person’s “failure to appear” is excused is left to a judge’s discretion. It’s important to note, then, that our findings are based on laws and policies, and are not necessarily reflective of how those laws are or are not applied.
  2. Technically speaking, many “failures to appear” can be attributed to jails themselves: One in four people jailed in New York City miss court hearings and trials due to transportation delays. Last year in Los Angeles, 40% of county jail transport buses broke down, causing many people to miss court and spend more time locked up.
  3. The Judicial Council’s report did find a statistically significant increase in failure to appear rates of 2.5% for people facing felonies, but this may be a consequence of COVID-19-related disruptions prolonging court proceedings for people facing such charges. The longer the court proceedings, the more opportunities there are for people to miss court dates, and felony cases are typically much longer than misdemeanor cases.
  4. It is important to note that what constitutes a “violent crime” varies from state to state. An act that might be defined as violent in one state may be defined as nonviolent in another. Moreover, sometimes acts that are considered “violent crimes” do not involve physical harm. For example, as The Marshall Project explains, in some states entering a dwelling that is not yours, purse snatching, and the theft of drugs are considered “violent.” The Justice Policy Institute explains many of these inconsistencies, and why they matter, in its report Defining Violence.

New Census Bureau data show the U.S. population is getting older — and at the same time, our prison populations are aging even faster. In this briefing, we examine the inhumane, costly, and counterproductive practice of locking up older adults.

by Emily Widra, August 2, 2023

New data from the Census Bureau reveals that the U.S. median age rose to a high of 38.9 years: an increase of three and half years in the last 23 years. The U.S. prison population is aging, too, and at a much faster rate than the nation as a whole — and older adults represent a growing portion of people who are arrested and incarcerated each year. The aging of the prison population is the result of a series of disastrous policy decisions in policing, sentencing, and reentry over roughly the last half-century. And while prisons and jails are unhealthy for people of all ages, older adults’ interactions with these systems are particularly dangerous, if not outright deadly.


Aging throughout the criminal legal system

Older adults1 are increasingly ensnared in all parts of the criminal legal process: in arrests, pretrial detention, and imprisonment. In 2000, 3% of all adult arrests involved people aged 55 or older, and by 2021, this older population accounted for 8% of all adult arrests.2 According to the most recent available data on local jails across the U.S., from 2020 to 2021 — during the COVID-19 pandemic, which was particularly dangerous for older adults — the segment of the jail population aged 55 and older expanded by a greater proportion than any other age group, growing 24% compared to an average increase of 15% across all other age groups.3

two bar charts showing people in prison 55 and older as a percentage of adult arrests and people in prison, increasing from 1991 to 2021

Meanwhile, older people make up five times as much of the prison population as they did three decades ago. From 1991 to 2021, the percentage of the state and federal prison population nationwide aged 55 or older swelled from 3% to a whopping 15%.4 This growth is seen even more acutely when looking at people serving life sentences: by 2020, 30% of people serving life sentences were at least 55 years old, with more than 61,400 older adults sentenced to die in prison.


The dangers of aging in prison

Prisons are unhealthy places for anyone of any age, but keeping older adults locked up is particularly dangerous. A robust body of research shows that incarceration itself accelerates aging: people face more chronic and life-threatening illnesses earlier than we would expect outside of prison, and physiological signs of aging occur in people younger than expected. In addition, a conservative estimate of more than 44,000 people 45 and older experience solitary confinement in state prisons each year, in conditions that shorten lives and can be detrimental to physical, mental, and emotional health. Years of limited resources, inaccessibility, and understaffing in prison healthcare have created a situation in which each year spent in prison takes two years off of an individual’s life expectancy. The same scarcity of prison healthcare resources that jeopardizes older people’s health is not just ineffective-it’s also exorbitantly expensive.


The high costs of incarcerating older people

State and federal governments spend increasingly more money on consistently inadequate healthcare for their growing populations of older adults. While most studies on the steep costs of incarcerating older people date back at least a decade, their findings are consistently dramatic. For example, in California prisons in the 1990s, the state spent three times as much money to incarcerate an older person than someone of any other age group. Considering the proportion of California’s prison population over the age of 50 has risen from about 4% in 1994 to 25% in 2019, and that prison healthcare spending per-person has ballooned in the intervening years, the cost of incarcerating older adults only appears to be growing. In 2013, the federal Bureau of Prisons (BOP) spent 19% of its total budget — or $881 million — to incarcerate older adults. That same year, the BOP reported this group was the “fastest growing segment of its inmate population” with a 25% increase over the course of a single year (as the rest of the population decreased by 1%).

As long as people are in prison, they should receive the care they need to be safe and healthy. But especially at the state and local level, every dollar spent in prisons is a dollar that could have expanded and improved community health services — and provided superior care. It doesn’t make much sense to spend so much money locking people up in places that are not only dangerous to their health, but more costly to care for them — especially when there is little public safety argument to justify doing so.


Low risk of re-arrest and re-incarceration for older adults

The older someone is, the less likely they are to be arrested following release from prison, according to the most recent government study of recidivism. In fact, people released at age 65 or older are the least likely of any age group to be re-arrested in the five years following release:

line graph showing re-arrest trends for five years after release from state prison, highlighting people 65 and older as lowest risk

Decades of research reinforces these findings: formerly incarcerated older adults are among the least likely to be re-arrested, re-convicted, and reincarcerated.


Decades of “tough on crime” policies contributed to the aging prison population

The incarcerated prison population is getting older much more quickly than the general population because of policy choices throughout the criminal legal system.

Policing

Policing disproportionately targets populations that often include many older adults: unhoused people, people who use drugs or alcohol, and people with cognitive disabilities. Nationally, the unhoused population is growing older. From 2007 to 2014, the number of unhoused people over age 50 expanded by 20%, and in 2014, this age group accounted for more than 30% of people experiencing homelessness. Given that unhoused people are up to 11 times more likely to be arrested than housed people, the likelihood of arrest for older, unhoused people is undoubtedly growing over time. Drug-related arrests among people aged 50 and older nearly doubled from 2000 to 2018, indicating a dramatic increase in criminal legal system involvement.

The criminalization of mental illness among older adults is significant as well. One in nine people aged 65 and older have Alzheimer’s dementia (one of many kinds of dementia). The most recent national data available indicates that people with cognitive disabilities are overrepresented in jails and prisons: 31% of people in jails in 2012 and 24% of people in state prisons in 2016 reported a cognitive disability. As greater numbers of older adults with cognitive disabilities encounter police,5 older prison populations are likely to grow.

Sentencing

State and federal sentencing policies from the 1970s to the 2000s resulted in what researchers have called “a prescription for an increase in older inmates: more prisoners, more prison beds, more lifers, and less parole.” State and federal laws enacted in this time period resulted in more incarcerated people serving longer sentences via policies that:

Longer and harsher sentences top the list of the most obvious mechanisms by which the national prison population exploded in the 1990s and 2000s, but they also created the problem of today’s aging prison population: many of the people who received these sentences are still behind bars now that they are twenty or thirty years older.


Tools to reduce the aging prison population remain underutilized

While attention to this crisis has grown in recent years, many of the available tools — such as parole and compassionate release — have been underutilized. The failure to release older adults from prison has deadly repercussions: from 2001 to 2018, over 30,500 people aged 55 or older died in prison and almost all of these deaths (97%) were due to illnesses.12

Parole

In a study of parole in Maryland, the Justice Policy Institute found that between 2017 and 2021, parole grant rates are highest for people between the ages of 31 and 35 (43%) with rates declining as age increases: people over 60 are paroled at a rate of 28%. Older adults serving long sentences are often denied parole, with boards focusing on the nature of their original offense instead of their preparedness for reentry.13 That being said, parole is not even an option for large swaths of the prison population. Almost half of all people serving life without parole (LWOP) sentences are at least 50 years old, and one in four is at least 60 years old. Even some “geriatric” or “elder” parole laws, intended to facilitate the release of older incarcerated people, needlessly exclude many older people who would otherwise be eligible; for example, the Justice Policy Institute points out that the Maryland law only applies to older people with multiple convictions.

Compassionate release

Compassionate release (often called medical parole) is an important release mechanism for older adults, but is not used nearly often enough. The application process is cumbersome and opaque, and many people die before they ever receive a decision.14 In addition, decisions about medical eligibility for release are often filtered through state parole boards, whose membership often includes former corrections officials, former parole or probation officers, and former prosecutors. These are not vocations particularly invested in release, much less promoting individual health and wellbeing outside of the carceral system. Parole boards’ lack of knowledge about serious and terminal illnesses, as well as the general aging process, can create significant barriers to release. Physician reluctance to offer a prognosis, parole board rejections of medical recommendations, offense carveouts,16 and barriers to discharge planning15 also factor into the underutilization of compassionate release. Some states (like Iowa) do not even have such a release program.

The result: Nursing homes behind bars

As a result of the disastrous failure to make use of existing release systems and increasing public pressure to address the aging prison population, prisons have adapted in very troubling ways. In Connecticut, Kentucky, Tennessee, and Wisconsin, departments of corrections have created “prison nursing homes” to keep people incarcerated even when they are far too sick or frail to represent any kind of public safety threat.17 The continued incarceration of people who would otherwise be receiving residential or long-term care reflects a troubling trend of prisons “gearing up to become nursing homes, but without the proper trained staff and adequate financial support.”

Re-entry barriers

Even when older adults are approved for release from prison, they often face a barrage of challenges in the community.

Many people released from prison — regardless of age — struggle to obtain adequate and affordable housing, employment, and healthcare. For older adults, these concerns can be magnified as any amount of time spent in prison disrupts healthcare services and increases the challenges of (re)connecting with them after release. Older adults also have fewer relationships with people on the outside, face discrimination in healthcare settings like nursing homes, and come up against legal and regulatory barriers to accessing benefits like Supplemental Security Income and Medicare.

The sheer number of complex and overlapping barriers placed before formerly incarcerated older people is staggering:

Housing
barriers
Employment and
income barriers
Healthcare
barriers
Reduced family/friend networks, or reduced connection with family Criminal legal system involvement Logistical barriers for enrollment in Medicare/Medicaid
Untreated mental illness Mental health status Unstable housing
Untreated substance use Physical health status Functional or cognitive disabilities
Costs of housing Prior employment history (gaps) Health literacy
Public housing restrictions Logistical barriers for enrollment in SSI/SSDI Distrust of institutions/public benefits
Landlord discretion Age discrimination
Nursing homes/congregate housing restrictions Lack of (reliable) transportation

Barriers to admission for nursing homes and other necessary healthcare facilities are particularly awful for people who have a terminal illness and are released via compassionate release. In Connecticut, many nursing homes will not even consider admitting people released from prison, and in Florida, people who have been convicted of sex offenses and released from prison often live in motels because they are routinely turned away from nursing homes. Formerly incarcerated older adults facing chronic and terminal illnesses are often forced to rely on an “ad hoc network of care” for their medical needs.


Reducing the aging prison population

If we hope to address this crisis, more work needs to be done to curb arrests of older people, to divert them to better community support, and to reduce their numbers behind bars. The decriminalization of homelessness and substance use — as well as expanded diversion services for older adults — can reduce their risk of arrest and detention. States can also send fewer people back to prison by eliminating parole revocations for technical offenses that reincarcerate people for actions that, were the individual not on parole, would not be crimes at all.

To reduce the number of already-incarcerated older adults, state and federal governments can make use of presumptive parole, second-look sentencing, and the retroactive application of sentence reduction reforms, as well as the many other mechanisms to shorten excessive prison sentences outlined in our 2018 report, Eight Keys to Mercy: How to shorten excessive prison sentences. All states should have compassionate release or medical parole available to release older adults and those facing chronic and terminal illnesses. States can also reduce existing barriers to compassionate release by eliminating exclusions based on offense type, relaxing eligibility criteria, and simplifying the application, review, and approval process.18 Elder parole policies that implement automatic parole consideration for older adults who have already served some portion of their sentence can further reduce the number of older people behind bars, simplifying the process of getting out of prison for some of the most medically vulnerable people.19

Finally, states and the federal government need to expand the social safety net to support older adults released from prison. There are numerous interventions to support reentry by reducing housing and employment barriers, encouraging access to healthcare and health insurance (including Medicare and Medicaid), and simplifying application and re-enrollment for Social Security benefits, as well as many more crucial supports outlined in this 2022 issue brief from Justice in Aging.


Conclusion

The crisis of our aging prison population is not an accident but the result of policy choices that hurt incarcerated people, their loved ones, families, and communities. Fortunately, we can address these policy missteps.

In order to provide older incarcerated people with adequate healthcare, end of life care, and dignity, we need to find ways to reduce their numbers in all parts of the carceral system. Existing tools — like compassionate release and parole — can help but are not enough to address this problem on their own. States should follow the lead of advocates who are fighting to reduce police encounters, end draconian sentencing like life without parole, and expand release mechanisms like elder parole. Reducing barriers to enrollment in Medicare, Medicaid, Social Security, and ensuring people have safe places to live in our communities can expand the safety net for older adults leaving prisons. Ultimately, the benefits of such changes will not be recognized only by older adults in the system but the broader population as well.


Appendix: State prison populations aged 55 and older, 1999‑2019

For the number and percent of people 55 and older in state prisons by state from 1991 to 2019, see the appendix table at: https://www.prisonpolicy.org/data/aging_1999_2019.html.


Footnotes

  1. Throughout this report, “older adults” refers to people aged 55 or older.  ↩

  2. Arrests in the United States by age and sex, 2000-2021 from the Federal Bureau of Investigation’s Uniform Crime Reporting Program, Crime Data Explorer.  ↩

  3. At midyear 2020, there were 40,500 people aged 55 or older confined in local jails and by midyear 2021, there were 50,100 people 55 or older in local jails, representing an increase of 24%. Focusing on the oldest age group for which data is collected, the number of people 65 or older expanded from 7,400 to 9,400 (a 27% increase) from 2020 to 2021. See Table 2 in the Bureau of Justice Statistics’ Jail Inmates in 2021 — Statistical Tables for demographic data about people confined in local jails (age data only available in 2020 and 2021).  ↩

  4. An estimated 3.4% of sentenced people in state and federal prison in 1991 were 55 or older. This estimate is calculated based on the data reported in Table 1 of the Bureau of Justice Statistics’ Comparing Federal and State Prison Inmates, 1991: 6.8% of the 54,006 people in federal prison and 3.1% of the 704,203 people in state prison were 55 or older. As a percentage of the combined federal and state prison populations, 3.4% of people in state and federal prisons were 55 or older. An estimated 15.3% of the sentenced state and federal prison population in 2021 were 55 or older, based on Table 10 of the Bureau of Justice Statistics’ Prisoners in 2021 — Statistical Tables.  ↩

  5. Police encounters are often deadly for disabled people but often go unseen in media reports. A 2016 study notes that while disabled individuals make up a third to a half of all people killed by police, their disability often goes unmentioned in news reports.  ↩

  6. For example, the Rockefeller drug laws in New York increased sentence lengths and instituted mandatory minimum sentences. By the end of the 1980s, all 50 states and D.C. enacted some sort of mandatory minimum laws, and this was still the case in 2021.  ↩

  7. By 2000, 24 states and Congress had passed three-strikes legislation.  ↩

  8. By 1995, eleven states had adopted truth-in-sentencing laws. By 1998, 27 states and DC met the eligibility criteria for the Federal Truth-in-Sentencing Incentive Grant Program.  ↩

  9. The Sentencing Reform Act of 1984 abolished federal parole for federal crimes committed after November 1, 1987. By the end of 2000, 16 states had abolished all discretionary parole.  ↩

  10. In 1981, Connecticut lawmakers reduced the amount of “good time” credits that could be earned from 15 days to 12 days per month, resulting in an increase of the average time served by “about 20%.” The Sentencing Reform Act of 1984 also reduced the amount of time that could be earned for good conduct for people in federal prison.  ↩

  11. The federal 1994 crime bill and numerous state laws were passed in the 1980s, 1990s, and early 2000s as part of a “tough-on-crime” campaign to lock people up for longer than ever before.  ↩

  12. The types of illness vary from terminal illness (such as cancer) to illnesses that are often preventable or treatable for some time outside of prison (such as “AIDS-related illnesses,” respiratory disease, liver disease, heart disease, and influenza).  ↩

  13. In some states, the reasons for parole denial can be based on the original offense, no matter how long ago an individual was convicted and regardless of the fact that the seriousness of the crime was inevitably taken into account at sentencing, and that discretionary parole is fundamentally about release based on personal transformation.  ↩

  14. According to The New York Times, between 2013 and 2017, the federal Bureau of Prisons (BOP) approved only 6% of the 5,400 compassionate release applications received; meanwhile, 266 other applicants died in prison. The Times’ analysis of federal prison data shows that it takes over six months, on average, for an incarcerated person to receive an answer from the BOP. In one tragic example, prison officials denied an application for someone because the BOP put aside prison doctors’ prognosis of less than six months and concluded that he had more than 18 months to live. Two days after receiving the denial, he died.  ↩

  15. A 2021 bill in Colorado streamlined the medical release process, but 23 incarcerated people who were approved for parole remained in prison because the state Department of Corrections “could not find a nursing home willing to admit them.” Similarly, in Florida, many older adults with sex offense convictions are denied by nursing homes.  ↩

  16. For example, a 2015 study found many states automatically exclude people convicted of murder (at least 7 states) or “sexually oriented crimes” (at least 11 states). Some states even exclude people based on prior offenses, regardless of the offense they are currently serving time for. Other states only allow compassionate release and medical parole for people who have parole-eligible offenses or for people who have already served a certain portion of their sentence.  ↩

  17. The ad hoc development of “prison nursing homes” is a waste of resources that would be better spent on medical, social, and emotional support outside of the carceral system for aging adults. In Pennsylvania, the state reportedly spends more than $3 million each year just to “medicate” the older adult population housed in their three long-term care prison units.  ↩

  18. For additional recommendations regarding compassionate release, see FAMM’s ongoing work to expand compassionate release across the country.  ↩

  19. For more information on the implementation of elder parole, see RAPP’s advocacy for New York’s proposed elder parole legislation.  ↩

See all footnotes


Please welcome our new Policy and Advocacy Associate, Emmett Sanders!

by Danielle Squillante, July 24, 2023

Emmett Sanders

We are excited to introduce our new Policy and Advocacy Associate, Emmett Sanders! In his new role, Emmett will assist the Advocacy Department in providing technical assistance and added capacity to advocates and organizers engaging in criminal legal reform efforts at the state and local levels.

Emmett is a critically impacted researcher, writer, and advocate who holds a B.A. in English and a Master of Public Affairs from the University of Texas Rio Grande Valley. Prior to joining the Prison Policy Initiative, Emmett was the Project Researcher and Organizer on MediaJustice’s Challenging E-Carceration and Unshackling Freedom campaigns where he became an expert on electronic monitoring. He worked previously as the Justice and Reentry Advocate at Cunningham Township Supervisor’s Office in Urbana, Illinois. He has been engaged in advocacy work with the Illinois Coalition to Challenge Electronic Monitoring as well as the Urbana Fair Housing Coalition.

Welcome to the team, Emmett!


Stay Informed


Get the latest updates:


Share on 𝕏 Donate


Events

Not near you?
Invite us to your city, college or organization.