Population size & incarceration rate
- Pre-trial detention in different parts of the justice system (Created: 2025)
- Federal correctional systems overview (Created: 2025)
- Involuntary commitment in the justice system (Created: 2025)
- Correctional control extends far beyond incarceration (Created: 2025)
- Immigration detention and incarceration by different agencies (Created: 2025)
- Number of people in local jails over time, by conviction status (Created: 2025)
- Only 8% of confined people are held in private prisons (Created: 2025)
- Mass incarceration directly impacts millions of people. But just how many, and in what ways? (Created: 2025)
- Despite reforms, drug offenses are still a defining characteristic of the federal system (Created: 2025)
- Most people in Indian Country jails are locked up for property, drug, and public order charges (Created: 2025)
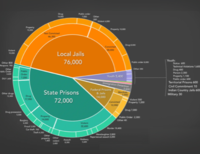
- How many people are locked up in the United States? (2025) (Created: 2025)
- Racial and ethnic disparities in correctional facilities (Created: 2025)
- Prop 36 will grow California's prison population by more than one third by 2029 (Created: 2024)
- Louisiana's prison population may double with regressive legislation (Created: 2024)
- U.S. incarceration rate compared to that of other founding NATO members (Created: 2024)
- By state: Prison and jail incarceration rates, populations, and jail conviction status (Created: 2024)
- Jail and prison populations by state, 1978-2022 (Created: 2024)
- Jail conviction status by state, 1978-2019 (Created: 2024)
- State policy drives mass incarceration (numbers) (Created: 2024)
- State policy drives mass incarceration (rates per 100,000) (Created: 2024)
- How many women are locked up in the United States? (2024) (Created: 2024)
- Reforms to reduce prison populations have largely excluded the largest group: people convicted of offenses classified as "violent" (Created: 2024)
- Prison growth continued through 2023 in many states (Created: 2023)
- How much higher are Black incarceration rates than white? (Created: 2023)
- Incarceration rates by race and ethnicity in prisons (2021) and jails (2019), by state (Created: 2023)
- How many women are locked up in the United States? (2023) (Created: 2023)
- Five Montana counties are home to less than half of the state's residents, but more than 67% of the state's prison population (Created: 2022)
- In Billings, the North Side and South Side communities are home to only 7% of residents, but 34% of the city's imprisoned population (Created: 2022)
- Three Missoula neighborhoods are home to a disproportionate number of people in state prison (Created: 2022)
- One Great Falls community is home to 10% of the city's residents, but more than a third of the city's incarcerated population (Created: 2022)
- Imprisonment rates vary greatly between Billings neighborhoods (Created: 2022)
- Six Connecticut cities are home to more than 50% of the state's incarcerated population, but only 17% of the state's total population (Created: 2022)
- Every Connecticut county is home to hundreds of people in prisons, while three counties are home to thousands of people in prison (Created: 2022)
- High neighborhood incarceration rates in Bridgeport are concentrated in the south of the city (Created: 2022)
- Neighborhood incarceration rates in Hartford are higher than many other places across the state of Connecticut (Created: 2022)
- Stamford has one of the lowest incarceration rates in Connecticut, but some neighborhoods have rates far above the city average (Created: 2022)
- Waterbury has one of the highest city incarceration rates in the state, but a handful of neighborhoods are the most affected (Created: 2022)
- Hartford imprisonment rates vary greatly by neighborhood (Created: 2022)
- Significant neighborhood differences in incarceration trends exist in Stamford (Created: 2022)
- Imprisonment rates vary across Pennsylvania, but every part of the state has residents locked up in state prison (Created: 2022)
- Seven Pennsylvania counties imprison more than 300 people per 100,000 county residents (Created: 2022)
- North Philadelphia is home to the city's highest imprisonment rates (Created: 2022)
- High imprisonment rates are concentrated in a handful of Pittsburgh neighborhoods (Created: 2022)
- Imprisonment rates vary greatly by neighborhood in Philadelphia (Created: 2022)
- While some Pittsburgh neighborhoods imprison virtually no one, others have exorbitantly high imprisonment rates (Created: 2022)
- Incarceration in Delaware is not confined to the most populous cities: people living all over the state are locked up at high rates (Created: 2022)
- Delaware residence data reveals patterns of high incarceration rates in every state legislative district (Created: 2022)
- Incarceration rates vary greatly between communities in Delaware's four largest cities (Created: 2022)
- Delaware's highest incarceration rates are concentrated in a handful of cities and towns (Created: 2022)
- High county imprisonment rates are clustered in a handful of northern and central California counties (Created: 2022)
- In the city of Los Angeles, the highest imprisonment rates are concentrated in southern neighborhoods (Created: 2022)
- San Francisco has one of the state's lowest city imprisonment rates, but some communities have rates far about the city average (Created: 2022)
- Imprisonment rates vary greatly by neighborhood in Los Angeles (Created: 2022)
- Across San Francisco, imprisonment rates vary greatly by neighborhood (Created: 2022)
- Four Nevada counties send more people per capita to prison than the rest of the state (Created: 2022)
- High rates of imprisonment are concentrated in few Las Vegas communities (Created: 2022)
- High rates of imprisonment are concentrated in the central communities of the city of Reno (Created: 2022)
- High rates of imprisonment are concentrated in the southeastern corner of Las Vegas (Created: 2022)
- Most people in state prison [in Colorado] are from the three largest cities: Denver, Aurora, and Colorado Springs (Created: 2022)
- Ten Colorado counties are home to 88% of Colorado residents in state prison (Created: 2022)
- County imprisonment rates show that incarceration in Colorado is not confined to the most populous cities (Created: 2022)
- Imprisonment rates in Denver vary by neighborhood, with the highest rates clustered in northern Denver and west of I-25 (Created: 2022)
- In Aurora, Colorado, high rates of imprisonment are concentrated in northwestern neighborhoods (Created: 2022)
- Miles apart, Denver neighborhood imprisonment rates vary greatly (Created: 2022)
- Aurora neighborhoods across town have vastly different imprisonment rates (Created: 2022)
- The areas with the highest incarceration rates [in Maryland] are Baltimore City and the southern Eastern Shore (Created: 2022)
- Baltimore neighborhoods have vastly different imprisonment rates (Created: 2022)
- Even two miles apart, neighborhood experiences of incarceration [in Baltimore] vary greatly (Created: 2022)
- Six New Jersey counties are home to more than half of the state's imprisoned population (Created: 2022)
- High rates of imprisonment are concentrated in southwest Newark (Created: 2022)
- More than half of people in state prison from Jersey City come from only five neighborhoods (Created: 2022)
- Newark neighborhoods divided by a single street have very different rates of imprisonment (Created: 2022)
- Upstate [New York] counties send the most people to prison per capita (Created: 2022)
- NYC neighborhoods have vastly different imprisonment rates (Created: 2022)
- People in state prison from Syracuse come from primarily five neighborhoods in western Syracuse (Created: 2022)
- Buffalo neighborhoods have vastly different imprisonment rates (Created: 2022)
- Even two miles apart, neighborhood experiences of incarceration [in Syracuse] vary greatly (Created: 2022)
- Among Virginia's 95 counties and 38 cities, 26 are missing at least 1% of their population to incarceration (Created: 2022)
- Thirteen Richmond neighborhoods have more than 2.5% of their residents locked up in state prisons and jails (Created: 2022)
- Nine Norfolk neighborhoods have incarceration rates more than twice as high as the city's incarceration rate (Created: 2022)
- Arlington has one of the lowest incarceration rates in Virginia, but some neighborhoods have rates far above the city average (Created: 2022)
- Across Richmond, neighborhood incarceration rates vary greatly (Created: 2022)
- Every county in Washington state is imprisoning people, with the highest imprisonment rates in some of the less populated counties (Created: 2022)
- Twelve Vancouver neighborhoods have imprisonment rates higher than the citywide rate of 409 per 100,000 (Created: 2022)
- Two Spokane neighborhoods are home to a disproportionate number of people in state prison (Created: 2022)
- One neighborhood is home to only 7% of Tacoma's residents, but is home to 33% of the people in prison from the city (Created: 2022)
- Imprisonment rates vary greatly between Spokane neighborhoods (Created: 2022)
- State policy drives women's incarceration growth - rates (Created: 2022)
- State policy drives women's incarceration growth - raw numbers (Created: 2022)
- What pandemic-related changes caused prison and jail populations to drop in 2020? (Created: 2022)
- How many people are locked up in the United States? (2022) (Created: 2022)
- Local Jails: The real scandal is the churn (Created: 2022)
- The prison population drops during the pandemic are the result of fewer admissions, not increasing releases (Created: 2022)
- After rapidly dropping their populations at the very start of the pandemic, jails have allowed their populations to creep back up during most of 2021 (Created: 2022)
- States released fewer people during 2020 than in 2019 (Created: 2022)
- Many state prison populations are ticking back up despite the ongoing pandemic (Created: 2022)
- State prison populations haven't dropped nearly enough during the pandemic, any many are actually growing in 2021 (Created: 2021)
- The average number of people released from state prisons each month has been falling since 2019, despite the urgent need to decarcerate during the pandemic (Created: 2021)
- Racial disparities in incarceration rates by sex, 2010 (Created: 2021)
- Comparing the incarceration rates of U.S. states to other, similar, countries (Created: 2021)
- Few states made significant efforts to reduce prison populations (Created: 2021)
- The United States incarcerates more of its population than any other nation - including nations that have similar or higher rates of crime (Created: 2021)
- From 2008 to 2018, women's jail populations grew while men's jail populations shrank (Created: 2021)
- Pretrial detention rates are climbing fastest in rural counties despite dropping slightly in urban counties (Created: 2021)
- Jail populations dropped more in cities that avoided increasing jail budgets (Created: 2021)
- Jail populations dropped by 25% early in the pandemic (Created: 2021)
- The U.S. incarceration rate in jails alone exceeds the total incarceration rate of its peers (Created: 2021)
- Lesbian and bisexual women are overrepresented in prisons and local jails (Created: 2021)
- Parole boards held fewer hearings and failed to say "yes" more often, ultimately approving fewer people for parole during the pandemic (Created: 2021)
- More people were released from prison in 2019 than during the pandemic (Created: 2021)
- Lesbian, gay, and bisexual people are incarcerated at three times the rate of straight people (Created: 2021)
- While some state prison populations continue to decline, efforts to reduce prison populations have slowed and even reversed in some states (Created: 2020)
- Racial disparities in men's imprisonment persist across all ages (Created: 2020)
- Prison population drops in many states slowed or reversed in July, August, and September, despite the continued spread of COVID-19 (Created: 2020)
- Racial disparities in prison incarceration rates, by sex, 2018 (Created: 2020)
- U.S. incarceration rates by race (Created: 2020)
- Compassionate release was never designed to release large numbers of people (Created: 2020)
- High imprisonment communities have lower 5th grade ELA scores (Created: 2020)
- High imprisonment communities have lower 5th grade math scores (Created: 2020)
- High imprisonment communities have higher youth asthma rates (Created: 2020)
- High imprisonment communities have higher poverty rates (Created: 2020)
- High imprisonment communities have higher unemployment rates (Created: 2020)
- 1 out of 5 prisoners in the world is incarcerated in the U.S. (Created: 2020)
- How many youths are locked up in the United States? (Created: 2019)
- Long sentences for violence account for over half of all state prison growth from 1980 to 2010 (Created: 2019)
- Incarceration pie chart and correctional control pie chart by state (Created: 2018)
- Incarceration growth in 80's and 90's dwarfs recent declines (Created: 2018)
- Comparing the women's incarceration rates of U.S. states to other, similar, countries (Created: 2018)
- Incarceration for drug offense in different parts of the justice system (Created: 2018)
- Women's state prison populations have grown faster than men's (Created: 2018)
- Women's prison incarceration rate: select states and all 50 states (Created: 2018)
- Women's and men's incarceration numbers and rates by state, 1978-2015 (Created: 2018)
- Local jail population, 1940-2015 (Created: 2017)
- Local jail incarceration rate, 1940-2015 (Created: 2017)
- District of Columbia prison and jail incarceration rates, 1978-2015 (Created: 2017)
- District of Columbia prison and jail populations (Created: 2017)
- What is actually driving jail growth? (Created: 2017)
- Jail and prison incarceration rates by state, 1978-2015 (Created: 2017)
- Jail conviction status, by state, 1978-2013 (Created: 2017)
- Jail and prison populations, by state, 1978-2015 (Created: 2017)
- States vary greatly in how they use correctional control (Created: 2016)
- Jail population by conviction status, 1983-2014 (Created: 2016)
- National imprisonment rate by age, 1993-2013 (Created: 2016)
- Distribution of monthly incomes for women unable to meet bail and non-incarcerated women (Created: 2016)
- Types of correctional control by size (Created: 2015)
- Women's Incarceration Rate: United States 1910-2014 (Created: 2015)
- Comparing Iowa's incarceration rate to other states, 1978-2013 (Created: 2015)
- Imprisonment rates in Texas, 1983-2013 (Created: 2015)
- Admissions to and releases from Texas correctional facilities, 1983-2013 (Created: 2015)
- Racial/ethnic parity in U.S. correctional facilities, 2005 (Created: 2015)
- High Incarceration Communities in Baltimore (Created: 2015)
- Higher Incarceration Communities in Baltimore (Created: 2015)
- Highest Incarceration Community in Baltimore (Created: 2015)
- Maryland Taxpayers Spend $288M on Corrections in Baltimore (Created: 2015)
- Maryland Taxpayer Spending on Corrections in Baltimore by Community Statistical Area (Created: 2015)
- State prison incarceration rate: Select states and all 50 states (Created: 2014)
- Regional state prison incarceration rates, 1977-2010 (Created: 2014)
- State prison incarceration rate, 1978-2012 (Created: 2014)
- Local jail incarceration rate, 1978-2012 (Created: 2014)
- Federal prison incarceration rate, 1978-2012 (Created: 2014)
- State prison population, 1978-2012 (Created: 2014)
- Local jail population, 1978-2012 (Created: 2014)
- Federal prison population, 1978-2012 (Created: 2014)
- Incarceration rates by state, 1978-2012 (Created: 2014)
- Incarceration rates by race/ethnicity and racial disparities by state, 2010 (Created: 2014)
- Differential incarceration rates in Holyoke, Springfield and Massachusetts (Created: 2012)
- Incarceration rate, 1925-2008 (Created: 2010)
- Maryland and Baltimore City: Population, Prisoners and Prison Cells (Created: 2010)
- Connecticut and Hartford: Population, Prisoners and Prison Cells (Created: 2010)
- Connecticut state incarceration rate, 1973-2008 (Created: 2010)
- Connecticut and New Haven: Population, Prisoners and Prison Cells (Created: 2010)
- Illinois state prisoners, 1970-2000 (Created: 2010)
- State prisoners in other state's prisons or in federal prisons (Created: 2010)
- Pennsylvania state prisoners, 1980-2000 (Created: 2009)
- U.S. Prison Proliferation, 1900-2000 (Created: 2005)
- Blacks are overrepresented in Franklin County, MA jail (Created: 2004)
- Racial disparities in incarceration by state, 2000 (Created: 2004)
- Incarceration rates by race, 2001 (Created: 2004)
- Where is New York's incarcerated population? (Created: 2004)
- Males are overrepresented in prisons and jails (Created: 2004)
- State prisoners in private prisons, 1999 (Created: 2004)
- State prisoners in local jails, 1999 (Created: 2004)
- Adults under criminal justice system control (Created: 2004)
- Disparities between Black and White incarceration rates, 2001 (Created: 2004)
- Number of prisoners per country (Created: 2004)
- Percent of the world's prisoners held by each country (Created: 2004)
- Countries with incarceration rates under 150 per 100,000 (Created: 2004)
- Global Incarceration Rates (Created: 2004)
- Pennsylvania's Institutional Populations 1982-2003 (Created: 2003)
- Incarceration rate, 1925-2001 (Created: 2003)
- Prisoners per 100,000 residents, emphasizing the low rate through the 1980 U.S. Census (Created: 2003)
- African American male population in higher education and in prison, 2000 (Created: 2003)
- Blacks overrepresented in Ohio prisons (Created: 2003)
- Racial disparities in North Carolina incarceration per 100,000 population (Created: 2003)
- Maryland incarceration rates by county and prison locations, 2000 (Created: 2003)
- North Carolina incarceration rates by county (Created: 2003)
- North Carolina state prisons (Created: 2003)
- North Carolina state prisons authorized for construction (Created: 2003)
- North Carolina state prisons built since 1990 (Created: 2003)
- North Carolina state prisons under construction (Created: 2003)
- Pennsylvania incarceration rates and prison locations by county, 2000 (Created: 2003)
- Growth in the New York State prison and drug prisoner populations (Created: 2002)
- The one-day count of youth in juvenile justice "residential placement" facilities has dropped by over 60 percent since 2000 (Created: 1969)
Events
- April 15-17, 2025:
Sarah Staudt, our Director of Policy and Advocacy, will be attending the MacArthur Safety and Justice Challenge Network Meeting from April 15-17 in Chicago. Drop her a line if you’d like to meet up!
Not near you?
Invite us to your city, college or organization.


