April 15-17, 2025: Sarah Staudt, our Director of Policy and Advocacy, will be attending the MacArthur Safety and Justice Challenge Network Meeting from April 15-17 in Chicago. Drop her a line if you’d like to meet up!
Not near you? Invite us to your city, college or organization.
2024 was a busy year for the Prison Policy Initiative. We exposed how prisons and jails are exploiting incarcerated people and their families for millions of dollars each year, highlighted how cruel abortion restrictions affect women throughout the carceral system, saw a major victory for phone justice, and so much more. We curated some of our most important pieces from the last 12 months.
This year was the tenth anniversary of our flagship report, Mass Incarceration: The Whole Pie. It provides the most comprehensive view of how many people are locked up in the U.S., in what kinds of facilities, and why. In addition to showing that more than 1.9 million people are behind bars on any given day in the U.S., it uses 34 visualizations of criminal legal system data to bust 10 of the most persistent myths about prisons, jails, crime, and more.
Recognizing that women in the U.S. experience a dramatically different criminal legal system than men do, but data on their experiences is difficult to find and put into context, we released a new edition of Women’s Mass Incarceration: The Whole Pie. This report fills this gap with richly-annotated data visualizations about women behind bars.
The U.S. has the highest incarceration rate of any independent democracy on earth — worse, every single state incarcerates more people per capita than most nations. In the global context, even “progressive” U.S. states like New York and Massachusetts appear as extreme as Louisiana and Mississippi in their use of prisons and jails.
Our report examines the incarceration rates of every U.S. state and territory alongside those of the other nations of the world. Looking at each state in the global context reveals that, in every part of the country, incarceration is out of step with the rest of the world.
Prisons and jails generate billions of dollars each year by charging incarcerated people and their communities steep prices for phone calls, video calls, e-messaging, money transfers, and commissary purchases. A lot of that money goes back to corrections agencies in the form of kickbacks. But what happens to it from there?
Our report analyzes how prisons and jails funnel money from incarcerated people and their families into “Inmate Welfare Funds” — and then use it to cover the costs of incarceration.
An investigative report in Dauphin County, Pa., found that only a small fraction of welfare fund expenditures from 2019 to 2023 directly benefitted people incarcerated in the jail. While few jail and prison policies explicitly outline what qualifies as an appropriate use of funds, our breakdown above generally follows the logic of a Montana audit that attempts to parse appropriate, questionable,and inappropriate expenditures.
More than 1 in 10 people admitted to state prisons every year have committed no new crime, but have simply broken one or more of the many conditions, or rules, of their probation. Our report provides one of the most comprehensive 50-state compilations of “standard” conditions of probation to date, shining a light on the burdensome rules that govern the lives of nearly 3 million people and that doom many to inevitable further punishments.
To understand how the overturn of Roe impacts women under the U.S.’ massive system of community supervision, we examined standard supervision conditions in each state, along with the number of women who must comply with them. We found that the one-two punch of abortion and supervision restrictions impacts an estimated 4 out of 5 women(82%) on probation or parole nationwide. That means that for the vast majority of people under community supervision, the ability to seek abortion care out-of-state is left not to the pregnant person, but to the discretion of a correctional authority, typically their probation or parole officer.
Map 1 The vast majority of states have some kind of abortion ban as well as standard conditions of both probation and parole that restrict interstate travel. Click here to see a map of abortion bans in place as of May 2024.
Map 2 Probation is the most common form of correctional control for women in the U.S., and almost every state has a standard condition of probation restricting travel. Probation populations here exclude federal. Click here to see a map of abortion bans in place as of May 2024.
Map 3 While fewer women are on parole supervision compared to probation, nearly all live in states that restrict interstate travel for everyone on parole. Parole populations here excluded federal. Click here to see a map of abortion bans in place as of May 2024.
Donald Trump’s legal proceedings would not have stopped him from being president and most likely won’t create many obstacles that a billionaire can’t handle. But there are still more than 19 million people in the US with felony convictions that face hiring discrimination for ordinary jobs every single day. In this briefing, we explain how states can end removed barriers that prevent people with felony convictions from securing good jobs.
In this briefing, we compile ten examples of how mass incarceration blocks progress toward economic justice. We argue that our massive system of criminalization is not an isolated issue, nor is it someone else’s problem; it is an engine of inequality that traps people in poverty, weakens worker power, and undermines political organizing toward a more prosperous future for the vast majority of people.
The U.S. incarceration rate has closely tracked the rise in the share of national income held by the wealthiest 1% of Americans. For most of the 1950s, 60s, and 70s, the top 1% held about 10% of the total national income while the U.S. imprisoned about 100 people per 100,000. By the 2000s, the share held by the top 1% had doubled to around 20% while the incarceration rate grew to five times the historical norm.
Journalists, advocates, and other users of our website reach out frequently to ask if we know the total number of people released from prisons and jails in their state each year. Many are trying to fight for more resources for people returning home and want to know how these numbers break down by sex. While these are numbers you might expect would be easy to find, they aren’t published regularly in annual reports on prison and jail populations by the Bureau of Justice Statistics (BJS). To make this information more accessible, we’ve drilled down into the most recent data available to show how many men and women are released from prisons and jails each year.
Jails and prisons are often described as de facto mental health and substance abuse treatment providers, and corrections officials increasingly frame their missions around offering healthcare. But the reality is quite the opposite: people with serious health needs are warehoused with severely inadequate healthcare and limited treatment options. This briefing builds on our past work about the unmet health needs of incarcerated people and the endless cycle of arrest for people who use drugs by compiling data on treatment availability versus drug-related punishment in jails and prisons across the country. We find that despite the lofty rhetoric, corrections officials punish people who use drugs far more than they provide them with healthcare.
Based on 2019 data from the National Survey of Drug Use and Health (NSDUH) from SAMHSA, approximately 8% of people over the age of 12 met the criteria for a substance use disorder, and 41% of people who had been arrested in the last year met the criteria for a substance use disorder. In 2016 (the most recent year for which the Bureau of Justice Statistics published national prison data), 47% of people in state and federal prisons met the criteria for a substance use disorder in the 12 months prior to their most recent prison admission.
The Federal Communications Commission voted to implement several new regulations on phone and video calling services in prisons and jails. As required by the 2022 Martha Wright-Reed Fair and Just Communications Act, the FCC laid out new price caps that prisons, jails, and their telecom providers must abide by, significantly lowering the existing caps which were set in 2021. The agency also made a number of long-sought reforms that will bring critical relief to families of incarcerated people and reduce incentives for bad policy in prisons and jails.
This year, Minnesota joined the rapidly growing list of states that have taken action against prison gerrymandering. The measure requires state and local governments to count incarcerated people at their home addresses when drawing new political districts during their redistricting process. This is a huge win and yet another reason for the Census Bureau to finally change how it counts incarcerated people and end prison gerrymandering nationwide.
At the request of the Georgia-based Community Over Cages Coalition, the Prison Policy Initiative examined the proposal for a new jail and found serious shortcomings. In a 17-page memo, we explained how the overuse of pretrial incarceration hurts communities, the feasibility study the county commissioned failed to consider alternatives to new jail construction, and it also ignored that a massive new jail would exacerbate existing staffing issues. Less than one month after the release of our findings, the Fulton County Board of Commissioners voted to scrap its $2 billion plan, marking a major victory for advocates.
If your community is considering building a new jail or expanding the capacity of its existing facility, we may be able to help you push back. Drop us a line to tell us about your fight.
This collection of work only scratches the surface of what we accomplished in 2024 — and our work is far from over. Next year, we’ll continue to expose the ways that mass incarceration harms people on both sides of the bars and highlight solutions that keep communities safe without expanding prisons, jails, and the carceral system.
Using a novel data source, we examine the flow of individuals booked into a nationally-representative sample of jails along lines of race, ethnicity, sex, age, housing status, and type of criminal charge.
Millions of people are arrested and booked into jail every year, but existing national data offer very little information about who these people are, how frequently they are jailed, and why they are jailed. Fortunately, we now have new data through a collaboration with the Jail Data Initiative to help answer these questions: In 2023, there were 7.6 million jail admissions; but 1 in 4 of these admissions was someone returning to jail for at least the second time that year. Based on the Jail Data Initiative data, we estimate that over 5.6 million unique individuals are booked into jail annually1 and about 1.2 million are jailed multiple times in a given year. Further analysis reveals patterns of bookings — and repeat bookings in particular — across the country: The jail experience disproportionately impacts Black and Indigenous people, and law enforcement continues to use jailing as a response to poverty and low-level “public order” offenses.
We first looked into these questions about repeat jail bookings in our 2019 report, Arrest, Release Repeat: How police and jails are misused to respond to social problems. In particular, our 2019 analysis found that repeated arrests are related to race and poverty, as well as high rates of mental illness and substance use disorders. While these new data don’t include as many contextual details as the survey we used in that analysis, the Jail Data Initiative data offer a more accurate accounting of unique versus repeat jail bookings — a number that the Bureau of Justice Statistics still does not collect or report. Our two analyses are not directly comparable: Our 2019 report uses data from a public health survey, the National Survey of Drug Use and Health, while the Jail Data Initiative data we use here are collected directly from online local jail records and updated daily.23 As a result, these reports have different strengths: this analysis can provide more accurate jail booking data because of the much larger sample size, while Arrest, Release, Repeat offers more descriptive data about people who have been jailed, including details regarding health, education, and income.
More than 1 in 5 people are jailed multiple times a year
While unique jail admissions (the number of individual people admitted to jail) account for three-quarters of jail bookings, more than 1 in 5 people (22%) booked into jail are booked again within 12 months. People who are jailed multiple times a year inevitably face exacerbated consequences of incarceration: As we have discussed before, there is no “safe” way to jail a person, nor is there an amount of time a person can be detained without escalating short- and long-term risks to themselves, their families, and their communities, including rearrest, legal debt, missed work, lost jobs, and health risks.
Racial disparities in jail admissions extend to repeat bookings
Black people are overrepresented in every part of the criminal legal system including jails, and this new data reveal that not only are Black people jailed at alarmingly high rates, but they are jailed again and again. Relative to their share of the total US population (14%), Black people are greatly overrepresented among the unique jail admissions in this sample (32%) and the people booked multiple times in a year (29%), while white people are underrepresented in both populations. This is consistent with what we know about the over-incarceration of Black people in this country, but the rebookings data add another layer of detail about their experiences with law enforcement, which often targets Black communities.4
Indigenous people account for only 1% of the total U.S. population, but 3% of the incarcerated population, with incarceration rates between two and four times higher than that of white people.5 In the Jail Data Initiative data, we find that Indigenous people are especially likely to be booked into jail multiple times: 33% of Indigenous bookings were people who had been booked at least once in the past 12 months, compared to 18-22% among other racial and ethnic groups.
Women are funneled into jails
Women make up about a quarter of individuals booked into jail each year, which is in line with annual arrest data showing 27% of arrests in 2023 were of women.6 While we found no significant difference between men and women in terms of multiple jail admissions, we do know that the jail incarceration of women is growing: From 2021 to 2022, the number of women in jail increased 9% while the number of men in jail increased only 3%. The jailing of women has a devastating “ripple effect” on families: At least 80% of women booked into jail are mothers, including over 55,000 women who are pregnant when they are admitted. Beyond having to leave their children in someone else’s care, these women are impacted by the brutal side effects of going to jail: aggravation of mental health problems, a greater risk of suicide, and a much higher likelihood of ending up homeless or deprived of essential support and benefits. So while women may account for a relatively small share of people booked into jails, those jail admissions have serious and long lasting consequences for the women, their families, and their communities.
1 in 10 people booked are 55 years or older
Older adults account for one in ten of all jail bookings, but a slightly smaller share of rebookings (7%). This is consistent with existing arrest data that show an increasing proportion of older adults caught up in the criminal legal system: In 2021, people 55 years or older accounted for 8% of all arrests, a four-fold increase from their share of arrests in 1991. The Bureau of Justice Statistics only began publishing the age ranges of people in jails in recent years, but from 2021 to 2022, the jail incarceration rate of people 55 and older increased by 8%, compared to a 3% increase in jail incarceration rates across all other age groups. Considering most older adults are arrested for low-level, non-violent offenses like trespassing, driving offenses, and disorderly conduct,7 it is likely that the older adults admitted to jail are in need of other systems of support outside of the criminal legal system, like substance use treatment, accessible medical care, and behavioral health services.
More than 40% of unhoused people booked into jail were booked again within the year
Poor people in the United States are a primary target for policing, especially those forced to live on the streets: In a 2022 analysis of Atlanta city jail bookings, we found that 1 in 8 admissions involved people experiencing homelessness, a proportion more than 30 times greater than the city’s total unhoused population. In this analysis of the Jail Data Initiative data, we find that across the 140 jails that include housing status on their online rosters, 4% of individuals booked are explicitly listed as unhoused, although this is almost certainly a significant undercount.8 While this is a relatively small portion of all bookings, unhoused people were the most likely to be jailed multiple times across all the demographic categories we looked at: Over 40% of unhoused people booked into jail were booked more than once in a twelve month period. This finding adds to the existing evidence of law enforcement’s ineffective but disproportionate and deliberatetargeting of people experiencing homelessness.
Most people are jailed for public order, property, or drug charges — not “violent” charges
The Bureau of Justice Statistics last collected charge data for jail populations in their 2002 Survey of Inmates in Local Jails. Given that the most recent jail offense data is over 20 years old, the Jail Data Initiative dataset offers a rare opportunity to analyze the top charges9 that people are booked under nationwide. Of course, the difference in data sources makes a fully apples-to-apples comparison of the 2002 data and the more recent Jail Data Initiative data impossible.10 The data provided in the Bureau of Justice Statistics survey reflects self-reported information from people detained in a sample of local jails on a single day in June 2002, while the Jail Data Initiative data is based on jail bookings across a two-year time period and relies on administrative data. Nevertheless, the overall trends since 2002 offer some valuable insights into the reasons people are detained in jails today:
Drug charges appear to play a smaller role now than they did two decades ago, when the “war on drugs” was in full effect. In 2002, a quarter of people in jail were held for drug charges, compared to 14% of people admitted to jail in our 2021-2023 sample.
Property charges also appear to represent a smaller portion of the jail population now than they did in 2002: Property charges are the top charge for 19% of jail admissions, compared to 24% of the jail population in 2002.
In 2002, public order charges were the top charge for 25% of people in jail, but now, 31% of people admitted to jail are booked for a most serious charge related to public order, such as disorderly conduct, loitering, and public intoxication.
We see very little change in the proportion of people in jail for violent charges: in 2002, 25% of people were in jail for a violent charge and in our analysis of more recent jail bookings, about 26% of jail bookings were for violent charges.
In our 2021-2023 sample, only one-third (33%) of people booked multiple times had a top charge categorized as violent in the study window, suggesting that the vast majority of people admitted to jail — including people booked repeatedly — are not accused of violent charges like homicide, assault, robbery, or sexual assault.
In their own analysis of a similar sample of the dataset, researchers at the Jail Data Initiative, Orion Taylor and Anna Harvey, found that rebooking rates vary by the type of initial booking charge. Looking closely at the rates of people returning to jail on serious violent charges11 within six months of their release from jail, they found the average rebooking rate for a serious violent charge was only 2% for people initially booked into jail on any other kind of top charge. The rate was only slightly higher (9%) if they were also jailed on a serious violent charge initially.12
Conclusion
The Jail Data Initiative offers a sorely-needed alternative source of information about jail admissions and about people who are jailed repeatedly. In many ways, our findings from this analysis support what we already know: people who are arrested and booked more than once per year often have other vulnerabilities, including homelessness, in addition to the serious medical and mental health needs of this population that we discussed in our 2019 analysis based on public health data. In addition, this dataset fills a serious gap in our knowledge about the demographics and charges of people booked into jails, given that comparable data has not been collected or published from the Bureau of Justice Statistics in over twenty years.
Methodology
The Jail Data Initiative (JDI) collects, standardizes, and aggregates individual-level jail records from more than 1,000 jails in the U.S. every day. These records are publicly available online in jail rosters — the online logs of people detained in jail facilities that often include some personal information like name, date of birth, county, charge type, bail bond amounts, and more. JDI uses web scraping — the process of automating data collection from webpages — to update their database of jail records daily.13 The more than 1,000 jails included in the Jail Data Initiative database represent more than one-third of the 2,850 jails identified by the Bureau of Justice Statistics’ Census of Jails, 2019 and are nationally representative.
Of course, not all of the jails included in the Jail Data Initiative database provide the same information. For the purposes of our analysis, we used data from 648 jail rosters for which there was available data for a two-year window (July 1, 2021 to June 30, 2023), plus an additional 365 days for a look-forward review of rebookings (to June 30, 2024). We looked at people who were both booked into jail and released within the two-year study period, and counted people as “rebooked” or “booked two or more times” if they were booked into the same jail system within 365 days of their first jail admission in the study time period. We elected to use a two-year time frame to capture a larger sample of bookings than we could in a single calendar year.
In all, there were 2.9 million jail bookings captured across these 648 rosters, representing almost 2.2 million unique individuals booked into jail: People who were booked more than once in the two-year window accounted for 26% of all bookings.14 For the more detailed analyses of jail bookings and rebookings by race and ethnicity, gender, age, housing status, and charge type, we had to use subsets of this sample of 648 rosters because the inclusion of these details was less consistent:
Race and ethnicity: Of the 648 rosters in this sample, 437 rosters (67%) included the relevant race and/or ethnicity data needed for this analysis.15 Often, the data included in these jail rosters are administrative decisions and may not reflect an individual’s self-identified race or ethnicity.16 The final sample of rosters with race information included 1,923,668 bookings from 1,437,730 individuals.
Gender: Of the 648 rosters in this sample, 517 rosters (80%) included the relevant gender data needed for this analysis.17 Out of the more than two million bookings in this subset, 75 bookings with values of “trans” or “nonbinary” were omitted because of the small sample size.18 The final sample of rosters with binary “male” and “female” gender identifiers included 2,180,992 bookings from 1,623,638 people.
Age: Of the 648 rosters in this sample, 529 rosters (82%) included the relevant age data (under 55 years of age or 55 years and older) needed for this analysis.19 The final sample of rosters with age information included 2,393,299 bookings from 1,775,721 people.
Housing status: Of the 648 rosters in this sample, only 140 rosters (22%) included housing information needed for this analysis. This is the fewest rosters included in any of our subsets of the Jail Data Initiative dataset because most rosters in the sample do not have clear indications of housing status. We categorized individuals as “unhoused” if a person was reported unhoused upon admission for any of their bookings in the two-year period,20 and all other housing statuses were considered “housed or unknown housing status.” The final sample of rosters with housing information included 599,423 bookings from 457,025 people.
Charge type: Of the 648 rosters in this sample, 554 rosters (84%) included the relevant charge data needed for this analysis.21 Charges were grouped into the following categories (in order of severity, from most severe to least severe): violent, property, drug, public order, DUI offense, and criminal traffic. Because the top charge category does not indicate whether it was the first, second, or subsequent booking that had the top charge, nothing should be inferred about release decisions. The final sample of rosters with charge information included 2,517,899 bookings from 1,869,156 people.
Jail bookings — or admissions — involve the administrative process of collecting and entering information about the individual into the jail system and subsequently detaining that person in a jail facility. Almost all arrests lead to at least some in jail. ↩
The jail records and data are collected from jail rosters — publicly available, online logs of all individuals detained in a jail facility on a given date. The jail rosters used by the Jail Data Initiative are updated at least daily, excluding any jail rosters that are updated less frequently. A single jail roster may contain information for multiple counties or facilities: for example, West Virginia provides a single online search portal for all jails in the state. ↩
While the Jail Data Initiative data includes individual-level jail data in approximately 1,300 local jails, representing over one- third of all local jails in the country, this current analysis is based on a subset of those jails: 648 jails rosters with available data throughout the study period of July 1, 2021 to June 30, 2023. See the Methodology for more details. ↩
People who are arrested and jailed are often among the most socially and economically marginalized in society. The overrepresentation of Black people among those who are arrested is largely reflective of persistent residential segregation and racial profiling, which subject Black individuals and communities to greater surveillance and increased likelihood of police stops and searches. Poverty, unemployment, and educational exclusion are also factors strongly correlated with likelihood of arrest. ↩
Throughout this briefing, “Indigenous” refers to people identified in jail rosters as Native American, American Indian, Alaska Native, or Indigenous. This is inevitably an undercount of Indigenous people in local jails, given the flawed single-race categorization system that frequently obscures data on Indigenous people throughout the criminal legal system. For more information, see our profile page on Native incarceration in the U.S. ↩
According to the FBI’s National Incident-Based Reporting System (NIBRS), Table 13: Arrestees Age by Arrest Offense Category, 54% of people 55 and older arrested in 2023 were arrested for “Group-B offenses” including trespassing, driving offenses, and disorderly conduct. ↩
“Unhoused” refers to people who were positively identified as unhoused on the jail roster. This is likely a significant underestimate because many more unhoused people may have chosen to list a shelter address, a family member’s address, or another location as their address when they were booked into jail. This estimate is based on only bookings from 140 jail rosters where housing status was indicated for at least one booking in the study time period. If a person was reported unhoused upon admission for any of their bookings, they were counted as “unhoused.” Because of the unique method required to standardize this indicator (it is extracted from a variety of fields by substring searching), and because it is only reported in the positive, we cannot assume that people who are not reported to be unhoused are housed; rather, we assume that they are either housed or have an “unknown” housing status. Unlike the larger sample used in other parts of this analysis, the final sample for this part included 599,423 bookings involving 457,025 individuals. ↩
The “top charge” category reflects the most serious charge from among all jail bookings for that individual. For example, if the first booking for an individual was for a criminal traffic offense and a subsequent booking three months later was for a violent offense, that person’s “top charge” category is “violent.” The charge categories are based on the CJARS Text-based Offense Classification (TOC) model and include, from most severe to least severe: violent, property, drug, public order, DUI offense, criminal traffic. ↩
In particular, the offense distribution of the static one-day population in jails is likely to differ from the offense distribution of all jail bookings over a longer time period, because charges are directly related to the likeliness of pretrial detention, and in turn, how long people stay in jail. For example, courts are likely to set higher bail amounts or deny bail for people booked on serious charges (especially charges of violence) and more likely to order release without monetary conditions for people accused of less serious charges. Additionally, less serious offenses carry shorter sentences that result in quicker release from jail even when people are convicted. Therefore, we would expect a higher proportion of “violent” and serious charges in the one-day jail population than we would across all admissions. ↩
In that analysis, the researchers considered “serious violent charges” to include murder, unspecified
homicide, voluntary/nonnegligent manslaughter, non-vehicular manslaughter, aggravated assault, kidnapping, rape, statutory rape, lewd act with children, sexual assault, and human trafficking. ↩
As the authors of that study write, “In other words, over a 6-month period, a recently released individual originally booked on a top charge not involving serious violence can be expected to be charged with 0.02 crimes of serious violence. A recently released individual originally booked on a top charge of serious violence can be expected to be charged with 0.09 crimes of serious violence.” ↩
For more information about the data collections and web scraping process, cleaning of the data, aggregations, and other relevant methodological details used by the Jail Data Initiative, please see their documentation and methodology at https://jaildatainitiative.org/documentation/about. ↩
Across the 648 rosters, some bookings were excluded from the analysis due to potential issues with date range overlap (12,413 bookings) and issues with unique person identification (15 bookings). ↩
In criminal legal system data, race and ethnicity are not always self-reported (which would be ideal). Police and jail administrators may report an individual’s race based on their own perception — or not report it at all — and the jail rosters used by Jail Data Initiative rely on administrative data, which may not reflect how individuals identify their own race or ethnicity. ↩
Gender is not always self-reported (which would be ideal) in criminal legal system data. Police and jail administrators may report an individual’s gender or sex based on their own perception — or not report it at all — and the jail rosters used by Jail Data Initiative rely on administrative data, which may not reflect how individuals identify their own gender. For more information on how the Jail Data Initiative standardized sex and gender across rosters, please see their documentation page at https://jaildatainitiative.org/documentation/glossary. ↩
While these 75 bookings could not be included in this analysis, we know that trans and non-binary are disparately impacted by the criminal legal system: In particular, Black trans people and other trans people of color face high rates of police harassment and high lifetime rates of incarceration. In jails and prisons, trans people face high rates of assault, are frequently denied healthcare, and are at high risk of being sent to solitary confinement. We suspect that because most jail systems likely operate on a gender binary (male/female), this likely represents a serious undercounting of trans and non-binary people admitted to jails. ↩
For more information on how the Jail Data Initiative standardized age across rosters, please see their documentation page at https://jaildatainitiative.org/documentation/glossary. For this analysis, we were interested in looking specifically at the jailing of older adults, so we collapsed all categories younger than 55 into one group, and all categories 55 and older into another. ↩
This ultimately results in a significant undercount of the unhoused population admitted to jail: administrative records of unhoused people may include previous addresses, shelter addresses, or addresses of family and friends and would therefore not be considered “unhoused” in jail records. ↩
Using the Criminal Justice Administrative Records System (CJARS) Text-based Offense Classification (TOC) algorithm, the Jail Data Initiative standardized the most severe charge reported for individuals into the following categories (in order of severity, from most severe to least severe):
Violent
Property
Drug
Public order
DUI offense
Criminal traffic
An overall top charge category per person was determined by selecting the most severe charge from among all bookings for that individual. For more information on how the Jail Data Initiative standardized the “top charge” — or the most severe charge reported — across rosters, please see their documentation page at https://jaildatainitiative.org/documentation/glossary. ↩
Election Day is right around the corner. While presidential campaigns get most of the attention from the news media, many lesser-known down-ballot races can have a much more dramatic impact on criminal legal system reform in America.
For voters interested in ending mass incarceration, we’ve put together a guide to the most common offices for which they will cast their ballots this November. We also explore how those offices can make decisions to reduce the number of people behind bars, improve conditions in prisons and jails, and help turn the page on America’s failed experiment with mass incarceration.
It’s worth recognizing that there are significant differences in what an office might be called and its exact responsibilities from state to state and city to city, so readers should keep in mind that this might not be a perfect match for their area. Additionally, it would be impossible to list all of the complex and far-reaching ways some offices influence the criminal legal system. This guide focuses on the most common and consequential offices and responsibilities in this realm and is not intended to be all-encompassing. With this guide, we aimed to give people a starting point for their research to better understand the roles and powers of the offices they’ll be asked to vote for.
Readers should use this guide to evaluate their candidates for office, press them to take clear stands on how they’ll use their position to improve the criminal legal system if elected and hold them accountable for those commitments once they take office.
Local Offices
Most of the day-to-day interactions that people have with the criminal legal system involve local governments. Local governments are responsible for a wide swath of related activities, including policing and law enforcement, the prosecution of criminal laws, and conditions and policies at local jails.
District/County Attorneys
Because of their immense power, government prosecutors known as district attorneys (sometimes called county attorneys) loom large in any discussion about the criminal legal system and what can be done to reform it. And it is important to remember that the person who holds this office has immense discretion in how to use this power.
They oversee the vast majority of criminal cases in their jurisdiction. Not only do they determine which types of offenses to prioritize for prosecution, but in individual cases, they also determine whether to bring charges against someone and, if so, for what crime.
“You forgot an office”
Some states have unique offices that play a role in the criminal legal system. Here are a few.
In this guide, we tried to cover as many of the elected offices that can play a role in the criminal legal system as possible, but we know we didn’t cover everything. There are many offices that we did not include that are unique to one or a handful of states that can also take action on these issues. They’re still worth focusing on.
Here are a few examples:
Public Defenders: Some places elect their public defenders, including counties in Florida and districts in Tennessee, as well as the cities of Lincoln, Nebraska, and San Francisco, California,
High bailiffs: Vermont’s high bailiff office has often been overlooked as an opportunity for reform. However, recent candidates have seen this office as an opportunity to provide more oversight of law enforcement in their counties.
Police oversight boards: Some places, including Chicago, have elected police oversight boards. This board is designed to give the public more say over the activities and priorities of their local police department.
Governor’s Council: At least one state, Massachusetts, elects members to its Governor’s Council. This body has a long list of responsibilities, but of note, it is responsible for hearing pardon and commutation petitions and approving appointments of state judges. This gives the board considerable ability to decide when people are released from prison, as well as who the judges are that are overseeing criminal cases.
We encourage you to look at your ballot closely before Election Day to see what offices you’ll be asked to vote for. If you’re not sure what a particular office does, do some additional research to see if they, too, can help end mass incarceration where you live.
Additionally, while they don’t directly set bail conditions — judges generally do that — they usually recommend whether a person should be offered bail and, if so, whether they must pay money to go free before their trial. Their recommendations hold immense weight in these judicial decisions.
They also serve as gatekeepers to diversion programs. These programs allow people charged with crimes to resolve their cases without a criminal conviction and, in many cases, without incurring charges. The district/county attorney decides what those diversion programs look like, whom they are offered to, and what happens when someone completes it.
While this explanation covers the most prominent parts of the district attorney’s job, it is certainly not exhaustive. To learn more, we recommend reading Fair & Just Prosecution’s report, 21 Principles for the 21st Century Prosecutor, which goes into much greater detail.
Sheriffs
Sheriffs play many roles in the criminal legal system that can vary greatly from state to state and county to county. Generally speaking, though, their core responsibility is running the county jails, making them responsible for managing the conditions in which people are detained pretrial.1 Importantly, in this role, they’re responsible for the health and safety of people who are in their custody, including what health services they have access to while incarcerated. Additionally, they enter into contracts with private companies that provide services, such as phone calls, commissary sales, and tablet computers. They decide what people detained in their jails are charged for these services.
Additionally, many sheriffs also conduct law enforcement activities and criminal investigations. This gives them wide latitude in determining who is arrested and for what offenses.
Finally, some sheriffs also oversee probation programs and officers. In this role, they have a huge impact on the lives of people on probation. They can prioritize the person’s successful completion of the program in a way that keeps them from being arrested or incarcerated again, or they can prioritize punishment by strictly enforcing arbitrary and often expensive conditions that set people up to fail.
County Commissioners
County commissioners2 generally have two primary responsibilities when it comes to the criminal legal system.
First, they provide oversight of the county jail, including setting budgets and approving contracts for services. Notably, they are also often responsible for considering proposals for new jail construction. During debates about building a new jail or expanding an existing one, county commissioners have powerful leverage that they can and should use to ensure that prosecutors and law enforcement are doing everything they can to reduce the number of people stuck in jails unnecessarily.
Second, they allocate funding and, in some jurisdictions, provide oversight of the county sheriff’s department. This can influence the law enforcement presence in the community and the activities the department is tasked with prioritizing.
Mayors and City Commissioners
These offices are responsible for supervising the local police department. This includes determining its funding, providing some oversight of its activities, and selecting its chief. Through these choices, they determine the size, scope, and priorities of the police departments in their communities.
Additionally, they set funding levels for other community resources that can prevent law enforcement interactions in the first place. For example, they could direct funding to expand mental health services, drug treatment options, or pre-police diversion programs in their area.
City/County Auditors and Controllers
City and County Auditors do far more than just monitor the spending of agencies (although they can, in fact, do that). They also look at the overall performance of key departments. For example, they can look at how jails are administering their welfare funds, how police departments are responding to the needs of the communities, jail conditions, the administration of the county’s bail practices, how public housing and health care providers are delivering services, and much more. Through their work, auditors and controllers can act on behalf of residents of their community to provide much-needed transparency and ensure their government is properly and effectively serving them.
Local Judges (including Justices of the Peace)
Local judges play multiple roles in the criminal legal system. While they are intended to be unbiased arbiters between the prosecution and defense in criminal cases, their decisions can have a huge impact on whether a person is convicted and whether they serve time behind bars — both before and after a conviction. They preside over a person’s initial court appearance after their arrest, at which time they’ll determine whether they can be released from jail, whether they have to pay cash bail to be released, and if there are any other conditions of their release. They also oversee criminal proceedings in the courtroom when a person goes to trial. In this role, they participate in decisions around who is selected as jurors, what evidence can be admitted, how the trial is run, and determining their sentence (if convicted). Importantly, they also set conditions a person must abide by when they are on probation.
Coroners
When someone dies unexpectedly, coroners often conduct medical examinations to determine the person’s manner and cause of death. Their findings and reports are often pivotal in criminal investigations and hold immense weight in criminal trials. Coroners can help expose the truth in criminal cases. Conversely, though, their mistakes can also send people to prison for crimes they did not commit. Importantly, corners are also often responsible for investigating the deaths of incarcerated people.
City/County Clerks (sometimes known as Supervisor of Elections)
This office, which has many different names across the country, has a key interaction with the criminal legal system: jail voting. Most people in jails are still eligible to vote but are prevented from doing so by a complex set of barriers. This office can help clear those barriers. They can work with local jails to make it easier for people detained there to register to vote and cast their ballots. A growing number of places in the country have even established polling locations in jails to make it easier for incarcerated people to have their voices heard.
School Board Members
The intersection of education and incarceration is complex. In short, we know that people with lower educational attainment are more likely to be incarcerated. So, in essence, every choice school board members make can help reduce incarceration in the community in the long run.
There are additional — more direct — choices that school board members make related to the criminal legal system. The first is whether or not police have a presence in schools as school resource officers. Second, school boards also set disciplinary policies, many of which are directly linked to the “school-to-prison pipeline,” such as when a student is suspended or expelled and when law enforcement is called for disciplinary activities in the schools. Both of these choices can result in children being tangled in the criminal legal system at a young age. Finally, in some places, they also are responsible for ensuring students in the juvenile justice system have equitable access to quality education.
State Offices
State government looms large in the criminal legal system. Not only are state prisons the largest incarcerators in the country, locking up over 1 million people every day, but states also write and enforce the laws that most frequently result in people being locked up in the first place.
Governors
Governors lead their state’s government, so naturally, their power and responsibilities are far-reaching. However, there are several specific areas that have a particularly dramatic impact on the size, scope, and conditions of the criminal legal system in their state.
One of the most important things they do is appoint the head of their state’s Department of Corrections, which runs state prisons.3 This agency is responsible for the health and safety of people incarcerated, how those facilities operate on a day-to-day basis, and how much incarcerated people (and their families) pay for things like phone calls, commissary items, and more. It also shapes policies around the use of good time credits, parole, and compassionate release.
An underappreciated role of governors is appointing people to state boards and commissions. The people appointed to these bodies can have a huge influence on how state government runs, and their decisions often go unnoticed by the public and the media. Notably, in many states, governors appoint people to their state’s parole board, a body that determines whether people who have served time behind bars are released or not. Additionally, in states that have prison ombuds, the governor often appoints the person who serves in that position.
Similarly, governors have the power to issue pardons and commutations for people convicted of state crimes. These can result in a person being released from prison early or undoing some of the worst collateral consequences of their conviction. Unfortunately, though, governors have woefully underused this important power.
Finally, governors sometimes appoint state judges to the bench. We discuss the role of judges in other parts of this guide, but in general, they are responsible for presiding over criminal cases, including determining the sentence for people found guilty and, in some instances, determining whether laws passed by the state are unconstitutional.
Attorneys General
Attorneys General are often called the top law enforcement officer in the state, and for good reason. While the specific duties and responsibilities vary significantly from state to state, generally speaking, this office plays an oversight or coordinator role for county/district attorneys in their state, often helping to set standards for criminal prosecutions. In addition, they can investigate and prosecute some serious criminal cases on their own. If a person is convicted of a crime and appeals that conviction, this office generally argues against those appeals.
Importantly, this office also represents the state when it faces civil lawsuits. For example, if a family sued the state government over poor prison conditions, the attorney general would likely represent the state in that case.
An often overlooked responsibility of many attorneys general is enforcing their state’s public records law. Prisons, jails, and court systems routinely unfairly deny requests for public records that should legally be accessible. In many states, advocates and journalists who have had their requests denied can often ask the attorney general of their state to intervene and force the facilities to produce the records.4
Secretaries of State
Secretaries of State generally oversee elections in their state. In this role, they can take action to improve ballot access for people who are currently in jail (and, in a few states, for people in prison, too). A motivated secretary of state can prioritize voter registration in these facilities and proactively address problems people who are incarcerated may face when attempting to cast their ballot. Additionally, they often provide guidance to local election officials, which gives them the chance to further improve ballot access.
State Legislators
State legislators have one of the most important and often overlooked roles in the criminal legal system. It is not an exaggeration to say that the only constraints on their abilities are state and federal constitutions, money, and their imagination. Their primary responsibility is writing and passing laws. They determine what is a state crime, the punishment for those offenses, the conditions a person will face after they are released, and much more. State lawmakers have so much power, in fact, that we put out an annual report highlighting dozens of actionable steps they can take to reform the criminal legal system without making it bigger.
In addition to passing laws, state legislators are also responsible for developing a state government budget that allocates money to state prisons and many law enforcement agencies. Through this action, they can influence the size and number of prisons in their state, the conditions in those prisons, and the role of law enforcement in their communities.
Notably, state lawmakers also can serve on legislative oversight committees that review the activities of government agencies, including state prisons.
State Auditors and Comptrollers
While the exact responsibilities and titles differ significantly from state to state, state auditors and comptrollers are generally tasked with assessing how well state agencies are doing their jobs and spending money. This goes beyond simple accounting. They can look at any number of activities of their Department of Corrections or state law enforcement officials. For example, a 2020 audit by the Massachusetts State Auditor found the state’s Department of Corrections was not processing sick-call requests from incarcerated people as quickly as required and was not fulfilling its obligations to incarcerated people upon their release. Used correctly, these can be powerful offices for exposing the mistreatment of people in the criminal legal system and the mismanagement of public dollars.
Utility Commissioners
Utility Commissions are tasked with regulating the state’s utility companies, such as electric providers, phone companies, and similar businesses. While it may seem like this has little to do with prisons and jails, in some states, these officials have played a critical role in reducing phone rates behind bars. For example, changes made by the Iowa Utilities Board to jail phone rates saved the loved ones of incarcerated people roughly $1 million every year. While the Federal Communications Commission recently approved rules that will significantly reduce voice and video calling rates in prisons and jails, the work of Utilities Commissions is not done. They can still take action to address the rapidly expanding presence of tablets and other telecom services behind bars to ensure that incarcerated people are not taken advantage of.
Appellate Court Judges
After a person is convicted of a crime, they have a right to appeal their conviction. That’s where appellate court judges come in. They oversee these appeals to determine whether the trial was held in a manner that was fair and respected the constitutional rights of the person convicted of a crime. They have the power to affirm or overturn a person’s criminal conviction or sentence.
Supreme Court Justices
State supreme courts are generally considered the most powerful court in their state. If a person convicted of a crime is unsuccessful at appealing their case in front of the appellate court judge, they can ask the state supreme court to hear the case as well.
Additionally, these courts are tasked with assessing the constitutionality of laws and policies related to the criminal legal system. This can include a wide variety of issues, such as policing practices, prison and jail conditions, and whether state laws violate a person’s constitutional rights.
Federal Offices
The federal government’s role in mass incarceration is vast and complex. Even though the federal prison system holds only about one-quarter as many people as state prisons collectively do, the federal government is still responsible for 98 federal prisons and 142 immigration detention facilities. Also, through the Department of Justice, it oversees federal law enforcement and criminal prosecutions.5
President
Like governors, the ways the president can impact the criminal legal system are vast.
One of the most consequential decisions they make is who they appoint to be Attorney General of the United States. This person will oversee the Federal Department of Justice, which prosecutes all cases involving allegations of federal crimes. Similarly, the president appoints U.S. Attorneys who oversee those prosecutions. The Attorney General and U.S. Attorneys have considerable latitude on which cases to pursue, which crimes are prosecuted, and the desired punishment if a conviction is secured. Additionally, the Attorney General oversees the Bureau of Prisons (BOP), which operates all federal prisons. The BOP is responsible for a wide range of prison conditions, including the health and safety visitation policies and communication options for people incarcerated at its facilities.
Presidents are also responsible for signing (or vetoing) bills passed by Congress. And even before a bill makes it to their desk, they work with lawmakers to shape that legislation. These laws can have far-reaching effects, as we discuss below when talking about the responsibilities of members of Congress.
One of the president’s most long-lasting impacts comes through his or her appointments of federal judges, including U.S. Supreme Court Justices. In addition to hearing federal criminal cases, federal judges often also interpret laws to determine whether they violate the U.S. Constitution.
The president also appoints members to boards and commissions focused on a wide range of issues. For example, the president appoints commissioners to the Federal Communications Commission, which recently slashed calling rates in prisons and jails. The president also appoints members to the Federal Trade Commission, which oversees many consumer issues, including junk fees in prisons and jails. They also appoint members to the U.S. Sentencing Commission, which has a hand in determining the severity of sentences for people convicted of federal crimes.
Finally, presidents have the power to issue pardons and commutations for people convicted of federal crimes. Unfortunately, though, they rarely use this power. Through these acts, the president can either reduce the sentence of someone convicted of a crime or undo some of the worst consequences of that conviction.
Members of Congress
Like state legislators, the principal responsibility of members of Congress is passing laws. Through these laws, they determine what actions are considered federal crimes and the potential sentences for people convicted of those crimes. They can also pass legislation to address issues related to prisons and jails at the federal, state, and local levels of government. For example, members of Congress have brought forward a bill to end prison gerrymandering nationwide.
The other principal responsibility of members of Congress is developing and passing a budget that determines how much money is allocated to federal agencies, including the Department of Justice and the Bureau of Prisons. These budgets can have wide-ranging implications for the number of people incarcerated, the number and condition of prisons, and the availability of community-based services and health care.
Notably, members of the U.S. Senate are also responsible for considering and confirming many appointments made by the president — including the appointment of federal judges and the U.S. Attorney General. This allows them to affirm or deny whether a person has the experience, temperament, and priorities to serve in that position.
Making your voice heard
No single elected official built America’s broken system of mass incarceration. And no one officeholder can end it singlehandedly. Accomplishing that will require a wide focus on elected offices up and down the ballot.
This guide is not all-encompassing. America’s elections are diverse and complex, so it would be impossible to cover every office that influences the criminal legal system and every responsibility of those offices. Instead, as you prepare to head to the polls, we hope this guide helps you better understand how the offices you’ll be asked to vote for can use their power to reduce the number of people behind bars and improve conditions for those who remain incarcerated. After the election, we hope you’ll use it to hold those elected officials accountable, too.
With Election Day approaching, visit Vote.org to register to vote (or check your registration status) and make your plan to make your voice heard at the ballot box.
(Author’s note: We’d like to thank the team at Bolts Magazine for their insights as we put together their guide. Bolts is a nonprofit newsroom that covers issues related to elections and the criminal legal system.)
Footnotes
Some people who are sentenced to less than one year of incarceration are also held in jails, putting them under the purview of sheriffs. ↩
Some of the positions are called dramatically different things in different states. For example, in Texas they are call “county judges” and serve on the Commissioners Court — not to be confused with the judges we discuss below. And in Louisiana, the county commission is often known as the “police jury.” ↩
In the six states with “unified” systems — Alaska, Connecticut, Delaware, Hawaii, Rhode Island, and Vermont — the agency is also responsible for overseeing both the pretrial and sentenced populations. ↩
Money is power in the United States, and mass incarceration plays a major role in determining who can wield power and who can’t. As we’ve noted repeatedly over the years, it is no coincidence that the poorest and most vulnerable communities are also the most policed. The criminal legal system erects significant barriers to employment and the ballot box, economically and politically weakening entire communities. Importantly, this arrangement impacts all workers: employers use this massive class of disadvantaged people to threaten all workers with replacement and increasingly risky unemployment if they dare to demand better wages and conditions. Mass incarceration also weaves a narrative that pits people with similar economic interests against one another, reducing systemic inequality to matters of individual choice. Fortunately, understanding mass incarceration as the wealthy’s preferred economic policy clarifies that ending it is necessary for all movements for justice and equality — all working people benefit from solidarity with criminalized people.
In this briefing, we compile ten examples of how mass incarceration blocks progress toward economic justice. We argue that our massive system of criminalization is not an isolated issue, nor is it someone else’s problem; it is an engine of inequality that traps people in poverty, weakens worker power, and undermines political organizing toward a more prosperous future for the vast majority of people.
Mass incarceration traps low-income communities in poverty
First, it’s important to understand how incarceration makes and maintains poverty. Criminalizing the poorest people, saddling them with debt, and destroying their financial futures has grave consequences for their families and wider communities. Additionally, prisons are economically depressing for the poor rural towns that host them, leaving them in financial ruin for years to come. It turns out that struggling urban and rural communities have a shared interest in ending our country’s reliance on prisons to address poverty and unemployment.
#1: Incarceration sentences poor people to deeper poverty
As the saying goes, it’s expensive to be poor, and in the U.S. the criminal legal system makes this emphatically so. At every stage of the criminal legal process — from pretrial detention, to incarceration, to reentry — already-poor people are faced with ever-harsher conditions of poverty.
Poverty traps people in jail. About 83% of people in local jails are legally innocent and awaiting trial, and many of them are too poor to make bail.1 At the same time, jail traps people in poverty: it prevents people from working and immediately increases the chances they’ll be fired, leading to long-term job instability and lost government benefits. People in jail must also pay high prices for phone calls, medical fees or “copays,” and essential goods purchased in the commissary.2 Even those who are released pretrial can still take a big financial hit when they’re forced to make nonrefundable payments to bail bond companies and pay expensive user fees for pretrial electronic monitoring.
In prison, periods of employment3 are replaced with low-wage prison labor4 — wages that are quickly consumed by expensive communications, medical care, and commissary goods, not to mention fines for alleged misconduct in many states. Release and reentry provide little reprieve, as people on post-release supervision (who are disproportionately poor5 to begin with) are forced to pay monthly fees for things like regular urinalysis tests, electronic monitoring devices, mandatory programs, and more for years on end.6
How mass incarceration further impoverishes the poorest people at every stage of the criminal legal process
Pretrial
Prison
Post-release
Other fines & fees
Bail bond premiums (which only poor defendants have to pay)
Foregone wages from jobs one would have held
Fewer job prospects due to:
Gaps in work history and forcibly eroded job skills
Supervision requirements such as curfews, travel restrictions, supervision meetings, felon association laws
Legal barriers to certain occupations
Stigma of a criminal record
Fines for convictions that don’t involve incarceration
Bail fees
Low or no prison labor wages
Less eligibility for public programs (welfare, housing, education, and more)
Fees for diversion programs
Fees for pretrial supervision, electronic monitoring
High cost of commissary items and in-prison services like phone calls
Less banking eligibility
The many “shadow costs”, such as transportation or childcare expenses, that attach to mandated programming throughout the criminal legal process
Public defender fees
Court and prison fines and fees (restitution, pay-to-stay)
Parole or probation fees, including fees for required classes, urinalysis, electronic monitoring, and more
Jail interrupts employment
Medical fees (i.e., “copays”)
Jail increases likelihood of conviction and prison sentence, which is impoverishing
Jail “user fees” for video calls and other services
#2: Incarceration impoverishes the families and communities of incarcerated people
Families of incarcerated people lose household income and assume astronomical new expenses related to supporting a loved one on the inside. It bears repeating that these families are often already struggling with poverty,7 and prison makes their survival significantly harder. According to a survey by the Ella Baker Center, roughly 65% of families with a loved one in prison were unable to meet their basic needs because court-related fines and fees sent them into debt over $13,000 on average. In particular, 58% of families living in poverty were unable to afford the costs associated with a conviction. Meanwhile, an estimated 1 in 3 families went into debt because of communication and visitation costs alone. Women were most often responsible for covering these costs: another survey conducted by the Essie Justice Group found that 35% of women experienced homelessness, eviction, or struggled to make rent or mortgage payments as a result of bail, court fees, and lost economic opportunities. Incarceration cost one-third of women their household’s primary source of income, and 43% were forced to work more hours, get a different job, or turn down an educational opportunity as a result.
These harms spill over into the larger community. Lost wages and barriers to employment among the formerly incarcerated reduce their purchasing power, which in turn deflates demand for local goods and services. As a result, local businesses can’t afford to hire as many people, exacerbating unemployment for those returning there from prison and the broader community. The high concentration of policing and incarceration in poor communities creates a feedback loop of economic consequences, creating and worsening poverty at the very same time.
#3: Prisons don’t fix rural poverty — they deepen it
Towns suffering from unemployment and deindustrialization, especially rural communities, are often sold the idea that prisons can help turn things around.8 But this story could not be further from the truth: prisons actually deepen poverty in the communities where they are built — and, they deepen poverty the most in the towns that are the most impoverished to begin with. Rather than create local jobs, most openings are filled by senior corrections workers9 from other areas. In fact, local workers are often rejected from these jobs because of symptoms of local poverty: bad credit histories, low levels of education, criminal records, drug use, age, and even a lack of prior experience puts locals at a disadvantage compared to those from other areas. There are decades of examples of this dynamic at work:
After California’s state prison in Corcoran was built in 1988, fewer than 10% of the jobs went to local residents.10
Residents of Malone, New York were promised 750 jobs when a state prison opened there in 1999, but those jobs went mostly to people from outside of the town because of prison system seniority rules.11
Ruth Wilson Gilmore’s 2007 study of California’s prison boom reported that under 20% of jobs from new state prisons went to local residents on average.
Additionally, using prisons to chase community investment is often a race to the bottom. In fact, new prisons can discourage investment in several important ways:
Many businesses avoid new prison towns because they tend to lack local amenities and fear the incoming criminalized population.
Communities spend tons of money to convince, for example, the federal government to site a prison in their locality. They offer steep discounts on land and resources with the hope of making the money back in the future. Instead, rents and land values eventually plummet when the promised economic boom never arrives, devastating home values.13
Prisons attract large chain stores that strategically site themselves nearby, driving out the smaller local businesses that provide similar goods and services. While the profits for smaller local businesses reliably circulate within the community, the profits for chain stores are largely distributed throughout their operations elsewhere.14
Prisons are a blight on the environment. Their construction destroys local habitats, they’re often built on dangerously polluted land, and, once built, they generate significant waste that is expensive to remediate.15
Mass incarceration weakens all workers
One of the ways that mass incarceration traps people in poverty is by raising the stakes of unemployment for all workers, creating immense obstacles to organizing for better terms of employment. Rather than alleviate poverty through jobs, housing, education, and healthcare, the U.S. uses criminalization to force people to comply with a deeply unequal economy.
#4: Mass incarceration raises the stakes of unemployment for all workers
Mass incarceration emerged as the U.S. economy grew more unequal and work became more precarious: In 1973, the wealthiest 10% of Americans captured one-third of all income, but nearly 40 years later they had captured one-half of it. In that time, the ultra-rich top 1% went from holding 9% of all income to nearly a quarter of it. Meanwhile, at least 17% of workers toiled under unstable work schedules in 2015.16 The growth of the criminal legal system, combined with rising inequality and the demise of the social safety net, has made unemployment riskier and weakened workers’ bargaining position. If losing your job means you’ll receive meaningful financial support before your next job, you’ll be more likely to risk retaliation from an angry employer to demand higher wages and better conditions. If losing your job may lead to an indefinite period of austerity, stress, and surveillance that could end in arrest and incarceration, you’ll be less likely to risk making such demands. In a recent study of labor markets in high-incarceration communities, Adam Reich and Seth J. Prins find that the more incarceration there is in a community, the less likely people are to risk their jobs demanding better terms of work, regardless of prior experiences with incarceration. In other words, in neighborhoods where incarceration is more common, workers — formerly incarcerated or not — are more inclined to play it safe at work than risk unemployment and incarceration.
The U.S. incarceration rate has closely tracked the rise in the share of national income held by the wealthiest 1% of Americans. For most of the 1950s, 60s, and 70s, the top 1% held about 10% of the total national income while the U.S. imprisoned about 100 people per 100,000. By the 2000s, the share held by the top 1% had doubled to around 20% while the incarceration rate grew to five times the historical norm.
#5: Suppressing the wages of formerly incarcerated people harms all low-wage workers
As mass incarceration restricts job opportunities for formerly incarcerated people, it creates a feedback loop that suppresses wages for everyone. Here’s how it works: limited job options threaten formerly incarcerated workers with deeper poverty, criminalization, and re-incarceration, and makes them especially dependent on those few employers who are willing to hire them. As a result, they are compelled to accept nearly whatever wages or conditions are offered to them. Employers can then use this group of precarious workers to threaten others with replacement if they dare to demand higher wages and better conditions. Among the more than 50,000 people released from federal prisons in 2010, a staggering 33% found no employment at all over four years post-release and no more than 40% were employed at any given time. Successfully landing a job also had limited benefits: formerly incarcerated workers averaged 3.4 jobs between 2010 and 2014 — in other words, they secured jobs that didn’t offer security or upward mobility. These jobs tended to be the lowest-paying positions. An analysis of IRS data by the Brookings Institution found most employed people recently released from prison receive an income well below the poverty line. Everyone suffers when employers can readily threaten to fire a worker and hire from the highly vulnerable formerly incarcerated pool, forcing everyone to accept less money and worse treatment.
Incarceration erodes a worker’s ability to quit — an important measure of worker power. Additionally, formerly incarcerated workers have lost their say in which jobs they accept: while “before prison” workers can exhibit a preference for more satisfying jobs, “after prison” workers have to accept high- and low-satisfaction jobs at similar rates.
#6: Mass incarceration makes it harder for all workers to unionize
Higher unionization rates lead to higher wages throughout the economy because, in places where businesses have unionized, other employers must pay more to compete for local workers. Unions are also an equalizing force, reducing racial and gender economic disparity and increasing political participation. Mass incarceration undermines these benefits by preventing workers from leveraging their collective power through unions or other worker associations that can more safely and effectively make demands of employers. Reich and Prins’s 2020 study offers the first large-scale documentation of this effect: they found individuals with a history of incarceration were 85% less likely to join the OUR Walmart workers association. They also discovered people who had experienced any contact with the criminal legal system (including felony convictions, probation or parole, or incarceration) were 76% less likely to join the organization. According to their analysis, as prison admissions rose, the odds of signing an OUR Walmart membership card fell.. Union approval elections were also less likely to succeed in communities with higher incarceration rates regardless of whether the workers involved in that particular election had been previously incarcerated. The chilling effect of mass incarceration on labor organizing pervades throughout the entire low-wage labor market, affecting all workers. Beyond the increased risk associated with losing one’s job, there are likely other reasons for this dynamic, such as incarceration’s suppressing effect on the community networks and institutions where labor organizing often takes place.
Mass incarceration weakens political movements for economic justice
Finally, mass incarceration’s coercive power, rooted in its ability to exclude and impoverish, seriously undermines political movements for the rights of the most marginalized, who have the most at stake in economic reform. By reframing systemic inequalities as individual failures and criminality, the narratives built around prisons stoke the flames of racism and pit people with similar economic interests against one another. In this environment, our weakened political movements cannot win or maintain the social programs that would help nearly all of us, and that the vast majority of people want.
#7: Mass incarceration is anti-democratic, suppressing political engagement and representation
Disenfranchisement laws prevent people who have the most intimate understanding of poverty in the U.S. — and the most at stake in economic reform — from participating in elections. According to the Sentencing Project, as of 2020, an estimated 5.17 million people — 1 out of every 44 adults in the entire eligible voting population — lost their right to vote due to a felony conviction. Prison gerrymandering also disempowers the communities from which people are incarcerated: by counting incarcerated people where they’re imprisoned instead of where they’re from, the Census Bureau dramatically distorts political representation at the state and local level, and paints an inaccurate picture of community populations for research and planning purposes.
Incarcerated people and their communities are also shunned from the political process in ways beyond legal disenfranchisement. The many stresses of returning from prison lead many individuals — and entire high-incarceration communities — to significantly retreat from formal politics and from the more informal processes of shaping the institutions that structure their lives. According to a 2010 study by scholars Vesla Weaver and Amy Lerman, contact with the criminal legal system is strongly and consistently associated with declining trust in government and a reduction in one’s likelihood of voting, even when the sample is restricted to those who have not been legally disenfranchised. Otherresearch confirms this effect encourages not just individual disengagement from politics but the withdrawal of entire communities from politics and more informal forms of neighborhood involvement.
#8: Mass incarceration weakens labor unions, removing a key player in broader movements for economic justice
Organized labor has traditionally been a key player in movements for just economic policies. Beyond providing a gateway for members to build confidence in the possibility of organizing around shared interests to change policy, unions have often provided the actual institutional structure that organizes the public for economic justice. According to a 2021 study from the Economic Policy Institute, the 17 states with the highest union densities have, on average:
State minimum wages that are 19% higher than the national average — 40% higher than low-union-density states,
Median annual incomes $6,000 higher than the national average,
A higher share of unemployed workers receiving unemployment insurance,
An uninsured population 4.5 percentage points lower than that of low-union-density states,
A higher likelihood of passing paid sick leave laws and paid family and medical leave laws than states with lower union densities, and
Significantly fewer restrictive voting laws.
Police and corrections officers provide stark examples of how powerful organized workers can be, though these unions’ relationship with the criminal legal system tends to lead to positions that do not serve the interest of all workers. In some states, law enforcement organizations play a very significant role in electoral politics, often as main contributors to major campaigns. The California Correctional Peace Officers Association, for example, has contributed more than $9.3 million to political campaigns in the last 20 years — $3.8 million of which was spent across 32 state legislative races since the year 2000 alone. Over the past year, the California guards union negotiated a $1 billion raise over three years and got a new, additional state-funded retirement perk. In addition to pushing legislation directly responsible for expanding California’s prison system, the organization bankrolled particular victims rights groups that have helped stoke fears of criminalized people. Imagine if those sectors of the workforce that articulate more progressive policies for economic justice were as organized and politically active as the California prison workers union. By making it harder for most workers to unionize — while also empowering those segments of labor with a vested interest in the criminal legal system — mass incarceration removes a key player from political movements for economic justice.17
#9: Mass incarceration inflames social tensions that undermine worker solidarity
Throughout U.S. history, racism has prevented the development of a fully united movement for workers rights. Mass incarceration has continued this tradition by reinforcing divisions that obscure a shared interest in policy reforms. Prisons are home to racially disproportionate outcomes and a heated debate about their causes18 that plays out in media, exacerbating racism in society. Labor market research that finds that employers more frequently assume criminality in Black job applicants, whether they have a criminal record or not, exemplifies how mass incarceration influences society’s ideas and relationships around race in the workplace. Relatedly, the monumental scale of punishment in the U.S. leads to a hardening of ideas about workers who are “law-abiding” and those who are not, creating deep cultural rifts that leave less room for organizing around common grievances. While many workers and incarcerated people often share very similar needs for economic reform — like more affordable housing, education, or healthcare — the strength of their divisions along the lines of “criminality” tend to overpower the possibility of solidarity around shared needs.
#10: Mass incarceration hides economic injustice, making it harder to organize against
While mass incarceration creates some very visible economic injustices, others remain hidden, and when the public can’t readily see injustice or accurately pinpoint its source, it is harder to organize people against it. For example, mass incarceration artificially lowers official unemployment rates as incarcerated people go uncounted. Bruce Western and Katherine Beckett show that, in the 1990s, mass incarceration lowered the unemployment rate for Black men by 7 full percentage points. The ’90s are generally celebrated as a booming time for the U.S. economy with increasing employment opportunities for people of color. However, if incarcerated people were included in these statistics, the jobless rate for Black men would have stayed at an appalling 40% between the official unemployment peak in the early 1980s and the “inclusive” mid-1990s. Furthermore, if these figures and economic policy targets were recalculated to include the prison population, it would be even clearer just how little our society spends on social programs to address dire economic problems.
Beyond statistical misrepresentation, mass incarceration also gives rise to narratives that displace blame for criminalized poverty entirely onto the individual. Despite the vastamount of research on the role of economic conditions in causing crime, criminal legal proceedings present many symptoms of poverty, unemployment, and homelessness not as economic problems to be alleviated through systemic policy changes, but as personal failings that must be forcefully punished. This “individualization” of structural problems is also very clear in reentry. One can only counsel so many exceptionally persistent formerly incarcerated job applicants — who are indeed more “active” in the labor market than their general population peers19 — on how to beat out other workers before it becomes clear that the lack of economic opportunities that would allow them (and all workers) to meaningfully support themselves is really to blame. Bruce Western’s Homeward and Jamie Peck and Nik Theodore’s “Carceral Chicago” are full of painful stories of individuals stuck in these situations, making heroic individual efforts amid a scarcity of opportunities. In this situation, a certain percentage of people are guaranteed to end up unemployed, and demanding fiercer competition among them will not change this fact. It will, however, continue the pattern of filling prisons by blaming individuals for structural economic problems.
Conclusion
As these ten points show, mass incarceration is a major obstacle to movements for economic justice. The vast majority of people in the United States have a stake in dismantling this engine of inequality, which not only impoverishes people but traps the poorest communities in poverty. Through a combination of financial sanctions and legal disenfranchisement, criminalized people, their families, their communities, and eventually all low-wage workers become economically and politically disadvantaged. Mass incarceration presents a looming threat that deters all workers from risking unemployment by demanding better wages and working conditions, undermining both individual bargaining power and union organizing. Broader movements for economic justice suffer from the loss of unions as important incubators for political organizing, and people become discouraged from engaging in political participation altogether. Rather than address structural conditions by investing in what most people need — which the nation has the resources to do — the United States has chosen to blame and punish the individuals who are most harmed by them. As a result, mass incarceration stokes racism and pits people with similar economic interests against one another. In the end, these facts make clear that movements to end inequality and mass criminalization are in fact one and the same, and solidarity between all workers — criminalized or not — is necessary to progress toward a more economically just future.
Footnotes
In fact, people in jail are even poorer than people in prison and are drastically poorer than their non-incarcerated counterparts: For people who are unable to post a bail bond, the median annual income prior to incarceration in the United States is $19,971.35 for 2024. This is an adjusted figure from our report, Detaining the Poor, using the Bureau of Labor Statistics’ CPI Inflation Calculator. That report found that people in jail had a median annual income of $15,109 in 2015 dollars prior to their incarceration — less than half (48%) of the median for non-incarcerated people of similar ages. ↩
These mounting costs factor into the many reasons why people in jail are far more likely to plead guilty, regardless of actual guilt or innocence, in hopes to end their contact with the system as soon as possible. ↩
According to a 2016 survey of incarcerated people, in the month before arrest, 61% of people had held a job, and another 15% were actively looking for work. In other words, 76% of people were active labor force participants, and very likely to have been wage-earners to some significant degree during the period in which they were instead incarcerated. ↩
People who have been on post-release supervision in the past year report living in poverty at more than twice the rate (33%) of those who were not on post-release supervision (15%), according to our analysis of the National Survey of Drug Use and Health (2021-22 restricted-use data). Moreover, while 65% of people who were not on post-release supervision reported incomes above twice the national poverty threshold, only 34% of people on post-release supervision reported an income that high. ↩
These fees do nothing to further the missions of probation services departments but they do serve as a violation waiting to happen. ↩
Adults making less than $25,000 a year are over 60% more likely to have had a family member incarcerated than those making over $100,000 a year. They’re also three times more likely to have had a family member incarcerated for a year or more. ↩
While only 36% of prisons were in rural areas before 1980, now the majority of people in state and federal prisons are held in rural areas. Between 1990 and 1999, 245 prisons opened in rural areas and small towns; on average, a prison opened somewhere in rural America every fifteen days. About 350 rural counties had a prison open since the beginning of the prison boom in 1980, and over half of all rural counties in the U.S. added prison work to their available employment in the last two decades of the 20th century. Much of this prison expansion was concentrated in four of the most depressed rural areas in the nation: the west Texas plains, where farm work and oil field jobs were in decline, the Mississippi Delta, south central Georgia, and the Appalachian coal fields. For more, see: Beale, C. (2001). “Cellular Rural Development: New Prisons in Rural and Small Town Areas in the 1990s,” paper prepared for presentation at the annual meeting of the Rural Sociological Society, Albuquerque, New Mexico, August 18. ↩
Parks, Loren L., Jill M. Weigt, Everard M. Lofting, and Oliver B. Linton. 1990. The Economic Impacts of State Prisons in Kings County, California. Sacramento: California Department of Corrections. ↩
News reports at the time quoted the village’s director of the Office of Community Development as saying, “Did we get seven hundred fifty jobs? We didn’t get a hundred.” ↩
This 10% figure is an estimate provided by a local judge-executive, who approximated that around 30 of the 300 prison employees were local hires. While only 10% of jobs ultimately went to locals, 40% of the new jobs were already officially out of reach, as they were formally protected for BOP transfers from other prisons. Though the projects are advertised as job-creation ones, the agencies involved already know ahead of time that the impact will be quite limited, given their own official policy, combined with the overwhelming evidence that the remaining jobs tend to be inaccessible for locals as well. ↩
In particular, prisons exacerbate rural poverty in the poorest communities, according to a landmark 2010 study of all rural counties in the U.S. This is largely due to higher levels of employment disqualification and economic sacrifice in the bidding process, which can involve assuming debt that becomes especially crushing when the expected economic boom never arrives. ↩
In Tehachapi, California, with its two state prisons, box-store chains came to dominate local markets while 741 locally-owned businesses failed in the last decade of the 1990s. ↩
For this reason, activists have used environmental law to resist prison construction. The movements for economic justice, environmental justice, and against mass incarceration all have common cause. ↩
According to researchers, at least 10% of the workforce has an irregular or often unpredictable work schedule, while another 7% work split or rotating shifts. ↩
Furthermore, research suggests that countries with weaker labor unions have harsher criminal justice policy. In alignment with a premise of this briefing — that governments have a choice between criminal justice policy or economic policy to respond to economic problems — greater union presence can mean stronger demands on governments to respond with economic policy, while a smaller union presence can mean that the movement for economic justice may not have enough political power to win these policies. Some attempts to explain the U.S.’s exceptional level of incarceration focus on the unique weakness of labor unions in the U.S. (For more, see: The Economic Origins of Mass Incarceration by John Clegg & Adaner Usmani.) ↩
Criminologists estimate that about 25% of racial disparities in incarceration is due to racially different treatment by actors within the criminal justice system, like police, prosecutors, and judges. The other approximately 75% is due to disparities in crime commission that are themselves attributable to underlying histories of racial disparities in poverty and joblessness. ↩
Since the 2022 Dobbs decision, 21 states have restricted abortions earlier than the Roe v. Wade standard. Now, more of the 800,000 women on probation and parole must seek abortion care out-of-state — but for many, whether they can get there depends on an officer’s decision.
June 24 marks two years since the Supreme Court stripped Americans of their constitutional right to abortion. The court’s 2022 decision in Dobbs v. Jackson Women’s Health Organization permitted state governments to limit and even ban abortion care — and they did. As a result, the share of patients who cross state lines for abortion care has almost doubled, from about 1 in 10 to almost 1 in 5. Traveling out-of-state for health care, including abortions, is a hardship for anyone, but it is especially challenging for people on probation or parole.
According to The New York Times, since the Dobbs decision, 21 states have implemented abortion rules more restrictive than the standard under Roe v. Wade.1 Fourteen states now ban abortion altogether, and most other states ban abortion after a certain point in pregnancy. And while some of these less-restrictive bans preserve abortion as an option for most people who need one, these bans are nonetheless as obstructive for people who need abortion care after their state’s time limit.2 In all, 41 states have some kind of abortion ban in place post-Dobbs, whether “total bans” or bans based on gestational duration.3 In every one of these states, standard conditions4 of probation and/or parole require permission to travel out of state, county, or another specified area.5
Map 1 The vast majority of states have some kind of abortion ban as well as standard conditions of both probation and parole that restrict interstate travel. Click here to see a map of abortion bans in place as of May 2024.
Map 2 Probation is the most common form of correctional control for women in the U.S., and almost every state has a standard condition of probation restricting travel. Probation populations here exclude federal. Click here to see a map of abortion bans in place as of May 2024.
Map 3 While fewer women are on parole supervision compared to probation, nearly all live in states that restrict interstate travel for everyone on parole. Parole populations here excluded federal. Click here to see a map of abortion bans in place as of May 2024.
To understand how this post-Dobbs landscape impacts women under the U.S.’ massive system of community supervision, we examined standard supervision conditions in each state, along with the number of women who must comply with them. We find that the one-two punch of abortion and supervision restrictions impacts an estimated 4 out of 5 women6(82%) on probation or parole nationwide.7 That means that for the vast majority of people under community supervision, the ability to seek abortion care out-of-state is left not to the pregnant person, but to the discretion of a correctional authority, typically their probation or parole officer.
Specifically, we find that, excluding federal probation and post-release supervision,8 82% of women on probation and 85% of women on parole live in states that (1) either completely ban abortion or restrict it based on gestational age and (2) list travel restrictions as a standard condition of supervision.
Every state and D.C. restrict the movement of people on probation or parole
For our analysis, we first looked at rules related to travel in the standard conditions of probation and parole in each state and D.C. (These are summarized in the table below.) We find that probation agencies in all but two states (Ala. and Iowa) generally require permission to leave the state, county, or other designated area. Four of these states empower the court or probation officer to set the boundaries for travel restrictions on an individual basis.9 Rules restricting interstate travel are just as common in the context of parole and post-release supervision: 40 states have a standard condition requiring permission to leave the state. Among the states that do not, five (Ark., Iowa, Mont., N.M., and Pa.) require permission to leave an even smaller area — the county or district.10 West Virginia and D.C. require permission to travel, but individualize the specific geographic boundaries in the supervision contract.
Excluding federal supervised populations, the vast majority of women on probation (98% or 672,000) and parole (96% or 60,000) live in states where their standard supervision conditions require permission to leave the state, if not an even smaller geographic area. Every single state and D.C. require permission to travel for either their probation or parole population — and almost all require permission for both.
It’s important to note that “standard conditions” are just part of the picture of probation and parole conditions, because courts can — and very frequently do — impose any number of additional “special conditions.”11 So even if travel restrictions are not included in the standard conditions that apply to everyone on probation or parole, they may still be imposed at the discretion of the court or community supervision agency.
Limited abortion care options are made worse by these standard conditions
We next looked at each state’s abortion bans and restrictions alongside their standard conditions of probation and parole. This analysis gets to how quickly state laws foreclose the possibility of in-state abortion care for women under either form of community supervision, forcing them to request permission to seek care in another state instead.12 We find that the much tighter restrictions imposed by states since the Dobbs decision put over 400,000 more women in this precarious positionthan there were under the protections of Roe v. Wade. Alarmingly, we find that only 1 in 6 women on probation or parole can access abortion care at any stage of their pregnancy without needing permission to cross state lines.
Over half (53%) of women on probation and parole live in the 21 states that the Times identified as banning abortion care at an earlier point than the standard set by Roe v. Wade (i.e., the highly variable point of “fetal viability”). Less than 3% of these women are able to travel across state lines without permission.
Nearly one-third (31%) of all women on probation and parole live in states that now have a total abortion ban. Of these, just 4% have no standard condition restricting travel.
Another 17% of women on community supervision live in states that ban abortions at six weeks — a point at which more than 1 in 4 women are not yet aware of their pregnancy.
Only 16% live in places without abortion bans and can access abortion care at any gestational point without crossing state lines.
Importantly, even when parole or probation authorities approve interstate travel, the process of getting a “travel permit” takes time and logistical coordination — and sometimes even fees.1314 This necessarily delays abortion care, increasing the risk of complications and often further limiting access.15 For example, a woman on probation in South Carolina who only becomes aware of her pregnancy when she’s eight weeks along will have to travel out-of-state for an abortion. But if it takes two weeks for her to get permission to travel, a non-surgical abortion is likely no longer an option, as the necessary medications are only approved for use until 10 weeks’ gestation.
For hundreds of thousands of women, access to abortion care is limited by their state’s abortion laws and community supervision travel restrictions
In reality, even in places that don’t list travel restrictions as standard conditions for people on probation and parole, courts and supervision officers may choose to impose them as “special conditions” anyway.
State
Estimated women on probation, 2022
Estimated women on parole or post-release supervision, 2022
Estimated total women on probation and/or parole, 2022
Probation: Need permission to leave state or even smaller area
Parole: Need permission to leave state or even smaller area
Abortion ban laws (as of May 15, 2024)
Ala.
9,820
810
10,630
No
Yes
Total ban
Alaska
500
83
583
Yes
Yes
No ban or gestational limit
Ariz.
14,780
900
15,680
Yes
No
Ban at 15 weeks’ gestation
Ark.
13,280
4,120
17,400
Yes
Yes
Total ban
Calif.
36,113
2,900
39,013
Yes
Yes
Ban at viability
Colo.
19,052
1,190
20,242
Yes
Yes
No ban or gestational limit
Conn.
6,400
130
6,530
Yes
Yes
Ban at viability
Del.
2,260
20
2,280
Yes
Yes
Ban at viability
D.C.
570
60
630
Yes
Yes
No ban or gestational limit
Fla.
42,798
210
43,008
Yes
Yes
Ban at 6 weeks’ gestation
Ga.
80,346
1,860
82,206
Yes
Yes
Ban at 6 weeks’ gestation
Hawaii
3,285
200
3,485
Yes
Yes
Ban at viability
Idaho
7,612
1,020
8,632
Yes
Yes
Total ban
Ill.
18,777
1,450
20,227
Yes
No
Ban at viability
Ind.
24,163
530
24,693
Yes
Yes
Total ban
Iowa
6,870
850
7,720
No
Yes
Ban at 22 weeks’ gestation
Kan.
3,834
550
4,384
Yes
Yes
Ban at 22 weeks’ gestation
Ky.
16,880
2,220
19,100
Yes
Yes
Total ban
La.
6,660
1,670
8,330
Yes
Yes
Total ban
Maine
960
No parole program
960
Yes
No parole program
Ban at viability
Md.
10,014
500
10,514
Yes
Yes
No ban or gestational limit
Mass.
8,079
90
8,169
Yes
Yes
Ban at 24 weeks’ gestation
Mich.
28,108
730
28,838
Yes
Yes
No ban or gestational limit
Minn.
21,270
510
21,780
Yes
Yes
No ban or gestational limit
Miss.
6,680
1,190
7,870
Yes
Yes
Total ban
Mo.
10,867
2,910
13,777
Yes
Yes
Total ban
Mont.
2,435
160
2,595
Yes
Yes
Ban at viability
Neb.
3,160
100
3,260
Yes
Yes
Ban at 12 weeks’ gestation
Nev.
2,798
591
3,389
Yes
Yes
Ban at 24 weeks’ gestation
N.H.
907
182
1,089
Yes
Yes
Ban at 22 weeks’ gestation
N.J.
25,904
530
26,434
Yes
Yes
No ban or gestational limit
N.M.
2,375
290
2,665
Yes
Yes
No ban or gestational limit
N.Y.
13,020
1,260
14,280
Yes
Yes
Ban at 24 weeks’ gestation
N.C.
15,990
1,050
17,040
Yes
Yes
Ban at 12 weeks’ gestation
N.D.
1,630
170
1,800
Yes
Yes
Total ban
Ohio
49,619
1,520
51,139
Yes
Yes
Ban at 22 weeks’ gestation
Okla.
4,944
480
5,424
Yes
Yes
Total ban
Ore.
5,940
2,830
8,770
Yes
Yes
No ban or gestational limit
Pa.
21,752
7,725
29,476
Yes
Yes
Ban at 24 weeks’ gestation
R.I.
2,355
20
2,375
Yes
Yes
Ban at viability
S.C.
5,910
260
6,170
Yes
Yes
Ban at 6 weeks’ gestation
S.D.
1,382
810
2,192
Yes
Yes
Total ban
Tenn.
14,947
1,550
16,497
Yes
Yes
Total ban
Texas
91,135
11,452
102,587
Yes
Yes
Total ban
Utah
2,460
460
2,920
Yes
Yes
Ban at 18 weeks’ gestation
Vt.
600
100
700
Yes
Yes
No ban or gestational limit
Va.
14,157
40
14,197
Yes
Yes
Ban at third trimester
Wash.
16,328
880
17,208
Yes
Yes
Ban at viability
W. Va.
1,660
730
2,390
Yes
Yes
Total ban
Wis.
10,010
2,270
12,280
Yes
Yes
Ban at 22 weeks’ gestation
Wyo.
1,410
160
1,570
Yes
No
Ban at viability
U.S. total (excluding federal)
712,806
62,321
775,127
A travel restriction is just one of many barriers to healthcare for people on probation and parole
Interstate travel restrictions are just one of the barriers women — or for that matter, everyone on probation and parole — face when it comes to accessing health care. As we’ve already touched upon, some standard conditions restrict travel across much smaller areas, such as counties or court districts. Similarly, people on electronic monitoring — an increasingly common condition of community supervision that amounts to a form of “e-carceration” — are regularly blocked from leaving their home, workplace, or other approved locations. As we have explained before, people on electronic monitoring oftenreport being denied permission to see a doctor or go to the pharmacy to have prescriptions filled.
Even in the few places that don’t impose restrictions on movement, financial costs often put healthcare out of reach for people on probation and parole. As we’ve found in previous research, people on community supervision tend to have lower incomes, with about 60% reporting annual incomes below $20,000. About 25% don’t have health insurance to cover the cost of even basic care — despite reporting worse overall health and greater levels of need.16 Probation and parole conditions often come with additional expenses as well, such as monthly fees and the costs of drug testing or electronic monitoring devices, which leave even less money for healthcare.
Finally, for women on probation and parole who need abortion care, there is a special risk of further criminalization, either for violating the conditions of their supervision or for the abortion itself. A recent law review article details the various laws used historically and currently to criminalize abortion seekers and providers, paying special attention to laws targeting people who choose “self-managed abortions” when they are unable to access care from the formal healthcare system. A report by researchers at If/When/How describes 61 cases, across 26 states, in which people were investigated or arrested for allegedly ending their own pregnancy or helping someone else end theirs. All were from 2000-2020 — in other words, pre-Dobbs. Efforts to criminalize abortion have only gained momentum since.
Conclusions
Ultimately, Dobbs not only made abortion care much less accessible for everyone who may become pregnant; it created new risks of criminalization as well. For people under supervision, those risks are intensified by the travel restrictions found in standard conditions across the country. As the Community Justice Exchange and Repro Legal Defense Fund explain in their organizing guide, “In states where clinical abortion is banned or inaccessible … [self-managed abortion] will likely be the abortion option most accessible to people under carceral surveillance, putting them at a risk for criminalization that people who can travel freely do not face.”
For this reason (among others), state legislators, courts, and community supervision agencies should minimize the number and restrictiveness of standard conditions imposed on everyone on probation and parole — and greatly reduce the use of these massive supervision programs in general. Courts should limit who they place on supervision, individualize supervision conditions, and apply those conditions only for as long as necessary to achieve results. This approach is far more likely to set people up for success than relying on restrictive, one-size-fits-all rules that only act as tripwires to further criminalization and punishment.
Certainly, whether it’s appropriate to restrict someone’s movement is among the most situation-dependent decisions supervision authorities can make, whether for work, family, religious, educational, or — as we’ve discussed here — health reasons. Restricting where people can go inevitably blocks many from accessing the resources they need, which in turn creates health and safety risks for both individuals and communities. These very real and life-threatening consequences must be taken into account and not discounted simply because of a criminal legal status.
Author’s note: Amelia Wittig and Emily Widra provided the foundational research for our analysis of standard probation conditions by collecting and categorizing the relevant forms, web pages, and statutes that stated whether travel restrictions apply to everyone on probation. These sources are on file with the author. As part of a forthcoming report on probation conditions more broadly, we plan to upload the publicly-accessible documents and those we were given permission to share, and to provide a summary table with links in our Data Toolbox.
Our data sources, methodology, and important caveats
For this analysis, we looked at (1) the number of women on probation and parole in each state and in D.C., (2) the standard conditions of probation and parole in each state and D.C., and (3) the abortion laws in each state and D.C. However, none of these data points were straightforward, so we had to create some population estimates and rely on some assumptions, explained here.
Estimating state probation and parole populations by sex: The Bureau of Justice Statistics (BJS) reports the number of people on probation and on parole (or post-release supervision) by state and sex in its annual Probation and Parole in the United States report. These data form the basis of our estimates for the number of women on probation and parole in each state. Unfortunately, some states do not report these populations by sex or are missing sex data for a portion of the population. In all, almost 27% of the probation population nationwide, and almost 8% of the parole population, are missing sex data. We looked for the missing data in publicly available reports from state probation and parole agencies, but only found it for probation populations in Illinois (23.5% female) and Kansas (25.8% female).
To avoid seriously underestimating the number of women impacted by the laws and policies we examine here, we assigned a sex to the nearly 800,000 people on probation whose sex was not reported. We did so by applying the percentage of all people on probation reported as female among those whose sex was known (24%) to each state’s count of people on probation whose sex was unknown. In other words, we assumed that the ratio of males to females among the population whose sex was reported was the same among the population whose sex was not reported. (For Illinois and Kansas, we applied the percentages that we found from state reports.) Finally, we added each state’s reported number of women on probation to our calculated estimate of women on probation whose sex was not reported to arrive at our final estimate for each state’s female probation population.
We repeated the process to assign a sex to the nearly 54,000 people on parole nationwide whose sex was unknown. For parole, the percentage of people reported as female among those whose sex was known was 11%, so we assumed that 11% of each state’s sex-unknown parole population were female. As a last step, we compared the sums of our final estimates of each state’s female probation and parole populations to those published by the Bureau of Justice Statistics in its Correctional Populations in the United States, 2022 report. Our estimates amounted to almost exactly what BJS reported (less than a 0.1% difference), suggesting that our method is similar to what BJS used to estimate these total populations.
Standard conditions of probation and parole: Standard conditions of parole as of 2020, by state, have been collected, categorized, and discussed in Wiggins, et al.’s Parole Rules in the United States: Conditions of Parole in Historical Perspective, 1956-2020. We relied entirely on their analysis when it came to travel restrictions for parole. It’s worth noting, however, that Maine no longer has a parole program as of 2022, according to the Bureau of Justice Statistics. Previously, parole was available to those sentenced before May 1, 1976 — that is, before the state abolished discretionary parole. Despite having no one on parole at this point, Wiggins, et al. (2021) report that as of 2020, Maine had a standard condition of parole restricting out-of-state travel.
Unfortunately, the same comprehensive approach has not yet been applied to standard conditions of probation — largely because of the added difficulty of collecting these documents (which are not always publicly available) from states that have county-run probation systems for felony and/or misdemeanor probation. While some of those states have statewide standard conditions outlined in statute or elsewhere, some of them may have as many variations of standard conditions as there are counties — or even cases. Not to be deterred, we collected standard conditions for felony probation from everywhere that has a single set of standard conditions for the whole state. For those states where the conditions may vary by county, we looked for a sample of documents, prioritizing the most populous counties and felony probation conditions. For the purposes of our analysis — and this is an important caveat – we assumed that the standard conditions we found were representative of the whole state. This means that we may overestimate the number of women on probation in these states impacted by travel restrictions in the standard conditions we found, but we reasoned that those conditions would at least apply to women in the largest population centers for which we could locate documents. Moreover, we found that travel restrictions were the norm, not the exception, and we believe it is more likely than not that standard conditions in the counties from which we did not collect documents also restrict interstate travel.
The states for which we used county or city probation conditions to represent the state’s typical standard probation conditions, and the specific jurisdictions we used as our sample for these states, are summarized in the table below:
State
Representative county(s) or city(s)
Probation requires permission to leave (county/state/other)
Comments
Calif.
Los Angeles
County
Riverside
State
Ind.
Hamilton
State
Porter
Area of the court’s jurisdiction
Monroe
None
These conditions were revised in 2023 to be minimally burdensome.
Boone
State
Advance notification is required, not permission.
Kan.
Shawnee
County
Wyondotte
Area within100 miles radius of home, or area within 250 miles of Kansas border
Two different standard conditions documents show different travel restrictions, and it is unclear whether these reflect different levels of probation (i.e., felony vs. misdemeanor), changes over time, or something else. The condition referencing 250 miles outside of Kansas requires “notifying” an officer, not obtaining permission.
N.Y.
New York City
Area of the court’s jurisdiction
Suffolk County
Area of the court’s jurisdiction
Ohio
Cuyahoga
County
Montgomery
State
Okla.
Tulsa
State
This appears to be a statewide condition, but we could not confirm that.
Ore.
Multnomah
State
Clackamas
State
Pa.
Philadelphia
County
Allegheny
State
Montgomery
Adjoining counties
Bucks
Adjoining counties
Delaware
State
Tenn.
Shelby
None
Knox
State
Rutherford
County
Texas
Harris
County
Tarrant
County
Travis
County
Kansas, Kentucky, Mississippi, and Vermont have statutes or standard conditions that empower probation officers or the court to determine the boundaries of an individual’s travel restrictions. The language used in these conditions varies: “My designated area of supervision is [blank] and I will not leave this area without my officer’s permission” (Ky.); “the defendant shall… remain within a specified area as directed” (Miss.); and “Your probation officer may restrict or prohibit travel to any state…” (Vt.). In Kansas, a legislative research memo explains that, “Other than a few statutorily required probation conditions… the conditions of probation, in large part, are left to the discretion of the district court…” The referenced statute lists 14 conditions that the court “may” impose, which include most of the common standard conditions found elsewhere, among them, “remain within the state unless the court grants permission to leave.” Because the conditions we found in each of these states suggest even greater discretionary power than the one-size-fits-all standard conditions, we included these among states that require permission for our analysis.
Abortion access laws: For our categorization of abortion bans, we relied on the work of the Guttmacher Institute (as of May 15, 2024), which breaks down which states have “total bans” and those that ban abortion based on gestational age or “viability.” To distinguish between which states have implemented laws restricting abortions “earlier in pregnancy than the standard set by Roe v. Wade” (that is, “viability”), we relied on The New York Times’ categorization (as of May 1, 2024).
The decision in Roe v. Wade protected the right to choose an abortion until the highly variable point of fetal “viability,” which the Court described as “the interim point at which the fetus becomes… potentially able to live outside the mother’s womb, albeit with artificial aid.” That point, the court opinion continues, is “usually placed at about seven months (28 weeks) but may occur earlier, even at 24 weeks.” ↩
A recent article from The New York Times noted “… in the first half of 2023, almost a quarter of women living in states with near-total bans – who may have otherwise sought an abortion – did not get one.” ↩
“Total bans” are laws which only allow abortions in extremely limited circumstances, such as when the pregnancy presents a threat to the life or health of the pregnant person, when it results from rape or incest, or when there is a diagnosed “lethal fetal anomaly.” The specific exceptions to abortion bans vary by state. Bans based on gestational duration – often measured as time since the last menstrual period – range from as early as six weeks to the highly variable point of “fetal viability.” ↩
“Standard conditions” of probation and parole are the default conditions that everyone on supervision must abide by. “Special conditions” are additional rules and restrictions that may be imposed separately or on an individual basis. ↩
One important caveat to this finding is that not all states have statewide standard conditions of probation. In some states, probation (or at least misdemeanor probation) is managed at the county or city level instead of by a central state probation agency. In some of these states, standard conditions vary by jurisdiction, or courts may set different conditions for each supervised person. Because collecting standard conditions from every probation department in these states was not feasible, we attempted to gather those from the most populous counties, and used those as proxies – or representatives – of the whole state. See the Methodology for more details. ↩
The use of “women” reflects the gender binary inherent to the data, which come from administrative sources that report male and female sex as opposed to gender identity. These sources therefore obscure the numbers of intersex, nonbinary, and transgender people on probation and parole who are able to become pregnant but are categorized in the data as “male.” The probation and parole restrictions we detail are not gender-specific, which means they also limit these individuals’ ability to access abortion care in the same ways we discuss in this briefing. ↩
This figure includes only women on probation in the four states where only probation conditions restrict travel (Ariz., Maine, Mass., and Wyo.), only women on parole in the two states where only parole conditions restrict travel (Ala. and Iowa), and both populations in the 34 states where both probation and parole conditions restrict travel. Our analysis excludes federal probation and post-release supervision populations because we don’t have data showing how women under federal supervision are distributed across the states. The data source for all probation and parole populations is the most recent available (from 2022), the Bureau of Justice Statistics report Probation and Parole in the United States, 2022. See the Methodology for details. ↩
We excluded federal probation and post-release supervision because people can live in any state under federal supervision, and we don’t have data showing how women are distributed across the states. ↩
Four states – Kan., Ky., Miss., and Vt. – have statutes or standard conditions that transfer discretionary power to determine the boundaries of an individual’s travel restrictions to probation officers or the court. The language used in these cases varies: “My designated area of supervision is [blank] and I will not leave this area without my officer’s permission” (Ky.); “the defendant shall… remain within a specified area as directed” (Miss.); and “Your probation officer may restrict or prohibit travel to any state…” (Vt.). In Kansas, the statute related to probation conditions lists 14 conditions that the court “may” impose, which include most of the common standard conditions found elsewhere, among them, “remain within the state unless the court grants permission to leave.” This is not listed as a mandatory condition, but the statute is clearly written to give district courts the most control over conditions, and the sample conditions documents we found included travel restrictions. Because the rules in each of these states suggest even greater decision-making power than the one-size-fits-all standard conditions, we include these among states that require permission in our analysis. ↩
As of 2022, Maine no longer has a parole program, according to the Bureau of Justice Statistics (previously, parole was available to those sentenced before May 1, 1976 – that is, before the state abolished discretionary parole.) We did not count Maine among the states with standard conditions restricting travel for this reason, but Wiggins, et al. (2021) report that as of 2020, Maine, too, had a standard condition of parole restricting out-of-state travel. ↩
For a 2015 law review article, probation expert Ronald Corbett requested information from members of the National Association of Probation Executives about the standard and special conditions imposed in their jurisdictions. The sample he received showed a range of seven to twenty-four standard conditions in each jurisdiction, plus three to five special conditions. In the same article, Corbett includes this comment from a 2014 interview with a retired Texas Probation Director: “…we have witnessed the growth in the number of special conditions of probation, and now it is not uncommon for offenders to be saddled with up to a couple of dozen.” ↩
The other option is to arrange a “self-managed abortion” – that is, “an abortion that takes place outside of the formal medical system, through any number of means, such as a medication regimen, herbs, or other long-standing cultural practices,” as the Community Justice Exchange and Repro Legal Defense Fund describe it in Dobbs Was Not The Beginning. Of course, self-managed abortions come with their own legal risks and logistical barriers, which that organizing guide explains. ↩
A recent article in The New York Times noted that “Many traveling patients faced multiday trips, lost income and child care costs.” ↩
In Maine, for example, 17-A MRS §1807(8) states, “…the Department of Corrections may impose on a person applying for such permission an application fee of $25. …Permission to leave may not be denied or withdrawn solely because the person is not able to pay the application fee or the additional fee. When a person fails to pay a fee imposed under this subsection, the department may refuse to process the application or may withdraw permission to leave if the failure to pay is attributable to the person’s willful refusal to pay or to a failure on the person’s part to make a good faith effort to obtain the funds required for the payment.” ↩
For instance, people on probation or parole in Missouri – a state with a total abortion ban – are advised that “you are required to discuss your travels with your Probation and Parole Officer at least 15 days in advance to allow time for the proper paperwork to be prepared.” ↩
As we detail in the linked briefing based on our analysis of the National Survey on Drug Use and Health (NSDUH), people under community supervision report substance use disorders at four times the rate – and mental health disorders at twice the rate – found in the general U.S. population. Twenty-five percent of people on probation and 27% of people on parole were uninsured at the time of the survey, even though many have incomes low enough to qualify them for Medicaid. Public health researchers Winkelman, Phelps, Mitchell, Jennings, & Shlafer (2020) analyzed the same survey data (but from 2015-2016) and found that people under community supervision are more likely to report fair or poor health, more chronic conditions, a diagnosis of COPD, hepatitis B or C, or kidney disease than people in the general population. The community supervision population also has higher rates of disabilities, with particularly high rates of cognitive disabilities. ↩
Last week, former President Donald Trump was convicted of 34 felonies in New York — becoming the first former (and perhaps future) president to be convicted of a felony. While the conviction will not prevent him from pursuing the presidency, he nonetheless joins over 19 million people in America with felony convictions. Unlike the vast majority of people with this status, Trump’s immense wealth and power will likely insulate him from the struggles most will face in securing much less prestigious jobs. That’s because many states permit if not outright facilitate bias against hiring people with records — especially roles that require professional licenses.
Criminal records lock people out of the job market, making everyone less safe
Most people who have criminal records are not billionaire reality TV stars or real estate moguls with wealth and connections to fall back on. For them, getting a job is a matter of survival, and having a record greatly diminishes their chances of success. That’s because a variety of policies across the country effectively disqualify and deter people with records from obtaining employment.
This dynamic traps people in a vicious cycle of poverty and policing that makes everyone less safe in the end. Nearly four out of every 10 people in state prison — most of whom had past convictions — were jobless in the month leading up to their arrest. Black people (46%) and women (53%) in state prisons were especially unlikely to have been employed during that time. Meanwhile, more than 600,000 people return to their communities from prison each year and struggle to secure employment, housing, healthcare, and care for children in large part due to restrictions imposed on those with criminal records. Even though people in this situation are more likely to be actively seeking jobs than the general public, they are far more likely to be rejected by employers and report unemployment at a rate five times higher than the general public. These differences are rooted in discriminatory policy choices, not individual aspirations or capabilities.
Even when people in these circumstances do find work, they are often relegated to the most insecure and low-paying positions. Licensed occupations can provide a path to better job security, but that option is foreclosed by counterproductive policies such as these.
State laws ban people with felony convictions from holding many jobs
State laws and policies give employers ample opportunities to reject potential workers simply on the basis of their having been convicted of a crime. Though explicit employment bans that prohibit hiring from these populations have been modified in some states in recent years thanks to tireless advocacy, decision-makers in most places still enjoy wide discretion to exclude people from certain kinds of work on these grounds.
This is especially true for occupations that require professional licensing, such as bartenders, exterminators, healthcare workers, and car salesmen. People who want to work in real estate — either as agents or developers — are often required to submit to criminal background checks as part of the licensing process, too. Though these bans most frequently target people who are convicted of felonies in particular, certain misdemeanors can also preemptively disqualify people as well.
Whether explicit or discretionary, occupational licensing restrictions for people with felonies on their records are widespread. Just a few examples include:
Pest control in North Carolina: No one can be issued an ID or work as an estimator, serviceman, salesman, solicitor, or an agent for any licensee if they have been convicted of a felony within three years of their application.
Car sales in Mississippi: People who want to sell cars must have “good moral character, honesty,” and “high ethical standards” — qualities that are “presumptively” not met if they were, among other things, convicted of a felony or certain misdemeanors.
Bartending in Florida: Licensed bars cannot employ anyone as a manager, person in charge, or bartender who has been convicted of a felony anywhere in the U.S. in the past 5 years.
Any health professional in Virginia: Previously licensed healthcare workers face mandatory license suspensions if convicted of a felony. This includes early-career positions like certified nursing assistants, veterinary technicians, and peer recovery specialists. Nurses, in particular, could be prevented from receiving licenses or certifications for any felony or misdemeanor involving “moral turpitude.”
Firefighters in Florida: Firefighters must not have been convicted of certain misdemeanors, a felony, or any crime punishable by at least one year of imprisonment.
Even indirect employment bans have devastating effects
Even when jurisdictions do not explicitly ban people with felony convictions from obtaining occupational licenses, they typically give licensing agencies so much discretion that they can deter potential job-seekers with records from applying. If you have a record but want to work as a plumber’s apprentice in Texas, you have to fill out an additional extensive “Supplemental Criminal History Information” form. In New York, meanwhile, people with criminal records are not explicitly banned from working in the real estate profession, but they are not entitled to receive real estate licenses without the express permission from the Secretary of State, either. Hurdles such as these are enough to keep most people from applying in the first place.
In other places, discretionary bans are designed to target people who have felony convictions that are “directly related” to the work they would be doing. In Texas, for example, Trump’s convictions for falsifying business records could easily be construed as grounds to deny him a license to handle insurance, taxes, or (as he loves to do) hiring and firing people as an employee for a professional employer organization.
Conclusion
It’s important to reiterate that most people with criminal records have to navigate these challenges with far fewer resources and connections, and far less power, than Donald Trump. Though he officially has a felony record, he will not encounter the majority of these barriers to making money, let alone surviving. In the coming months, we will likely see clear examples of how rich and powerful people like Trump are insulated from the consequences of a criminal record that millions of the most vulnerable people in society — typically the primary targets of the criminal legal system — are forced to endure each day. This will ultimately not be a lesson in equality in justice, but a reminder of the freedom from punishment that people in Trump’s position enjoy even in the rare instances that they are convicted of their crimes.
That being said, the lesson we take from Trump’s conviction should not be that the system needs to get tougher. In fact, the opposite is true: the fact that such employment policies are counterproductive to basic safety interests and are so unequally applied are strong reasons to lower barriers to work for the average person with a criminal record — not erect new ones. At the very least, anyone who believes that a felony conviction shouldn’t disqualify someone from the most powerful office on the planet must also agree that it makes no sense to prohibit others with felony convictions from serving in more ordinary roles as plumbers, pest control workers, and bartenders. Fortunately, there are plenty of measures states can take to make life easier for people with criminal records:
Enact occupational licensing reform: States should reform their licensing practices to eliminate the automatic rejection of people with felony convictions.
Ban blanketed employer discrimination: Criminal records are not good proxies for employability. Additionally, because of racially disproportionate incarceration rates, organizations who discriminate against people with criminal records may also be contributing to racial discrimination and are therefore subject to litigation under Title VII of the Civil Rights Act of 1964.
Implement automatic record expungement procedures: Having an automatic mechanism for criminal record expungement that takes into account the offense type and length of time since sentencing would, in the near term, help formerly incarcerated people succeed and would, in the long term, promote public safety.
Issue a temporary basic income upon release: Providing short-term financial stability for formerly incarcerated people would operate as an investment, helping to ease reintegration and provide public safety and recidivism reduction benefits that would result in long-term cost savings.
Make bond insurance and tax benefits for employers widely available: Some governmental bodies offer insurance and tax incentives for employers who hire people with criminal records, protecting against real or perceived risks of loss. Increasing the availability of such programs would provide hesitant employers with added financial security.
For more information about the kinds of policies that prevent people with criminal records from obtaining occupational licenses, the various collateral consequences of those policies, and state-by-state comparisons, the following organizations offer excellent resources:
We've updated the data tables and graphics from our 2017 report to show just how little has changed in our nation's overuse of jails: too many people are locked up in jails, most detained pretrial and many of them are not even under local jurisdiction.
One out of every three people behind bars is being held in a local jail, yet jails get almost none of the attention that prisons do. In 2017, we published an in-depth analysis of local jail populations in each state: Era of Mass Expansion: Why State Officials Should Fight Jail Growth. We paid particular attention to the various drivers of jail incarceration — including pretrial practices and holding people in local jails for state and federal authorities — and we explained how jails impact our entire criminal legal system and millions of lives every year. In the years since that publication, many states have passed reforms aimed at reducing jail populations, but we still see the same trends playing out: too many people are confined in local jails, and the reasons for their confinement do not justify the overwhelming costs of our nation’s reliance on excessive jailing.
People cycle through local jails more than 7 million1 times each year and they are generally held there for brief, but life-altering, periods of time.2 Most are released in a few hours or days after their arrest, but others are held for months or years,3 often because they are too poor to make bail.4 Fewer than one-third of the 663,100 people in jails on a given day have been convicted5 and are likely serving short sentences of less than a year, most often for misdemeanors. Jail policy is therefore in large part about how people who are legally innocent are treated, and how policymakers think our criminal legal system should respond to low-level offenses.
Figure 1. The frequent practice of renting jail cells to other agencies makes it difficult to draw conclusions from the little data that is available. This update to our 2017 report offers an updated analysis of national data to offer a state-by-state view of how jails are being used and we continue to find that pretrial populations continue to drive jail growth across the country. The data behind this graph is in Appendix Table 1.
Pretrial policies have a warehousing effect
The explosion of jail populations is the result of a broader set of policies that treat the criminal legal system as the default response to all kinds of social problems that the police and jails are ill-equipped to address. In particular, our national reliance on pretrial detention has driven the bulk of jail growth over the past four decades.
More than 460,000 people are currently detained pretrial — in other words, they are legally innocent and awaiting trial. Many of these same people are jailed pretrial simply because they can’t afford money bail, while others remain in detention without a conviction because a state or federal government agency has placed a “hold” on their release.
Pretrial detention disproportionately impacts already-marginalized groups of people:
Low income: The median felony bail amount is $10,000, but 32% of people booked into jail in the past 12 months reported an annual income below $10,000.
Black people:43% of people detained pretrial are Black. Black people are jailed at more than three times the rate of white people.
Health problems:40% of people in jail reported a current chronic health condition. 18% of people booked into jail at least once in the past 12 months are not covered by any health insurance.
Mental illness:45% of people booked into jail in the past 12 months met criteria for any mental illness, compared to only 30% of people who had not been jailed.
Experiencing homelessness: While national data don’t exist on the number of people in jail who were experiencing homelessness at the time of their arrest, data from Atlanta show that 1 in 8 city jail bookings in 2022 were of people who were experiencing homelessness.
Lesbian, gay, or bisexual: 15% of people booked into jail in the past 12 months identify as lesbian, gay, or bisexual, compared to 10% of people not booked in the past year.
This confinement creates problems for individuals on a short-term basis and also has long-term effects. Research in different jurisdictions has found that, compared to similarly-situated peers who are not detained, people detained prior to trial are more likely to plead guilty, be convicted, be sentenced to jail, have longer sentences if incarcerated, and be arrested again. And these harms accrue quickly: being detained pretrial for any amount of time impacts employment, finances, housing, and the well-being of dependent children. In fact, studies have found that pretrial detention is associated with a decreased likelihood of court appearance and an increased likelihood of additional charges for new offenses. There is no question that wholesale pretrial detention does far more harm than good for an increasing number of people and communities.
Renting jail space: a perverse incentive continues to fuel jail growth
There are two different ways to look at jail populations: by custody or jurisdiction. The custody population refers to the number of incarcerated people physically in local jails. The jurisdictional population focuses on the legal authority under which someone is incarcerated, regardless of the type of correctional facility they are in. This means that there are people in the physical custody of local jails, but who are under the jurisdictional authority of another agency, such as the federal government (including the U.S. Marshals Service, immigration authorities, and the Bureau of Prisons) or state agencies (namely the state prison system). For example, immigration authorities can request that local officials notify ICE before a specific individual is released from jail custody and then keep them detained for up to 48 hours after their release date. These holds or “detainers” essentially ask local law enforcement to jail people even when there are no criminal charges pending.
State and federal agencies pay local jails a per diem (per day) fee for each person held on their behalf. For example, in 2024, the state Department of Public Safety and Corrections (prison system) pays local jails in Louisiana $26.39 per person per day, and more than 14,000 people in the Department’s custody were in local jails in 2022. The fees paid by different agencies to confine people in local jails range and depend on the contract between agencies: In 2023, the per diem rate negotiated between Daviess County, Kentucky and the U.S. Marshals Service increased from $55 to $70 per person per day. And these per diem fees can rack up quickly: in fiscal year 2021, the U.S. Marshals Service paid North Carolina counties more than $31 million for jail holds, while the Louisiana Department of Public Safety and Corrections spent more than $123 million on their “local housing of adult offenders” program.
In 28 states and the District of Columbia, more than 10% of the jail population is being held on behalf of a state or federal authority. This both skews the data and gives local jail officials a powerful financial incentive to endorse policies that contribute to unnecessary jail expansion. Local sheriffs — who operate jails that are rarely filled to anywhere near their total capacity with people held for local authorities — can pad their budgets by contracting out extra bed space to federal and state governments. To be sure, sharing some jail capacity can be a matter of efficiency: for example, if one county’s jail is occasionally full, borrowing space from a neighboring county may be better than building a larger jail. And, in some states — like Missouri — state law requires that local jails agree to hold people for state or federal agencies. But the systematic renting of jail cells to other jurisdictions — while also building ever-larger facilities in order to cash in on that market6— changes the policy priorities of jail officials, leaving them with little incentive to welcome or implement reforms.
In our 2017 report, we found this phenomenon was most visible in Louisiana, where the state largely outsourced the construction and operation of state prisons to individual parish (county) sheriffs.7 The most recent data suggests that as of 2022, Louisiana, Kentucky, and Mississippi stand out as the worst offenders. In all three states, at least one-third of the state prison population is actually held in local jails (53% in Louisiana, 47% in Kentucky, and 33% in Mississippi).8
Another major consumer of local jail cells is the federal government, starting with the U.S. Marshals Service, which rents about 26,200 jail spaces each year — mostly to hold federal pretrial detainees in locations where there is no federal detention center. In the District of Columbia, South Dakota, New Hampshire, and New Mexico, more than 15% of the statewide jail population was actually held for the U.S. Marshals Service in 2019. Meanwhile, Immigration and Customs Enforcement rents about 15,700 jail spaces each year for people facing deportation.9 In 2019, New Jersey stood out with 16% of the statewide jail population held for immigration authorities, followed by Mississippi (10%).
We should note there is significant geographic variation in just how much of a jail’s population is held for other authorities: more than a quarter of people in rural jails were held for state, federal, or American Indian and Alaska Native tribal governments in 2019, compared to only 11% of people in urban jails.10 The distribution also varies by state, as each has different levels of “excess” jail capacity, and federal officials have specific needs in different parts of the country.
The practice of holding people in local jails for other authorities carries significant personal, social, and fiscal costs, often exposing detained people to the harms of incarceration for longer periods of time than they would be otherwise. Jails are not designed to hold people for any significant period of time; they lack sufficient programming, services, and medical care to house people for months or years.11 This practice also contributes to jail overcrowding, which fuels jail construction and expansion in turn. As scholars Jack Norton, Lydia Pelot-Hobbs, and Judah Schept succinctly put it: “When they build it, they fill it, and counties across the country have been building bigger jails and planning for a future of more criminalization, detention, and incarceration.”
Contextualizing prison and jail population changes during and after the COVID-19 pandemic
Most of the data used in this report come from the Bureau of Justice Statistics’ Census of Jails, which was most recently administered in 2019 and published in 2022 (see the methodology for sourcing details). However, the prison population data used to create our state-specific graphics are from 2022 and reveal the dramatic impact of the COVID-19 pandemic on prison populations in many states over time. They show that state and federal prison admissions dropped 40% in the first year of the pandemic (2020). While not reflected in the 2019 data used in this briefing, we know that by June 2021, jail admissions were down 33% compared to the 12 months ending in June 2019. Before 2020, the number of annual jail admissions was consistently 10 million or more. Because these declines were not generally due to permanent policy changes, we expect that both prison and jail admissions will return to pre-pandemic levels as cases that were delayed for pandemic-related reasons work their way through the court system.
Recommendations
Our recommendations from 2017 remain just as relevant today, and can help state and local officials move away from using jails as catch-all responses to problems that disproportionately impact poor and marginalized communities:
Change offenses and how offenses are treated
States should reclassify criminal offenses and turn charges that don’t threaten public safety into non-jailable infractions.12
For other offenses, states should create a presumption of citation, in lieu of arrests, for certain low-level crimes.13
For low-level crimes where substance abuse and/or mental illnesses are involved, states should make community treatment-based diversion programs the default instead of jail.14 States should also fully fund these diversion programs.15
Help people successfully navigate the criminal legal system to more positive outcomes
States should immediately set up pilot projects to test promising programs that facilitate successful navigation of the criminal legal system. Court notification systems and other “wrap-around” pretrial services often increase court appearances while also reducing recidivism.16
Change policies that criminalize poverty or that create financial incentives for unnecessarily punitive policies
States should eliminate the two-track system of justice by abolishing money bail. States that are not ready to take that step should start by abolishing the for-profit bail industry in their state, and providing technical resources to existing local-level bail alternative programs to help these programs self-evaluate and improve state-level knowledge.17
Address the troubling trend of renting jail space
States should evaluate whether the renting of local jail space to state and federal authorities is steering local officials away from effectively addressing local needs.18
Updated state-specific graphics
In 2017, we argued that if lawmakers want criminal legal system reform, they must pay attention to jails. Years later, this remains true. To help state officials and state-level advocates craft reform strategies appropriate for their unique situations, this report offers updated data and state-specific graphs on conviction status, as well as changes in incarceration rates and populations in both prisons and jails.
The graphs made for this briefing are included in our profiles for each state:
Jails are, by definition, a distributed mess of “systems,” so accessing relevant data can be a challenge. Jails often hold people for other (state and federal) agencies and, at times, the numbers can be large enough to obscure the results of state- and local-level policy changes. For that reason, this report takes the time to separate out people held in jails for state prison systems or federal agencies, such as Immigration and Customs Enforcement, the Bureau of Prisons, the U.S. Marshals Service, and the Bureau of Indian Affairs.
Our national data come from our own analysis of multiple Bureau of Justice Statistics datasets. The National Jail Census series provides the most complete annual snapshot of jail populations. Our state-level data are from the Census of Jails for the years 1983, 1988, 1993, 1999, 2005, 2013, and 2019, and the Deaths in Custody Reporting series (now called Mortality in Correctional Institutions) for the years 2000-2004, 2006-2012, and 2014-2018. (We considered using the Annual Survey of Jails for our state-level data, but the Bureau of Justice Statistics explains that this dataset was “designed to produce only national estimates” and, after much testing, we concluded that this dataset could not reliably be used for state-level summaries.) There are no comparable data available for state-by-state jail population comparisons published more recently than 2019. 19
Jails — or facilities that serve the functions of jails — operate in all states, but in six states (Alaska, Connecticut, Delaware, Hawaii, Rhode Island, and Vermont) most or all of the jail system is integrated into the state prison system, so the “jail” populations in those states are not reflected in the federal data products on which this report relies (they are instead counted in the annual prison data). For that reason, we are unable to report state-specific data for those states, and those states are not included in the national totals reported in this report. Because these six states are relatively small in terms of population, we do not think their exclusion meaningfully impacts the national totals nor the much more important analysis of the trends within the national totals.
Many of our data sources are labeled on the individual graphics, but in some cases we had to combine multiple datasets or perform complicated adjustments where additional detail would be helpful to other researchers and advocates:
National data:
National number of people held in local jails for state and federal agencies (also referred to as “boarding” or “renting”):
National number of people held in local jails for all of the various federal authorities, including Immigration and Customs Enforcement (ICE), the Bureau of Prisons (BOP), the U.S. Marshals Service, and the Bureau of Indian Affairs: We have national-level data for 1983, 1988, 1993, 1999, 2005, 2013, and 2019. For those years, we used the National Jail Census series for the number of people held in local jails for the Bureau of Prisons or U.S. Marshals Service and for immigration authorities. For 2002-2005, 2007-2013, 2017-2018, and 2020-2022, the number of people held in local jails for immigration authorities comes from the Annual Survey of Jails series. For years between the National Jail Census series — when we were not able to find compatible data — we estimated the populations based on a linear trajectory. The estimates are noted in the appropriate appendix tables to differentiate them from the reported data from the Bureau of Justice Statistics.
National number of people held in local jails for state authorities: The Bureau of Justice Statistics, Prisoners series (1983-2022) publishes the number of people held in local jails for state authorities and this data is available for every year from 1983 to 2022. (This data point is also collected in the Census of Jails and the Annual Survey of Jails but we concluded, after much study, that the Prisoners series, based on data collected directly from states’ Departments of Corrections, was more reliable and more frequently collected and published.)20
National pretrial and jail sentenced populations: Total numbers for each category are reported in the National Jail Census series (1983, 1988, 1993, 1999, 2005, 2013, and 2019). We then adjusted the reported figures for the convicted and unconvicted populations to remove those held for other agencies from these jail totals. For years between the National Jail Census series — when we were not able to find compatible data — we estimated the populations based on a linear trajectory. The estimates are noted in the appropriate appendix tables to differentiate them from the reported data from the Bureau of Justice Statistics.
We removed 100% of people held for state prison systems (all of whom have been convicted and sentenced to prison terms) from the jail convicted totals (everyone else who has been convicted but not sentenced to prison).
We removed 34.1% of the people being held under the authority of Immigration and Customs Enforcement from the jail convicted population and removed the balance from the jail unconvicted population. (We based these percentages of the population held for ICE on our analysis of the Survey of Inmates in Local Jails, 2002. We found 34.1% of ICE detainees were there “to await sentencing for an offense,” “to await transfer to serve a sentence somewhere else,” “to serve a sentence in this jail,” or “to await a hearing for revocation of probation/parole or community release.”) This percentage calculation ignored any respondent who did not answer the question, and counted anyone who answered both a “convicted” and “unconvicted” status as convicted. We deliberately used this methodology which counts those awaiting revocation hearings as “convicted” because that matches the methodology used in our main dataset for this project: the National Jail Census. (Not surprisingly, since the people detained for ICE were answering a survey intended for criminal legal system populations, the leading response (41%) for ICE detainees about why they are being held in jail, after being read a list of statuses like “to serve a sentence” or “to await arraignment” was to answer “for another reason.”)
We removed 75.9% of the people being held for either the Bureau of Prisons or the U.S. Marshals Service from the jail convicted population and we removed the balance from the jail unconvicted population. (We based these percentages on our analysis of the Survey of Inmates in Local Jails, 2002 as described above for people detained for ICE).
State data:
Our historical, state-specific data on prisons, jails, and the changes in jail composition come from several different data sources:
For the state-level graphs on the jail and prison populations, the jail populations are based on the National Jail Census series for the years 1978, 1983, 1988, 1993, 1999, 2005, 2013, and 2019 and the Deaths in Custody Reporting series (now called Mortality in Correctional Institutions) for 2000-2004, 2006-2012, and 2014-2018. For years between the National Jail Census series — when we were not able to find compatible data — we estimated the populations based on a linear trajectory. The estimates are noted in the appropriate appendix tables to differentiate them from the reported data from the Bureau of Justice Statistics. As described above, our jail population totals were adjusted to remove people held for state or federal authorities in order to focus on those held by local authorities under local jurisdiction. The number of people in state prisons comes from the Bureau of Justice Statistics, Correctional Statistical Analysis Tool — Prisoners for 1978-2019 and Table 2 of Prisoners in 2020, Prisoners in 2021, and Prisoners in 2022 for 2020-2022. Of note, people sentenced for felonies in the District of Columbia were transferred to the Federal Bureau of Prisons as of December 2001, so there is no prison population or rate for the District for 2001-2022.
For the state-level graphs on jail and prison incarceration rates, for the jail populations in each state we divided the above (adjusted) numbers by the July 1st U.S. Census Bureau’s Census Vintage Population Estimates, which we have published in Appendix Table 6, and multiplied the result by 100,000 to show an incarceration rate per 100,000 people in each state for each year on the graph. The jail populations used in this report were collected on June 30th (“midyear”) for most years, so we used U.S. Census Bureau population estimates from July 1st for each year. Our state prison incarceration rates come from the Bureau of Justice Statistics, Correctional Statistical Analysis Tool — Prisoners for 1978-2019 and Table 7 of Prisoners in 2020, Prisoners in 2021, and Prisoners in 2022 for 2020-2022. Of note, people sentenced for felonies in the District of Columbia were transferred to the Federal Bureau of Prisons as of December 2001, so there is no prison population or rate for the District for 2001-2022.
For the state graphs of the number of people incarcerated in local jails by conviction status, we calculated estimates of the number of people held for local authorities by conviction status without including people held for federal or state authorities. The Census of Jails does not report the conviction status of people held for other authorities separately from those held for local authorities, so we based our estimate on the only reported ratio of convicted/unconvicted which includes the entire custody population. (We concluded that our national estimates of the portion of people held for state prisons or various federal agencies that are convicted or unconvicted were not reliable at the state level, so we used a simpler methodology for our state graphs.) To create this estimate, we determined the percentages of all people being held in jails in each state who were convicted and unconvicted in the National Jail Census series (1978, 1983, 1988, 1993, 1999, 2005 and 2013). We then subtracted the number of people held for state or federal authorities from the total statewide jail population, and applied our percentage convicted/unconvicted to the remainder. Because most people in jails being held for other authorities are convicted, we believe, our figures likely undercount the unconvicted/pretrial populations and overcount the convicted populations.
For the six states where the federal government can not provide jail counts or conviction status data, we only graphed the state prison portions.
Pretrial detention — for any amount of time — impacts employment, finances, housing, and the well-being of dependent children. In addition, jail stays are life-threatening: from 2000 to 2019, over 20,000 people died in local jails. In 2019 alone, more than one thousand people died in local jails. ↩
Jail stays are increasing in length: in 2022, people spent 8 more days in jail (32.5 days) on average than they did in 2015 (Bureau of Justice Statistics, Jail Inmates in 2022, Appendix Table 1). ↩
When he was 16 years old, Kalief Browder was held in New York City’s Rikers Island jail for three years, including almost two years in solitary confinement, because his family could not afford his $3,000 bail. ↩
Among the 663,100 people in jail on June 30, 2022, 70% (466,100) were unconvicted and held pretrial (Bureau of Justice Statistics, Jail Inmates in 2022, Table 5). However, 2019 is the most recent year for which jail data can be adjusted to exclude the people being held by federal and state authorities. This adjustment of 2019 jail data reveals that in 2019, 76% of the 604,400 people in jail held for local authorities were unconvicted (pretrial). See Figure 1. ↩
For example, in Bladen County, North Carolina, a newly built jail had earned the county nearly $2 million in the first 18 months of renting jail beds to the federal government in 2019. At the time of our 2017 report, a clear example of this pattern took place when officials in Blount County, Tennessee used “jail overcrowding” to justify a 2016 proposal for jail expansion. A deeper analysis, however, revealed that the county’s jail was overcrowded in large part because it was renting space to the state prison system. The county then cut back on renting space to the state prison system and reportedly explored other ways to reduce its jail population in place of jail expansions (we have not found evidence of a new jail or expanded jail in Blount County as of March 2024). ↩
Louisiana’s jail building boom appears to have been entirely fueled by the pursuit of contracts with the state’s prison system. As The Times-Picayune has explained, “In the early 1990s, when the incarceration rate was half what it is now, Louisiana was at a crossroads. Under a federal court order to reduce overcrowding, the state had two choices: Lock up fewer people or build more prisons. […] It achieved the latter, not with new state prisons — there was no money for that — but by encouraging sheriffs to foot the construction bills in return for future profits.” ↩
In terms of the impact on local jail populations, in 2019 (the most recent year with this data) people held in jails for state prison systems accounted for 29% of jail populations statewide in Mississippi, 30% in Louisiana, and 41% in Kentucky (Bureau of Justice Statistics, Prisoners in 2022, Table 14, and Census of Jails, 2005-2019, Table 12). ↩
These detainers, or “immigration holds,” request that local officials notify ICE before a specific individual is released from jail custody and then to keep them there for up to 48 hours after their release date, basically asking local law enforcement to jail people even when there are no criminal charges pending. For more details, see our 2020 explainer on these practices. ↩
For example California, Massachusetts, and Ohio have reduced offenses from minor misdemeanors to non-jailable infractions. ↩
For example, while all states allow citation in lieu of arrest for misdemeanors, only a handful of states permit citations for some felonies or do not broadly exclude felonies. See the National Conference of State Legislatures, 50 State Chart on Citation In Lieu of Arrest, last updated on March 18, 2019. ↩
For example, in Pima County, Arizona, as part of the MacArthur Foundation’s Safety and Justice Challenge, officials have begun screening people for mental health and substance abuse concerns who are arrested before their initial court appearance. Other diversion programs, such as Law Enforcement Assisted Diversion (LEAD) programs, coordinate the efforts of local law enforcement agencies with community-based service providers in counties like Multnomah County, Oregon. For more on LEAD programs, see the Addiction Policy Forum, Center for Health and Justice, National Criminal Justice Association “Innovation Spotlight: Law Enforcement Assisted Diversion.” ↩
For readers wondering when the next state-level data will be collected and published, the Bureau of Justice Statistics is planning a 2024 Census of Jails collection and has proposed replacing the Annual Survey of Jails with a more concise annual Census of Jails thereafter. The data are typically published about two years after collection. ↩
Please note that because our methodology is not the same as the Bureau of Justice Statistics, some numbers used in this publication differ from the published data in the Census of Jails, 2005-2019 — Statistical Tables. ↩
We’ve drilled down into 2019 data to show prison and jail releases by sex in each state and made our best estimates of how many women and men were released from prisons and jails nationwide in 2022.
We often think about incarceration as something only experienced behind bars, but millions of people leave correctional facilities every year in serious need of services and reentry resources. Journalists, advocates, and other users of our website reach out frequently to ask if we know the total number of people released from prisons and jails in their state each year. Many are trying to fight for more resources for people returning home and want to know how these numbers break down by sex. While these are numbers you might expect would be easy to find, they aren’t published regularly in annual reports on prison and jail populations by the Bureau of Justice Statistics (BJS).
In fact, the annual data collected by the federal government about local jails (the Annual Survey of Jails) cannot generally be broken down by state at all; only the more infrequently-collected Census of Jails data can be used to make state-level findings. As for prisons, 2019 is also the latest year for which state-level release data by sex 1 have been published by the Bureau of Justice Statistics. (The total number of people released by each prison system is published annually by the BJS, most recently reporting 2022 data.)
To make this information more accessible, we’ve drilled down into the most recent data available to show how many men and women are released from prisons and jails each year.2
Releases from prisons and jails in 2019, by sex, by state or other jurisdiction
Sources: Bureau of Justice Statistics’ National Prisoner Statistics (for prisons), extracted through the Corrections Statistical Analysis Tool (CSAT), and the 2019 Census of Jails (for jails). Local jail data were weighted and aggregated to the state level by the Prison Policy Initiative. Alaska, Connecticut, Delaware, Hawaii, Rhode Island, and Vermont operate combined or “unified” prison and jail systems, so all releases from correctional facilities in those states are reported by the Bureau of Justice Statistics as prison releases. Alaska is a partial exception among these states, because there are still 14 locally operated jails that report data separately from the unified system.
Deaths in prison, which are generally included in prison release data, were excluded from prison release totals to better reflect the “reentry” population; however, deaths in prisons are not published by sex. As a result, total prison releases will be slightly less than the sum of men’s and women’s prison releases. The number of deaths in federal (BOP) prisons in 2019, subtracted from total releases, comes from Mortality in State and Federal Prisons, 2001-2019 – Statistical Tables. The number of deaths in local jails is not published by the Bureau of Justice Statistics.
Note about District of Columbia: D.C.’s prison population is part of the federal Bureau of Prisons (BOP) system. The BOP releases people to all states and territories, and publishes this data each month on its website.
Men
Women
Totals
Prisons
Jails
Total
Prisons
Jails
Total
Prisons
Jails
Total Releases, 2019
Alabama
10,878
209,401
220,279
2,187
76,060
78,247
12,920
285,461
298,526
Alaska
1,577
4,171
5,748
140
1,113
1,253
1,714
5,284
7,001
Arizona
11,344
142,106
153,450
1,700
47,264
48,964
12,933
189,370
202,414
Arkansas
8,949
124,039
132,988
1,392
46,021
47,413
10,259
170,060
180,401
California
34,976
751,994
786,970
2,888
197,978
200,866
37,462
949,971
987,835
Colorado
8,289
165,718
174,007
1,602
51,879
53,481
9,840
217,597
227,488
Connecticut
4,161
n/a
4,161
319
n/a
319
4,473
n/a
4,480
Delaware
1,981
n/a
1,981
296
n/a
296
2,269
n/a
2,277
District of Columbia
n/a
9,043
9,043
n/a
1,430
1,430
n/a
10,473
10,473
Federal (BOP)
46,320
n/a
46,320
4,738
n/a
4,738
50,677
n/a
50,677
Florida
26,498
500,267
526,765
3,642
156,695
160,337
29,737
656,962
687,102
Georgia
15,311
450,320
465,631
2,044
126,536
128,580
17,200
576,856
594,211
Hawaii
1,408
n/a
1,408
259
n/a
259
1,654
n/a
1,667
Idaho
3,502
51,179
54,681
941
18,889
19,830
4,416
70,068
74,511
Illinois
21,963
197,855
219,818
1,930
56,108
58,038
23,791
253,962
277,855
Indiana
9,499
185,643
195,142
1,586
57,839
59,425
10,988
243,482
254,567
Iowa
6,166
100,482
106,648
969
33,221
34,190
7,114
133,703
140,838
Kansas
5,037
118,963
124,000
1,005
40,370
41,375
6,007
159,332
165,374
Kentucky
15,289
209,733
225,022
4,358
81,721
86,079
19,580
291,455
311,102
Louisiana
15,017
197,568
212,585
1,930
51,763
53,693
16,835
249,332
266,279
Maine
623
23,540
24,163
132
7,492
7,624
755
31,032
31,787
Maryland
6,819
63,722
70,541
649
15,464
16,113
7,408
79,185
86,653
Massachusetts
2,088
52,182
54,270
304
7,295
7,599
2,362
59,477
61,869
Michigan
10,580
217,041
227,621
896
63,300
64,196
11,440
280,341
291,817
Minnesota
6,221
152,126
158,347
811
49,202
50,013
6,964
201,329
208,361
Mississippi
6,247
120,815
127,062
800
29,127
29,927
6,971
149,942
156,989
Missouri
15,350
205,784
221,134
3,271
58,586
61,857
18,533
264,369
282,990
Montana
2,051
31,497
33,548
436
10,927
11,363
2,475
42,423
44,910
Nebraska
2,020
50,662
52,682
333
16,192
16,525
2,336
66,855
69,208
Nevada
5,678
114,718
120,396
1,011
42,302
43,313
6,646
157,020
163,709
New Hampshire
1,166
16,993
18,159
183
5,424
5,607
1,339
22,417
23,766
New Jersey
7,706
101,882
109,588
522
16,867
17,389
8,182
118,749
126,977
New Mexico
2,951
83,350
86,301
595
29,366
29,961
3,528
112,716
116,262
New York
19,482
137,565
157,047
1,421
30,049
31,470
20,791
167,614
188,517
North Carolina
14,924
290,436
305,360
2,291
91,634
93,925
17,106
382,070
399,285
North Dakota
1,085
34,744
35,829
274
11,765
12,039
1,358
46,509
47,868
Ohio
17,727
296,495
314,222
2,683
99,564
102,247
20,275
396,059
416,469
Oklahoma
7,840
152,719
160,559
1,603
54,713
56,316
9,365
207,432
216,875
Oregon
5,099
138,541
143,640
801
44,380
45,181
5,870
182,921
188,821
Pennsylvania
16,256
159,945
176,201
1,800
41,487
43,287
17,897
201,432
219,488
Rhode Island
683
n/a
683
37
n/a
37
720
n/a
720
South Carolina
5,505
142,470
147,975
774
39,364
40,138
6,208
181,834
188,113
South Dakota
3,725
48,612
52,337
868
18,062
18,930
4,576
66,673
71,266
Tennessee
11,728
287,094
298,822
2,576
110,837
113,413
14,205
397,931
412,235
Texas
67,863
776,801
844,664
10,669
217,109
227,778
78,119
993,910
1,072,442
Utah
3,428
72,275
75,703
610
24,688
25,298
4,017
96,963
101,001
Vermont
2,216
n/a
2,216
321
n/a
321
2,528
n/a
2,537
Virginia
10,925
218,493
229,418
1,772
65,724
67,496
12,602
284,217
296,914
Washington
21,807
202,327
224,134
2,684
64,430
67,114
24,455
266,757
291,248
West Virginia
3,465
33,632
37,097
687
12,310
12,997
4,124
45,942
50,094
Wisconsin
5,393
163,160
168,553
471
44,661
45,132
5,820
207,820
213,684
Wyoming
842
21,643
22,485
182
6,779
6,961
1,010
28,422
29,446
Total, 50 states
491,338
7,820,699
8,321,080
71,655
2,373,986
2,445,641
559,177
10,193,255
10,766,721
Total, all jurisdictions
537,658
7,829,742
8,367,400
76,393
2,373,986
2,450,379
609,854
10,203,728
10,817,398
Why we need data disaggregated by sex or gender identity
For years, the mass incarceration of women has been overlooked, even though women’s incarceration has grown at twice the pace of men’s incarceration in recent decades. Women are disproportionately locked up in local jails, where they’re less likely to be able to afford money bail if they’re not convicted, or are more likely to be serving a shorter sentence for a property or drug offense. While there, women in jail experience bleak conditions like expensive phone calls, a lack of programming and education opportunities, and poor quality healthcare.
Being locked up in a state prison also presents a unique set of challenges for women, including the higher chance of being hundreds of miles away from loved ones. No matter how or where a woman is incarcerated, women are generally worse off than men leading up to their incarceration. And entire families are harmed when a woman is put in prison or jail: More than half of incarcerated women are mothers, and women are more likely than men to be primary caregivers to children. Ultimately, keeping women out of correctional facilities and supporting them post-release should be a top priority for lawmakers.
Unfortunately, data regarding women in the criminal legal system are neither updated regularly nor always compatible across years, obscuring our collective view of what’s happening to women in the criminal legal system and how specific reforms impact them. When it comes to gender identity in prisons and jails, the data are even worse, as government surveys typically include trans men under “females” and trans women under “males,” and do not ask further about self-reported gender identity.3 Without better data collection and reporting, the unique needs of women, as well as transgender and nonbinary people, will go on being disregarded in policy and practice.
What’s changed since these data were collected in 2019?
The COVID-19 pandemic caused a dramatic drop in correctional populations in 2020 and 2021 – although this was due to fewer admissions, not more releases – so there have been fewer people eligible for release in the last couple of years. Even though prison and jail populations have unfortunately largely rebounded since then, there were still 29% fewer releases from prisons and jails in 2022 compared to 2019.4 Because of this dramatic difference from 2019, we also calculated rough estimates of releases by sex in 2022 on the national level for those interested in what more recent release numbers look like:
Estimated releases from prisons and jails, by sex, in 2022
With the exception of the total releases from prisons, all numbers are estimates based on 2019 data and should be used with caution. Details may not sum to totals due to rounding.
Men
Women
Total
Releases from state and federal prisons (excluding deaths)
388,355
55,179
443,534
Releases from local jails
5,537,103
1,678,855
7,215,958
Releases from all prisons and jails
5,925,457
1,734,034
7,659,492
To estimate what 2022 releases from prisons might look like by sex, we started with the number of state and federal prison releases, excluding deaths, reported in 2022 by the Bureau of Justice Statistics: 443,534.5 We then used the 2019 data to find the percentage of all prison releases that were from female prisons, which was about 12%; this percentage was based on all releases including deaths, because deaths in prison aren’t reported by sex. Applying this percentage to total prison releases in 2022, we estimate that about 55,179 people were released from female state and federal prisons in 2022, of which about 3,951 were from federal prisons.6
To estimate the number of releases from local jails in 2022 by sex, we first had to estimate the number of total releases, which the Bureau of Justice Statistics did not publish. We started with the number of jail admissions reported for that year: 7.3 million, according to the Bureau of Justice Statistics.7 Most people are jailed for a relatively short time, typically released from jail the same year they are admitted, so we would expect the number of admissions to be very close to the number of releases.8 In 2019, there were just 1.15% fewer people released from jails nationwide than were admitted that year. We applied this percentage to the 7.3 million jail admissions in 2022, arriving at an estimated 7,215,958 releases from local jails in 2022. To estimate how many of those releases were women, we calculated the percentage of all jail releases in 2019 that were women (23%) and applied that percentage to our estimate for total jail releases in 2022. Because there is no national source of data for jail deaths in 2022, we could not exclude deaths from these estimates of jail releases.
Opportunities for further data analysis
We also get lots of questions about the number of people released to local communities (counties, cities, et cetera). While we don’t have a solution that works for every state, we do suggest two different ways to generate estimates in our previous briefing about releases.
Data collection efforts regarding incarcerated women are slowly improving in some areas: For example, the Bureau of Justice Statistics is considering adding questions about pregnancy and maternal health in its national surveys of correctional facilities. In the meantime, we hope this dataset is useful in your advocacy work. The 2019 release data can be accessed from our Data Toolbox; for more information about mass incarceration in your state, see our State Profiles pages.
Footnotes
Even the available data that are disaggregated by sex are frustratingly limited, in that they typically only differentiate between “male” and “female,” ignoring the reality that the gender identities of confined people (and all people, for that matter) are not limited to this binary. This field of research has a long way to go before the data are consistently collected and reported by gender identity rather than an administrative categorization of “male” versus “female.” ↩
Astute readers will notice that male and female releases sum up to more than the total number of releases in a state. This discrepancy occurs because the Bureau of Justice Statistics does not publish the number of deaths — which count as a form of “release” — by sex. We removed the number “released” due to death from the total prison releases to better reflect the number of people in the reentry population in each state, but could not do the same calculation by sex. If you are able to find the number of male or female deaths in your state’s prisons or jails in 2019, you can get slightly closer to the number of people released. ↩
In state and federal prisons in 2022, there were 443,534 releases (excluding deaths), a 27% decrease from 609,869 in 2019. In jails, we estimate there were about 7,215,958 releases in 2022, and 10,203,728 releases in 2019, a 29% difference. (Because BJS published only the number of admissions to – and not releases from – jails for 2022, we calculated our own estimate for releases in 2022. To do so, we first calculated the ratio of annual releases to annual admissions in 2019 (98.85%), and then applied that ratio to the published estimate of admissions in 2022 (7,300,000), arriving at our 7,215,958 estimated releases.) ↩
We did not attempt state-level estimates by sex for 2022 because the number of women released from some state prisons in 2019 was quite small. For example, just 37 sentenced women were released in Rhode Island that year, and several other states reported fewer than 200 female releases. Because of these small numbers, even small changes in the distribution of releases by sex from 2019 to 2022 would have a sizable impact on the accuracy of our state-level estimates. However, if any readers are looking for back-of-the-envelope estimates at the state level, they could follow the logic of our methodology for our national estimates using the state-level data from 2019. ↩
We analyzed prison policies for all 50 states and the federal prison system, and found that 16 prison systems actually impose fines — in addition to other punishments — when someone violates a prison rule. We explain why disciplinary fines and fees are bad policy, putting excessive hardship on incarcerated people and their loved ones.
In yet another example of how the criminal legal system extracts wealth from the poorest families, at least one-third of prison systems nationwide charge fines as a punishment for a rule violation. Prison administrators claim that imposing disciplinary fines, along with other punishments, helps to maintain order and reduce violence in correctional facilities. They also argue that the fines simulate outside-of-prison processes for dealing with misconduct, such as parking tickets.
Though rule violations1 and their corresponding sanctions are a common feature of incarceration, disciplinary fines and fees aren’t the way to create safe environments where people can prepare for their release. On the contrary, when prisons impose these charges and subsequently help themselves to the funds in people’s prison accounts, incarcerated people are often left with little to no money for purchasing essential items and services that the prison doesn’t provide.2 As a result, their mental and physical health suffers, creating a more volatile environment inside. Loved ones also pay the price of these fines — often literally, as a primary source of financial support.
Like medical “co-pays” and exceedingly low wages in prison, disciplinary fines and fees are little more than a means to exploit incarcerated people. Whether they’re tiered fines or flat “administrative” fees, they are an undue burden; prison is already one big financial sanction for those who are already on the lowest rungs of the economic ladder. By focusing on punitive measures that deprive people further, prisons miss the mark on what actually makes prisons safer — providing opportunity rather than taking it away. We hope advocates and policymakers will understand how disciplinary fees, which exist alongside other excessive punishments, undermine the rehabilitative goals of corrections, the safety of people inside, and the odds of success during reentry.
In the 16 prison systems we found that impose fines for disciplinary violations, it would take anywhere from a full day of work to multiple years to pay off a single fine.
Disciplinary fines and fees are used in about one-third of all prison systems
To determine just how common disciplinary fines and fees are, we combed through the publicly available policies on prison disciplinary procedures in each state and the federal prison system. We also looked at policies related to prison-controlled bank accounts (often called “inmate trust accounts”) and related fees, as well as practices relating to collecting debts. We found that at least 16 prison systems charge incarcerated people disciplinary fines or fees:
Prison disciplinary fines and fees
We examined prison discipline and “inmate account” policies in all 50 states and the federal Bureau of Prisons to determine where fines or fees are charged to incarcerated people who are found guilty of (or accept responsibility for) a rule violation. Sixteen jurisdictions either impose fines as a sanction, or charge a questionable “administrative” fee for processing a violation.
First, second, or third violations of types (02A, 03B, 05A, 16A, AND 19A) which include assault on staff, unauthorized access, having a communication device
Charge D-3(j), having a cell phone or similar device allowing communication with the outside
Account is temporarily frozen pending the outcome of disciplinary proceedings; if person is found guilty, account is permanently frozen for the amount ordered and a check for the amount ordered is written if enough funds exist.
No account deductions are made below an account balance of $10.
In addition to any other medical costs assessed, the fee is imposed for trips to the Univ. of Iowa Hospitals and Clinics (UIHC) or a local hospital caused by an incarcerated individual’s self-injurious behavior, willful neglect, etc.
Class A (most serious) violation, specifically for assault on a non-incarcerated person, “deadly instrument,” gang-related or substance-related violations
Funds may be withdrawn without a signature to meet financial obligations; all available money in spending account will be applied. If the obligation is greater than what’s available in account, future pay and money received by outside sources are garnished.
If unable to pay debts owed at release from custody, the debt will remain active should individual return to custody.
Class C offense (only assessed if three Class C offenses occur in a 30-day period)
Funds are withdrawn from account anytime balance exceeds zero. Individual with confirmed rule violation will be required to fill out a form authorizing withdrawal. Presumably, funds are withdrawn even if they refuse to sign the form, but policy does not state this explicitly.
Every jurisdiction that charges disciplinary fines or fees does so a bit differently, but taken together, a few findings stand out:
Disciplinary fines and fees are common. In 16 prison systems, we found policies referencing fines and/or fees related to confirmed disciplinary violations (where someone is found guilty or pleads guilty). In many cases, the severity level3 of the rule violation determines the amount of the fine, but in other cases there is a “flat” charge for any violation. In either case, charging fines means that some of the most innocuous behaviors — like making “loud or disturbing noises” in Kansas prisons — have a price tag.
Most prison systems impose disciplinary fines between $5 and $25, but some charge hundreds or thousands of dollars. Incarcerated people in five jurisdictions (Alabama, Arizona, Maine, Oregon, Utah, and the federal prison system) can face triple-digit fines for a single disciplinary charge: For example, Arizona’s fines start at a shocking $500 for the first instance of what they consider the most serious violations4 and go as high as $2,000. Utah state prisons impose up to $600 for a more serious “A Code” offense, and up to $300 for a “B code” offense — which can be for things like “horseplay,” or any conduct deemed “disorderly.”
Some prison systems insidiously present these charges as “administrative” fees. We found five prison systems that charge “administrative” or “processing” fees for disciplinary violations. We include them here because they’re just as punitive and unaffordable as fines. In Georgia, for example, each guilty finding for a disciplinary violation comes with a $4 fee, unless the violation is for having a cell phone or similar communication device, a harshly-punished violation in several states;5 that specific act will set someone back a $100 “administrative processing fee.” People incarcerated in North Carolina prisons, who are charged a $10 administrative fee per disciplinary infraction, collectively lost $313,000 in fees to the state’s general fund in Fiscal Year 2022 alone.6
For incarcerated people, even “small” fines and fees can be huge setbacks
Do local jails have disciplinary fines too?
Yes, at least some of them do
Although we didn’t look specifically at jail discipline policies, we’re aware of two jail systems where disciplinary violations lead to fines: In Lancaster County, Pa., records we obtained through a Freedom of Information Act request show the enormous and arbitrary range of fines collected from people locked up in the jail. Accounts showed deductions from $0.01 to over $160.
A snippet of Lancaster, Pa. jail records categorized as “Misconduct Fees” levied on people incarcerated there throughout 2022.
Meanwhile, New York City jails impose a harsh $25 fee on all disciplinary tickets, a policy unearthed by a 2015 New Republic article focused on the backwards practice of charging people for being thrown in solitary confinement.
Outside of prison, a $5 or $10 fine might seem pretty inconsequential, or even surprisingly low. (Parking tickets, for example, are generally much more costly.) But to a typical person behind bars, a loss like this represents a serious change in financial circumstances; the value of money is simply different in prison. Prisons charge people for necessities like food and hygiene products, communication with loved ones, health care, and in some cases, “room and board.”7 And prison wages hardly cover these expenses, averaging less than one dollar per hour in most jurisdictions:
Someone in Kansas, for example, would have to work for over two months in the lowest-paying prison job to pay off a $20 disciplinary fine, the maximum charged there.8
In Virginia, where any rule violation comes with a flat $15 fine, it could take 33 to 55 hours (or one to two weeks) of work to cover that cost. Of course, this math only applies to the roughly 50% of the prison population with jobs; those earning no wages have to rely on financial support from loved ones. 9
It’s also important to note that prison disciplinary and labor systems alreadydisadvantage some more than others: Black and Indigenous people, women, and those with disabilities10 tend to face prison discipline disproportionately. And research shows racial, gender and disability disparities in how prisons assign jobs. Considering disciplinary fines in this context, it makes little economic or administrative sense to continue picking these pockets.
Almost all prison systems also order restitution, but some states’ policies are excessive and inappropriate
We also found that nearly all prison systems have a policy about facility-owed restitution, or the reimbursement of costs incurred for damaged property or medical expenses that result from a rule violation. We often think of restitution as court-ordered reimbursement to civilian crime victims — and many incarcerated people face this type of debt, too — but in a prison setting, restitution serves as little more than a running tab for the state.
Many prison restitution policies require that the amount being sought reflects the actual cost of an item or service, like the requirement to present an “itemized list of expenses and/or items damaged and costs to repair or replace” in Georgia state prisons. Such efforts to justify restitution amounts might sound reasonable to an outsider, but these “reimbursements” are to state agencies for largely budgeted costs.11 For example, some prison systems pursue restitution for things like staff overtime, vehicle mileage, and workers’ compensation costs.1213 And in a shameless move only the carceral system could devise, four states (Iowa, Georgia, Nevada, and New Mexico) seek reimbursement for medical charges related to self-harm and/or suicide. The financial cost of events that happen in prisons, which are inherently violent and mentally damaging places, shouldn’t be billed to incarcerated people and their families.
Prison systems often help themselves to the money they charge incarcerated people
In order to collect monetary sanctions, prisons will garnish (deduct) a portion — in some cases, up to 100% — of money credited to an incarcerated person’s account, whether it’s their hard-earned wages, money transfers from loved ones, or economic stimulus payments.14
Fines, fees, and restitution
Learn about the differences between these financial obligations
The fines, fees, and restitution charged to incarcerated people for breaking prison rules are often rationalized by correctional agencies as parallels to the legal-financial obligations ordered by courts outside of prisons. Indeed, courts routinely impose these costs for punitive and revenue-generating purposes. But just what are prison disciplinary systems trying to imitate when they impose these costs on incarcerated people?
Fines refer to monetary punishments. Most instances of breaking the law — from felonies to misdemeanors to municipal code violations — come with some sort of fine handed down from a court system. Like other forms of punishment, fines are meant to deter people from future rule-breaking activity.
Fees are additional costs imposed on people going through legal proceedings that are meant to raise revenue. Fees shift some of the cost of court services directly to impacted people, particularly where governments are wary of raising taxes to fund basic services such as those found in a judicial branch.
Judges are supposed to impose fines and fees after considering individuals’ ability to pay, but policy and discretion vary widely. And because they’re handed down indiscriminately, many people can’t actually pay them off, especially once they’ve accumulated. The cost of pursuing collection on these legal-financial obligations, which includes jailing people for their failure to pay, has proven to be an incredibly inefficient way for governments to raise money.
Restitution, in contrast to fines and fees, is intended to compensate victims of a crime for related loss or injury. Courts will collect restitution from people whose punishment includes it, and distribute it to known victims. Like fines and fees, restitution amounts may be unaffordable to people who owe them — especially once someone enters prison. Research suggests that only a small portion of restitution is ever collected.
A common deduction rate we found in our survey of state policies was 50%: Seven states (Iowa, Kentucky, Minnesota, Oklahoma, Pennsylvania, California, and Rhode Island) deduct up to half of incoming deposits and apply it to a debt. That means, for example, that someone with a disciplinary fine debt in Pennsylvania who earns 50 cents per hour (near the maximum prison wage there) would only receive 25 cents per hour. Some of these states further complicate matters by just taking everything: Rhode Island prisons will begin collection on a debt by taking as much of the amount owed as possible, leaving an account balance of $10, and then begin garnishing 50% of subsequent deposits to cover the rest. This means that money sent in by a loved one may never actually reach its intended recipient, but instead go straight into the prison’s pocket.
A few other states’ policies (Oregon, Texas, and Wisconsin) suggest that 100% of funds are garnished (sometimes referred to as a “freeze” on an account) to cover a debt, without leaving any amount to cover basic necessities. And while nearly all prison systems claim to provide assistance to people who are extremely poor, or “indigent,” we found that prison indigence policies are too narrowly defined and limited to be very helpful.
Prison debt collection policies can also apply post-incarceration: Some prisons hold debts like disciplinary fines or facility-owed restitution on file in case of a future return to custody. And a few cases we found, corrections departments turn into collection agents — or at least threaten to do so: In Iowa prisons, for example, if someone who owes has signed an agreement, staff may pursue debts in small claims court or by seeking to garnish their state tax refunds. In Wisconsin, transfer or release “shall not terminate the inmate’s obligation to pay ordered restitution.” It’s hard to know whether prison systems actually enforce these collection policies, but the possibility looms large over people who work hard to be truly free of prison once they’re released.
Disciplinary fines and fees are just one part of an illegitimate ‘kangaroo court’ system in prisons
Disciplinary fines and fees are only a microcosm of a much larger problem with how prisons treat behaviors and “discipline.” The comprehensiveness of prison policies on rules, sanctions, collecting debts, and disciplinary hearings might suggest that prisons offer incarcerated people transparency and due process when they’re accused of a rule violation, but evidence suggests the opposite.
In fact, incarcerated people are not entitled to many aspects of due process when it comes to disciplinary hearings, like calling witnesses and obtaining counsel. Further, disciplinary hearings in prisons only require “some evidence” (in other words, any small amount of evidence) of misconduct, a much lower standard of proof than courts require in outside legal decision-making.15 This arbitrary and shadowy adjudication process only leads to hurt and mistrust; take this scenario, based on a case observed in a 2015 study of prison discipline:
A male prisoner tosses a plastic cup half-full of liquid toward a prison officer, nearly hitting her…. [T]he result, almost inevitably, will be cellular confinement (segregation) and a loss of privileges of some sort… During this time, the prisoner’s anger at the officer will potentially increase, exacerbated by the painful conditions of solitary lockdown. When the prisoner returns, he or she will make life difficult for the officer and the officer may in turn make life difficult for the prisoner. The cycle continues.
The legitimacy and credibility of prison disciplinary hearings — or lack thereof — matter because the stakes can be high. Being found guilty of a more serious violation, in particular, can change the course of someone’s incarceration drastically, through solitary confinement, the loss of earned good time, restricted access to necessary commissary items, and the potential impact on parole decisions. Prison systems should consider how this “kangaroo court” system of disciplinary hearings unfairly and harshly punishes people for behaviors that, asmountingevidencesuggests, are often brought about by the prison environment itself. When harm does occur inside, restorative justice practices present an alternative way to problem-solve, and could lead to a more trusting, safer climate.
Disciplinary fines and fees in prisons are not “accountability”
While they may imitate the broader “justice” system in some ways, disciplinary fines and fees arguably do nothing to promote a sense of accountability or safety inside of prisons. The current approach to handling prison misconduct, in which fines play just a supporting role, is infantilizing and creates bleak conditions like solitary confinement and deprivation, which in turn lead to violence and mental health problems. To make prisons safer for everyone, administrators should overhaul disciplinary processes and provide more access to and opportunities for family contact, education, healthcare, treatment, and repairing harm.
By pulling back the curtain on murky aspects of everyday prison life like discipline, we hope prison administrators and policymakers will see that incarcerated people are starved for opportunities to achieve economic, professional, and personal growth, and that disciplinary sanctions undermine these goals.
Footnotes
There are many terms for alleged rule violations in prisons: tickets, writeups, infractions, violations, disciplinary reports (or D-reports), bookings, etc. Once they are confirmed violations, through a guilty finding or plea, the corresponding punishments are typically called sanctions, or sometimes penalties. ↩
The punishments for rule violations in prison typically include other losses that put goods and services out of reach, such as being banned from commissary, visitation and/or phone use, and recreation for a period of time, removal from programs, solitary confinement, or confinement to one’s own cell. In states that do impose disciplinary fines, a combination of other sanctions is often handed down at the same time. ↩
Many prison systems have categorized rule violations in some hierarchy ranging from least to most serious, using letters, numbers, or words like “major” and “minor.” Our disciplinary policies resource page explains these categories where information is available. ↩
Arizona’s steep prison disciplinary fines are imposed for a strange subset of violations, which include assaults on staff (whether resulting in injury or not), arson, possession of a communication device or a component of one, and tampering with a lock or door. They’re not imposed for other instances of grave misconduct like assault on other incarcerated people, sexual assault, or possessing a weapon. ↩
Though having a cell phone is essential for navigating the world today, many state prisons treat possession of contraband cell phones and similar devices as one of the most serious types of misconduct, represented in some cases (like Georgia) by a heavy fine. Alabama and Arizona also come down hard on people with cell phones, at least when it comes to disciplinary fines and fees; we haven’t done a 50-state scan of states that treat this violation harshly with non-monetary sanctions. ↩
This figure came from the response to a public records request we filed with the North Carolina Department of Adult Corrections in October 2023. ↩
According to analysis from the Brennan Center, as of 2015, at least 43 states authorize room and board (or “pay-to-stay”) fees to incarcerated people. ↩
According to the ACLU’s report Captive Labor: Exploitation of Incarcerated Workers, the lowest wage paid to incarcerated workers in Kansas’ state prison system is just $0.45 per day; a $20 fine, then, would take 44 work days to pay off, assuming wages aren’t garnished for other reasons. ↩
A report from Human Rights Watch explains in detail how incarcerated people with mental disabilities have several aspects of prison environments working against them when it comes to behavior and discipline. Many correctional officers are not trained to recognize signs of mental illness and may find certain behaviors frightening or threatening; as a result, people with mental illness are punished for disciplinary violations at higher rates than general prison populations. And when those people are placed in solitary confinement for disciplinary or other reasons, they are less likely to receive treatment and more likely to engage in misconduct (or perceived misconduct) in the future. Regarding economic status, though not covered in our own report Prisons of Poverty, people with disabilities are much more likely to live in poverty or face economic hardship compared to the average American. ↩
For example, the Connecticut Department of Corrections budgets included “workers’ compensation claims” as a line item until it was consolidated with other state agencies’ claims, and the Department is required to report to the legislature its “estimated costs associated with staffing deficiencies [and] overtime costs.” In another example, Arizona’s Department of Corrections budget includes “mileage – private vehicle” in several sections. See footnote 11 for similar items in Iowa’s budget. ↩
These are just a few things included in Iowa’s far-reaching policy on prison-owed restitution. Notably, travel, workers’ compensation reimbursement, and “state vehicle operation” appear throughout the department’s budget as budgeted expenditures. ↩
While it’s easy to assume that correctional employees hurt on the job are typically injured by incarcerated people (which might justify these restitution policies to some), this may not be the case. An Inspector General report investigating the New York prison system found that “from 2015 through 2021, on average, 66 percent of all workers’ compensation injury claims did not involve contact with an incarcerated person. That is, year after year, on average, the number of claimed injuries not involving contact with an incarcerated person is almost double those injury claims that do.” ↩
Prison debt collection policies exist even in jurisdictions that don’t charge disciplinary fines, because they collect other fees not related to discipline, and collect debt on behalf of other agencies, like court systems. ↩
The standard of proof used in legal decision-making is called a “preponderance of the evidence,” which means proving that something is more likely than not to be true. ↩
Despite the common refrain that jails and prisons are "de facto treatment facilities," most prioritize punitive mail scanning policies and strict visitation rules that fail to prevent drugs from entering facilities while providing little to no access to treatment and healthcare.
Jails and prisons are often described as de facto mental health and substance abuse treatment providers, and corrections officials increasingly frame their missions around offering healthcare.1 But the reality is quite the opposite: people with serious health needs are warehoused with severely inadequate healthcare and limited treatment options. Instead, jails and prisons rely heavily on punishment, while the most effective and evidence-based forms of healthcare are often the least available.
This tension points to a crucial flaw in our nation’s reliance on criminalization: these institutions were never intended to be – and can never function as – healthcare providers. Efforts to reverse engineer them as such have proven ineffective, harmful, and financially wasteful, substituting medical best practices with moralizing and surveillance, from providing exclusively abstinence-based education to scanning and photocopying mail in a vain attempt to keep contraband out. This briefing builds on our past work about the unmet health needs of incarcerated people and the endless cycle of arrest for people who use drugs by compiling data on treatment availability versus drug-related punishment in jails and prisons across the country. We find that despite the lofty rhetoric, corrections officials punish people who use drugs far more than they provide them with healthcare.
Substance use disorders in jails and prisons far outpace rates in the general public
The prevalence of substance use disorders at every level of the criminal legal system points to an unavoidable fact: despite the deep unpopularity of the War on Drugs, our society still responds to substance use (and related crimes) as individual failures requiring punishment, rather than as a public health problem — and it’s not working.
Nationally, approximately 8% of people met the criteria for substance use disorders in 2019,2 but such disorders are far more common among people who are arrested (41%) and people incarcerated in federal (32%) or state prisons (49%). This means that approximately three million people with substance use disorders are locked up in any given year: at least two million people with substance use disorders are arrested annually and about half a million people in state and federal prisons meet the criteria for such disorders at the time of their admission.3
Based on 2019 data from the National Survey of Drug Use and Health (NSDUH) from SAMHSA, approximately 8% of people over the age of 12 met the criteria for a substance use disorder, and 41% of people who had been arrested in the last year met the criteria for a substance use disorder. In 2016 (the most recent year for which the Bureau of Justice Statistics published national prison data), 47% of people in state and federal prisons met the criteria for a substance use disorder in the 12 months prior to their most recent prison admission.
It’s difficult to see more granular trends in the data – such as the type of substances involved or the health outcomes related to these disorders – but we have some clues from nationally representative jail, prison, and mortality data.
Jails. In 2019, only 64% of all people admitted to jail each month were screened for opioid use disorder, but of those people, about 15% met the criteria for opioid use disorder. It’s likely that in jails where not everyone is screened on admission, people have similarly high rates of opioid use disorder, given the widespread extent of the opioid crisis.4 Because we cannot see the full picture through screenings alone, it’s useful to look at mortality data as well. More than 15% of jail deaths in 2019 were attributed to drug or alcohol intoxication (overdose), a significant increase from 4% in 2000 and 7% in 2009.
Prisons. Many people who use drugs and need care are arrested and jailed over and over until, finally, one event lands them in prison. We estimate that more than 578,000 people (47%) in state and federal prisons in 2022 had a substance use disorder in the year prior to their admission.5 And while the mortality rates for drug and alcohol intoxication are lower in prisons than in jails, almost 7% of all deaths in state prisons in 2019 were due to drug or alcohol intoxication, compared to less than 2% in 2009. Meanwhile, in 2019, only 4% of all adult deaths in the U.S. were attributed to drugs or alcohol.6 All of these measures point to much higher rates of substance use disorders in prisons and jails compared to the total population.
Treatment options for opioid use disorder are scarce in jails and prisons
Not every person who uses substances needs or wants treatment, but it is imperative that evidence-based, quality healthcare options be made available for those who do — regardless of their involvement in the criminal legal system. For people with opioid use disorder, this can include psychosocial treatment (including counseling), medication-assisted treatment (MAT), and self-help groups. In correctional settings, the availability of such options pales in comparison to the level of need.
Medication-assisted treatment (MAT) for opioid use disorder
A brief primer on MAT
Medication-assisted treatment (MAT) is widely described in medical literature as the gold standard of care for opioid use disorder. Sometimes referred to as medications for opioid use disorder (MOUD) and opioid substitution treatment (OST), MAT requires the combination of professional counseling or therapy with prescribed medications.7 There are three medications that can be used for MAT for opioid use disorder, and the FDA states that anyone seeking such treatment “should be offered access to all three options”:8
Buprenorphine: Partially activates the same brain receptors as opioids, preventing withdrawal symptoms and cravings, but additional doses can have a limited effect (known as the ‘ceiling effect’). An individual is supposed to be in “mild to moderate withdrawal” when beginning treatment. The popular medication Suboxone combines buprenorphine and naltrexone, and can also be highly effective in treating opioid use disorder.
Methadone: Fully activates opioid receptors, just like other opioids. It is only available in hospital settings or at federally certified opioid treatment programs.
Naltrexone (also known as Vivitrol): Blocks other opioids from having any effect. Importantly, individuals are required to complete withdrawal and remain abstinent for one to two weeks before starting treatment.
A significant body of research shows that MAT is more effective than other treatments – including medications alone or counseling alone – in reducing opioid use, increasing treatment participation, reducing injection drug use, and decreasing transmission of HIV and hepatitis C outside of carceral settings.
The limited – but growing – research regarding MAT in jails and prisons shows similar results. For example, the Rhode Island Department of Corrections became the first state correctional system to institute a comprehensive opioid-treatment program that involved offering MAT with all three medications to incarcerated people in 2016. After the first year of this program, statewide overdose deaths dropped 12% and post-incarceration overdose deaths dropped 61%.
Jails. Of the nearly 3,000 local jails across the country, less than two-thirds (63%) screen people for opioid use disorder when they are admitted. Only half (54%) provide medications for people experiencing withdrawal. An even smaller percentage of jails — 41% — provide behavioral or psychological treatment, and 29% provide education about overdose. In fact, the most effective treatment — medication-assisted treatment (MAT) — is the least commonly provided: just 24% of jails continue MAT for people already engaged in treatment while only 19% initiate MAT for those who are not.
Quality medical interventions for people that use opioids are especially urgent in jails because of the rapid and acute risk of withdrawal. Over half a million people9 entering jails across the country each year are experiencing or at risk of this life-threatening medical event.10 Importantly, the percentage of people admitted to jail who receive treatment for opioid withdrawal varies significantly between states, which likely reflects differences in both opioid use and availability of treatment.11 For instance, over 15% of people admitted to jails in June 2019 in four states – New Hampshire, New Jersey, Pennsylvania, and Washington – were treated for opioid withdrawal, compared to less than 1% of admissions in seven other states.12
Prisons. Most state and federal prisons (81%) offered some “drug or alcohol dependency, counseling, or awareness programs” in 2019, but among people in state prisons with a substance use disorder, only 10% had received clinical treatment in the form of a residential treatment program, professional counseling, detoxification unit, or MAT.13 This suggests the “drug or alcohol programming” available in prison facilities is primarily self-help or peer-based.14
Unfortunately, MAT is the least common treatment in prisons: only 1% of people with substance use disorders in state and federal prisons reported receiving MAT at any point since their admission. In North Carolina, for example, over 9,000 people admitted to state prisons in Fiscal Year 2021-22 (78% of everyone screened during intake) met the criteria for needing intermediate or long-term substance use treatment, but the clinical director of the Alcoholism and Chemical Dependency Programs reports that they are only able to treat 3,000 cases each year. The state launched a MAT pilot program in 2021, and as of January 2024, only 213 enrollees have received medications prior to release from prison.
Even when correctional facilities do offer necessary treatments, their one-size-fits-all approaches can be limiting, overlooking the specific needs of different populations. For example, women in prison are often expected to participate in treatment programs originally designed for men. Advocates report that because “there are fewer incarcerated women than men… there are fewer programs available for women serving time. If support is available, it is not always effective.”
Ineffective and punitive responses to drug use in correctional facilities
Correctional facilities’ preference for punishment does very little to actually reduce drug use and overdoses. It’s not just that officials fail to provide evidence-based healthcare–they actively ignore evidence that punitive drug interdiction policies like mail scanning and visitation restrictions are ineffective and counterproductive, too.
Mail scanning. Prisons and jails are increasingly diverting incoming letters, greeting cards, and artwork, making photocopies or digital scans of them, and delivering those inferior versions to recipients.15 Administrators claim this practice will stem the flow of contraband — primarily, drugs — into their facilities, but there is no solid evidence to date that mail scanning has this intended effect.16 In addition to the emotionalconsequences and needless exploitation inherent in mail scanning, these practices result in long mail delays and the disruption of correspondence-based nonprofits, education programs, and ministries.
There are numerous examples of mail scanning failing to produce any meaningful reduction in drug use or overdoses in prisons across the country:
Pennsylvania: After instituting mail scanning, the percentage of incoming mail that the Department of Corrections reported as “tainted” only decreased by 0.1% over the course of a year. As of 2023, the rate of positive drug tests in Pennsylvania prisons is now almost 3 times higher than it was before the policy was introduced.
Missouri: In Missouri state prisons, the average number of overdoses per month increased from 34 to 39 after mail scanning was introduced in July 2022.
Virginia: Every year since the Virginia Department of Corrections began mail scanning in 2017, there have been more overdoses than in the year prior to instituting mail scanning (even while the state’s incarcerated population declined during the COVID-19 pandemic).
New Mexico: After a mail scanning policy went into effect in February 2022, a report on the Corrections Department from the state’s Legislative Finance Committee highlighted a nearly two-percentage point increase in positive random drug test results from Fiscal Year 2021 to Fiscal Year 2022 – almost doubling the positivity rate. This essentially “reverse[d] three years of reduced drug use” in the prison system, and the report authors noted that the mail scanning policy “does not appear to have reduced drug use” during the study period.
In fact, several prison systems seem to actively ignore the lack of evidence supporting mail scanning as a drug interdiction effort. The federal Bureau of Prisons has increasingly adopted mail scanning policies, reportedly following a letter from Pennsylvania congressional representatives “urg[ing] the BOP to follow Pennsylvania’s lead,” and such policies are now in place in almost every federal facility.
Visitation restrictions. There are a variety of policies in jails and prisons that restrict visitation and administrators often defend them as anti-contraband (i.e., anti-drug) initiatives. For example, in Virginia, some of these policies have included requiring visitors to change into state-issued jumpsuits without pockets, limiting approved visitor lists to 10 people, millimeter wave body scanners, and banning feminine hygiene products for visitors.17 In Washington, the latest state budget proposal betrays the state’s biases in responding to drugs in prisons: it includes $4.7 million for MAT in prisons, which is only about half of the funding it would take to meet the needs of people in custody. At the same time, the Department requested $6.5 million for body scanner staff and operations, and the budget proposal offers even more than they asked for: $7.9 million. Incarcerated people routinely face humiliating search practices – including strip searches – following visitation, but considering the prevalence of drug use inside prisons and jails, these tactics do not appear to have made a meaningful impact.
Doubling down on failure: misunderstanding drug use inside
Prison and jail administrators often cite contraband medication as the primary reason for restricting access to MAT. While “diversion” of medications18 like buprenorphine can occur in prisons and jails, there are simple, proven diversion prevention strategies that any facility offering MAT could institute, whether they are correctional facilities or community health centers. 19 We know that generally, “illicitly obtained” buprenorphine is most often used to self-treat opioid withdrawal when treatment is not available or has been denied. While there is much concern regarding diversion, an extensive analysis of Bureau of Justice Statistics’ mortality data from 2000-2013 revealed no overdose or death reports mentioning buprenorphine or Suboxone, consistent with previous research on New York City non-incarcerated overdose fatalities. It is clear that – just like in the community – the proven benefits of MAT outweigh the perceived risks of diversion.
Consistent with their punitive approach to drugs, many corrections officials enforce serious sanctions for positive drug tests, medication diversion, and non-fatal overdoses. Sanctions for drug use in prisons can include solitary confinement, denied visitation, 20 delayed parole hearings, loss of “good time,” reduced access to programming, facility transfers, reclassification, and fines.21 There is, unsurprisingly, no evidence that these disciplinary policies actually reduce drug use behind bars. However, it’s easy to imagine how such approaches create a dynamic in which people hide their drug use and engage in riskier, deadlier behaviors. The culture fostered by punishment does not actually address drug use — it just makes it more dangerous.
Public health research has long been clear that punishing addiction does not actually help address substance use disorders, and there is no reason that it would work in jails and prisons. People who need mental health and substance use treatment are better served in voluntary, non-carceral, clinical treatment settings.
Overdose interventions and deaths
Jail and prison administrators are right to be concerned about drug overdoses behind bars. Overdose deaths are preventable and substance use disorders are treatable, but in 2019, more than 400 people in jails and prisons died of drug or alcohol intoxication.22
Jails. In response to overdoses, some local jails have increased the availability of naloxone (an opioid overdose reversal medication also known by the brand name “Narcan”). In Maine, correctional staff in some facilities now carry naloxone on their belts rather than in a locked first aid kit. In New York City, all housing areas are required to have naloxone available.
Some jails have gone a step further: in San Diego County, the staff and people in custody have access to naloxone throughout the jail facility. In Los Angeles County jails and the Louisville Metro Department of Corrections jail in Kentucky, staff and incarcerated people have access to naloxone and receive training on how to administer it. The benefits of this dual approach cannot be overstated: in a single day in Los Angeles, two overdoses were reversed when incarcerated people administered naloxone and, over the course of a year, incarcerated people in the Louisville jail dispensed naloxone successfully to at least 24 people who had overdosed in the facility.
Prisons. The rates of death from drug or alcohol intoxication may be lower in prisons than in local jails, but they are still a serious – and growing – problem: from 2001 to 2019, the percentage of state prison deaths attributed to drug and alcohol intoxication increased from 1.2% to 6.6%. A September 2022 directive from the New York State Department of Corrections and Community Supervision requires correctional staff to administer naloxone as well as provide first aid and CPR as necessary, and includes a requirement for each facility to institute a procedure to make naloxone more accessible to staff. In Oklahoma, the State Department of Mental Health and Substance Abuse Services reported that naloxone is available “on every unit” in state prisons, and future initiatives where “every CO will have Narcan on them” are expected as of May 2023.
Making naloxone physically present in correctional facilities is a good first step, but it’s not enough. In April 2023, reporting from Filter detailed that, while correctional staff in Washington Department of Corrections facilities have access to naloxone, many are not properly trained. When interviewed, two correctional officers – incorrectly – told the reporter that “Narcan…doesn’t work on fentanyl.” The Filter story cites at least one Department of Corrections report of an overdose scene where staff were unable to locate, and were unsure how to administer, naloxone. As long as the criminal legal system continues to target and incarcerate people who use drugs, screening new admissions for opioid use, training staff and incarcerated people to use naloxone, and making naloxone available throughout facilities are the least these institutions could do.
Making reentry safer for people who use drugs
There are two crucial interventions that every jail and prison should offer upon release: free access to naloxone and appropriate, timely referrals to community-based MAT for people who received treatment while incarcerated. Yet less than one-third of local jails and far fewer prison systems offer either.
Naloxone. While naloxone is relatively inexpensive and easy to administer, in 2019, only 25% of jails provided naloxone to people being released. However, in the years following the 2019 survey, media coverage reveals that many jails – including those in Louisville, Kentucky, and Kershaw County, South Carolina – have added free naloxone vending machines near the facility exits.
In 2020, the California Department of Corrections and Rehabilitation began providing free naloxone kits and training to people preparing for release from prison. By July 2022, 95% of people released from California state prisons had received the kits and training. A handful of other prison systems have publicized similar efforts to provide naloxone on release but with little accompanying data on the success of their projects. For example, the Indiana Department of Corrections announced an initiative in 2020 to offer people released from prison the “opportunity to leave with Naloxone,” but there is little evidence available on the outcome of this program. Meanwhile, some states remain hostile to this very simple and effective intervention. In 2023, Oklahoma Governor Kevin Stitt vetoed a bill that would allow prisons to give Narcan to people upon release.23
Community referrals for MAT. In 2019, only 28% of local jails provided a community link to MAT on release. Jails need to partner with their local public health agencies to identify community-based MAT providers for people returning home. For people who started or continued MAT while in jail, uninterrupted access to that treatment is vital. These efforts must include support in navigating the often-complicated health insurance landscape. In 2019, 27% of people on parole and 23% of people who had been arrested at least once in the past year reported having no health insurance coverage. People leaving jail or prison who need MAT must have primary care providers and Medicaid, Medicare, or other health insurance set up prior to release.
Recommendations
It is clear that the criminal legal system is not suited to the task of acting as the de facto mental health and substance abuse treatment provider many claim it to be. There are at least a few areas ripe for intervention to improve this situation: reducing the number of people with substance use disorders entering the criminal legal system, instituting evidence-based practices in correctional facilities that actually reduce the risk of drug overdoses, and expanding treatment availability inside jails, prisons, and during reentry.
Prevent people with substance use disorders from entering the criminal legal system:
Address the social determinants of health and substance use. In order to reduce the flow of people with substance use disorders into jails and prisons, communities must prioritize housing, physical and mental healthcare, employment, and education. Increased funding for community-based drug treatment and other social services are crucial.
Institute effective, nonpunitive responses to drug use behind bars:
Screen for all substance use and mental health disorders. All admissions to prisons and jails should be screened for active substance use, substance use disorders, and mental health conditions.
Avoid punishments and restrictions as responses to drug use, particularly when there is no evidence that they meaningfully impact consumption and overdose. Reflexively restricting meaningful contact and relationships under the guise of drug prevention is especially harmful and counterproductive. This inevitably requires divesting from ineffective practices like mail scanning, canine drug detection, and electronic scanning equipment for visitation. There should be more focus on treatment than punishment for incarcerated people who struggle with addiction.
Invest in comprehensive MAT in jails and prisons including professional, clinical counseling, the availability of all MAT drugs, referrals to community providers upon release, and support reestablishing health insurance during reentry.
Expand treatment availability for substance use disorders:
Treatment participation must be voluntary in jail, prison, and the community. When treatment is involuntary or coerced, when people are re-incarcerated for positive drug tests, or when they’re disqualified from participation in diversion programs based on their history of substance use, treatment is less effective. Instead, as the Drug Policy Alliance recommends, treatment should always be voluntary, involve clinicians rather than law enforcement, incorporate positive incentives, and use gold-standard medication and other practices.
Treatment should begin as soon as possible. Any kind of treatment for substance use disorders and mental health conditions cannot be limited to the weeks or months leading up to release from jail or prison.
Treatment requires informed consent. Healthcare providers should seek out informed consent from all individuals who are eligible for MAT and they must have access to all treatment options.
Substance use disorder treatment — as handed down by the criminal legal system — is not working as advertised. Jails and prisons are not healthcare institutions and their mandate for punishment makes patient-centered care impossible and health outcomes worse. Instead, the United States desperately needs healthcare infrastructure that can support people who use drugs outside of carceral settings. While corrections officials request further investments under the guise of treatment, the stigma, isolation, and punishment that helped foment the present crisis persist. Our communities cannot punish their way out of public health crises, but as long as policymakers insist on incarcerating people with substance use disorders, they need to at least provide evidence-based care to those who want and need it.
Footnotes
In December 2023, for example, the Arapahoe County (Colorado) Sheriff justified an expected $46 million jail expansion project by claiming the jail needs more space to provide healthcare services to confined people: “The needs of the people that we are in custody of have changed,” Brown said. “We’re not warehousing individuals anymore. We’re treating them.” ↩
The National Survey of Drug Use and Health (NSDUH) surveys a nationally representative sample of people aged 12 and older. For the purposes of this analysis, we chose to use data collected in the 2019 NSDUH rather than the more recent 2020 survey results. In the 2020 NSDUH report, the authors cautioned that “care must be taken when attempting to disentangle the effects on estimates due to real changes in the population (e.g., the coronavirus disease 2019 [COVID-19] pandemic and other events) from the effects of these methodological changes.” Because of this warning, we elected to use 2019 NSDUH so that our results could be better compared over time and to the available criminal legal system data, which is primarily from 2016-2019. Researchers updating our work in the future, however, should note one important methodological change occurred in 2020: the 2020 survey was the first year in which substance use disorders were evaluated using criteria defined in the Diagnostic and Statistical Manual of Mental Disorders, 5th edition (DSM-V), as opposed to the 4th edition (DSM-IV). ↩
In 2016, 47% of people in state and federal prisons met the criteria for substance use disorders prior to admission. Applying this percentage to the 2022 combined state and federal prison population of 1,230,100, we estimate that at least 578,147 people met substance use disorder criteria prior to admission. ↩
In small jails (holding less than 50 people), only 36% of admissions were screened, but they still had 15% of people screening positive. In jails with 50-250 people, about half (51%) of admissions were screened, and the percentage screening positive was higher: 19-22%. The largest jail jurisdictions (holding 1,000+ people) had higher screening rates but lower rates of positive screenings, which suggests that some smaller jurisdictions may only be screening people whom they suspected of having an opioid use disorder. ↩
In 2016, 47% of people in state and federal prison met the criteria for substance use disorders in the year prior to admission. Applying this percentage to the 2022 prison population of 1,230,100, we estimate that 578,147 people met substance use disorder criteria in the year prior to admission. ↩
Centers for Disease Control and Prevention, National Center for Health Statistics. National Vital Statistics System, Mortality 2018-2021 on CDC WONDER Online Database, released in 2021. Data are from the Multiple Cause of Death Files, 2018-2021, as compiled from data provided by the 57 vital statistics jurisdictions through the Vital Statistics Cooperative Program. Query criteria included ages 18 and older, drug- or alcohol-induced causes of death, and data for 2019. ↩
Other substance use disorders can be addressed with MAT. For example, there are medications for alcohol use disorder (MAUD) that include acamprosate, disulfiram, and naltrexone. However, for the purposes of this briefing, we are focused on MAT for opioid use disorder (also known as MOUD) as there is little to no information about MAUD in prisons and jails. ↩
A 2019 study based on interviews with state prison representatives from 21 states found that only 7% of prisons in these states offered all three medications. The most commonly provided was naltrexone, which was provided in 36% of prisons in the survey. While any MAT is better than no treatment, there is some evidence that people who receive buprenorphine have significantly lower risk of opioid overdoses than those who receive naltrexone. ↩
This estimate is calculated based on the 5% of all jail admissions in June 2019 that were treated for opioid withdrawal with medications and the 894,030 jail admissions in June 2019. This is inevitably an undercount, as not all people admitted to jail in active withdrawal are provided with medical care. If 5% of the people admitted to jail in a single month were treated for withdrawal, that means that at least 536,400 people entering jails in 2019 met the criteria for medical intervention for opioid withdrawal. ↩
Deaths associated with alcohol or drug withdrawal (which can belethal, especially among people with multiple health concerns) are not included in the “drug or alcohol intoxication” deaths reported in the Bureau of Justice Statistics mortality data, but rather these deaths are most often included in the counts of deaths attributed to “illness” or “other,” according to the Bureau of Justice Assistance. In an extensive analysis of Bureau of Justice Statistics’ mortality data from 2000-2013, researchers found that drug and alcohol related deaths in jails were likely significantly underreported and that there were “roughly 50% more deaths involving drugs or alcohol than previously estimated,” including at least 87 withdrawal-related jail deaths. ↩
Kansas, Nebraska, North Dakota, South Dakota, Alaska, Idaho, Wyoming treated less than 1% of statewide jail admissions for opioid withdrawal in June 2019. ↩
Detoxification: An alcohol or drug detoxification unit where prisoners spent up to 72 hours to “dry out.”
Residential program: An alcohol or drug program in which prisoners lived in a special facility or unit designated for treatment.
Counseling and therapy: Counseling sessions with a trained professional while not living in a special facility or unit.
Self-help group: Includes peer counseling programs, such as Alcoholics Anonymous, Cocaine Anonymous, or Narcotics Anonymous, and other forms of self-help groups.
Education program: An education or awareness program “explaining problems with alcohol or drugs in any setting.”
Medication-assisted treatment: A maintenance drug, such as methadone, disulfiram, or naltrexone, that is used to “cut a high or make you sick.”
There is nothing inherently wrong with offering self-help, 12-step, or peer-counseling programming in prisons. It is only problematic when facilities only offer these types of interventions to people eligible for MAT and/or other clinical treatments ↩
Paper mail is often the cheapest and most-used form of communication for people in prison and their loved ones. ↩
In addition, there are other significant avenues through which drugs flow into prisons – including via correctional officers. The federal Bureau of Prisons reported on staff bringing drugs into facilities as early as 2003. More recently, there have been substantiated reports of correctional officers bringing drugs into an Ohio jail, a federal facility in Atlanta, and New York City jails. A 2018 report from NYC’s Department of Investigation revealed that an undercover investigator smuggled in scalpels, marijuana, and Suboxone into the Manhattan and Brooklyn Detention Centers, passing through “all screening checkpoints at both facilities without being manually searched,” even after triggering multiple metal detection devices. A 2023 report from the Office of the Inspector General in California reported that while all California Department of Corrections and Rehabilitation (CDCR) staff and contractors are supposed to be searched, these searches are often inadequate. The report also cites an agreement between the CDCR and the California Correctional Peace Officers Association that stipulates “enhanced inspections will not include a hands-on, physical search of an employee’s person or the use of canines.” ↩
In-person visitation is one of the most important factors for maintaining family and community support through incarceration and setting up individuals for successful reentry. ↩
April 15-17, 2025: Sarah Staudt, our Director of Policy and Advocacy, will be attending the MacArthur Safety and Justice Challenge Network Meeting from April 15-17 in Chicago. Drop her a line if you’d like to meet up!
Not near you? Invite us to your city, college or organization.


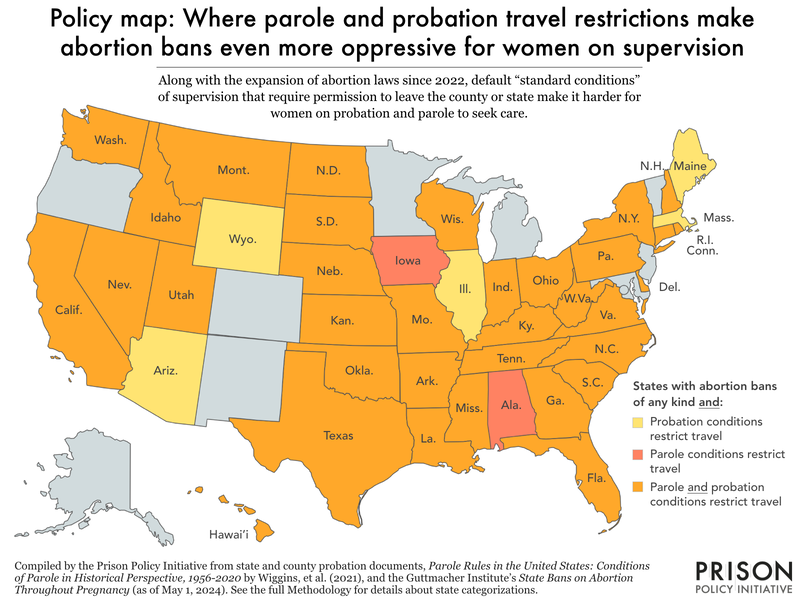
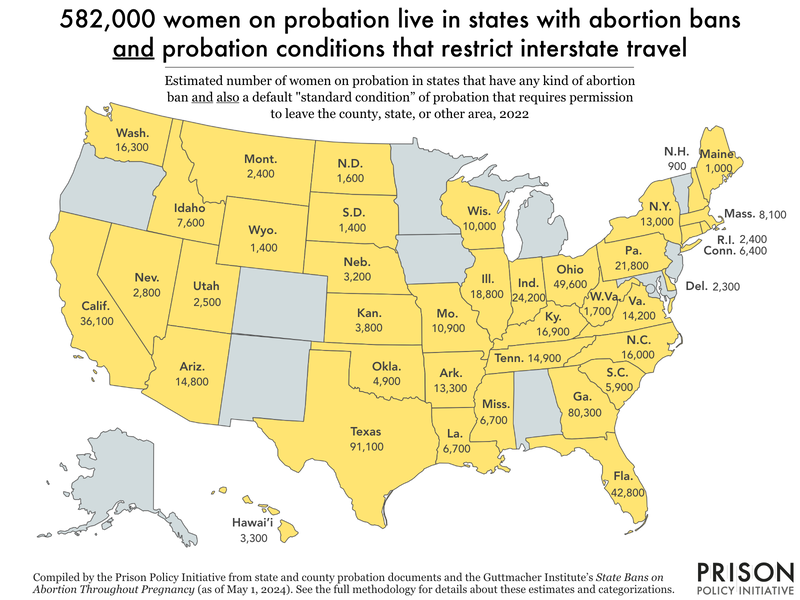
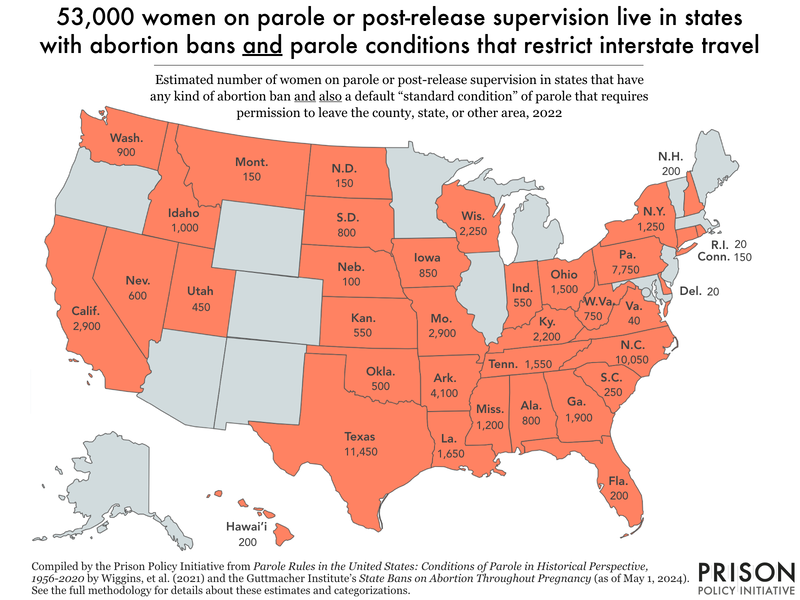


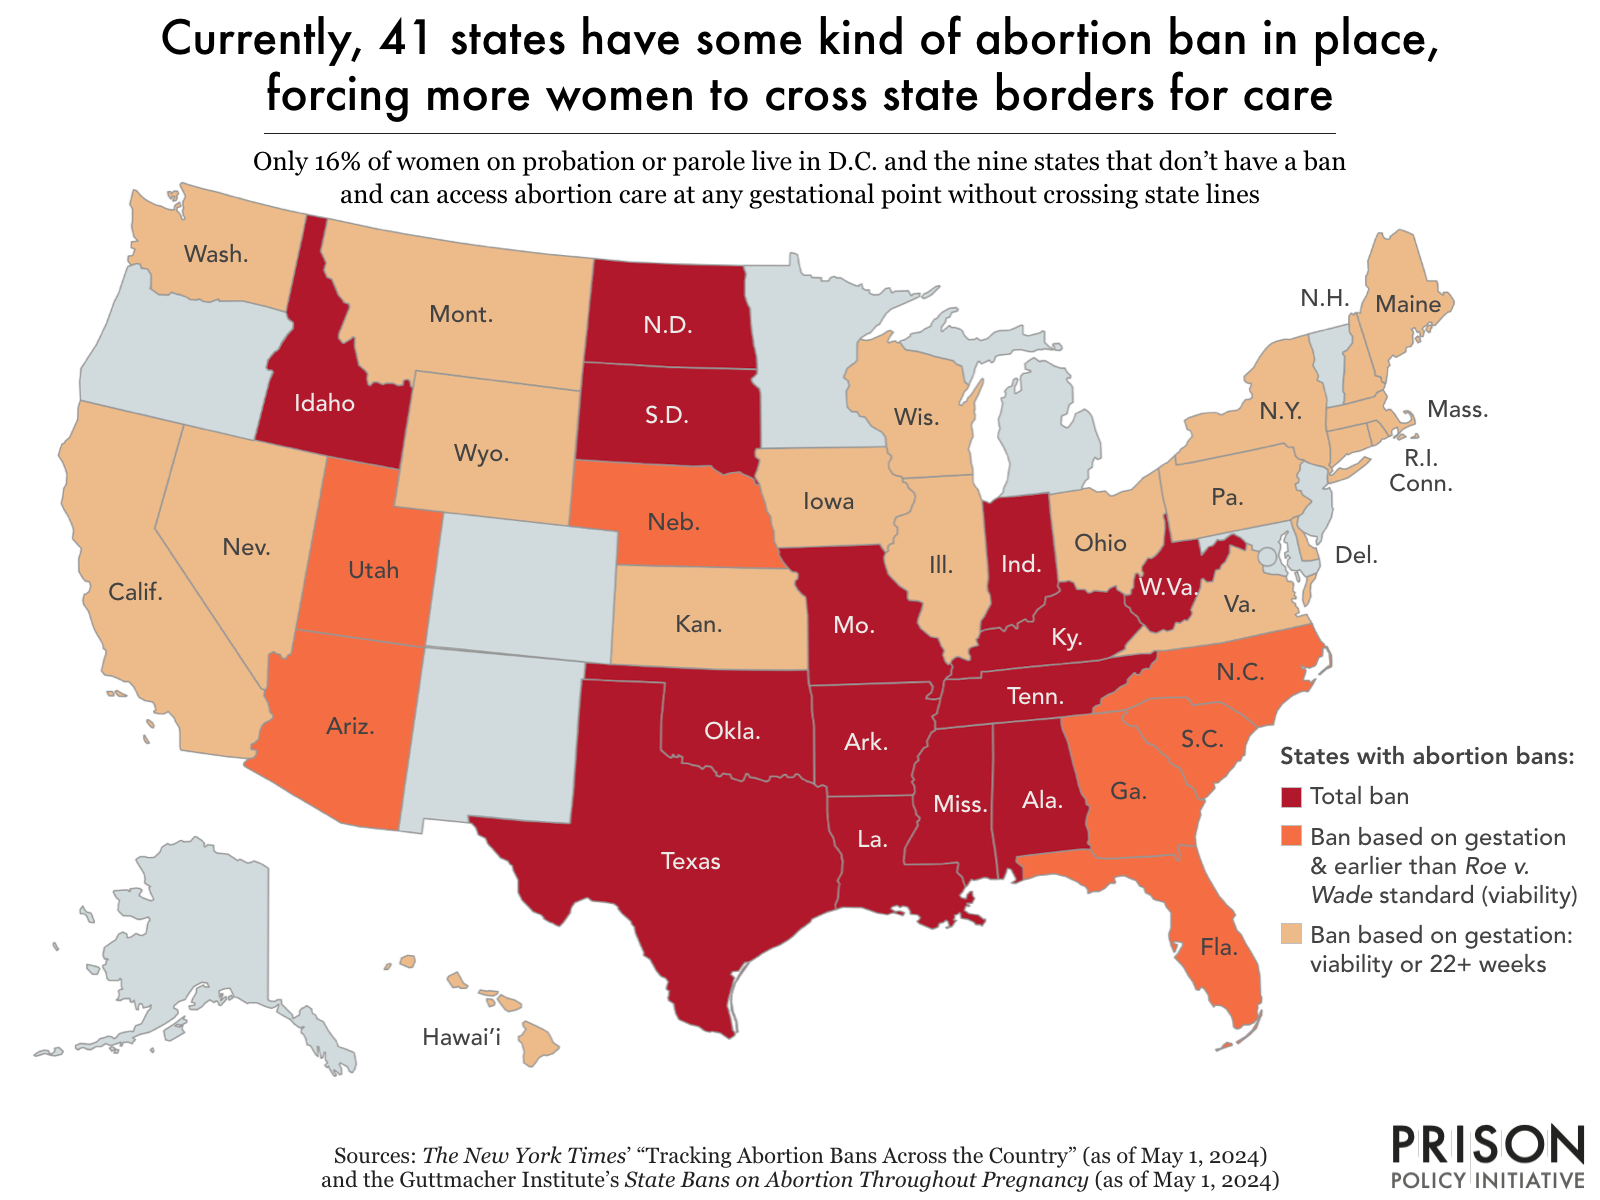
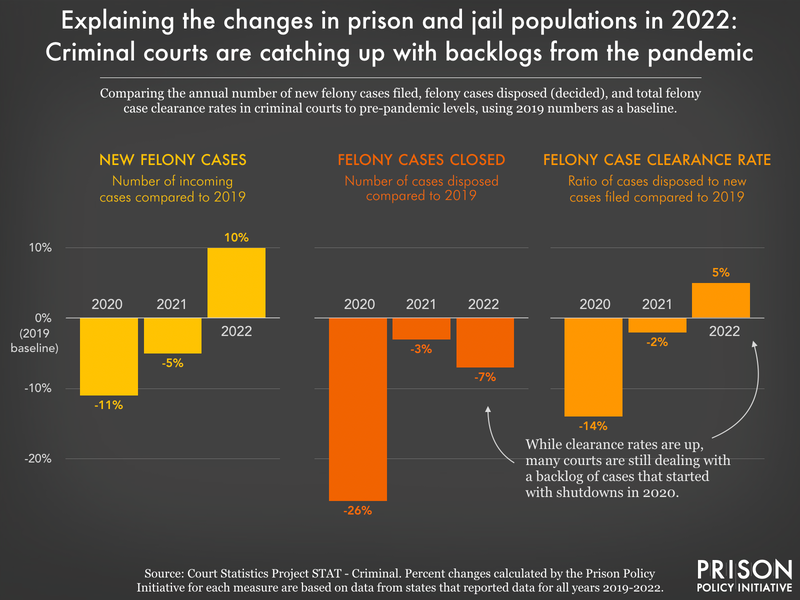